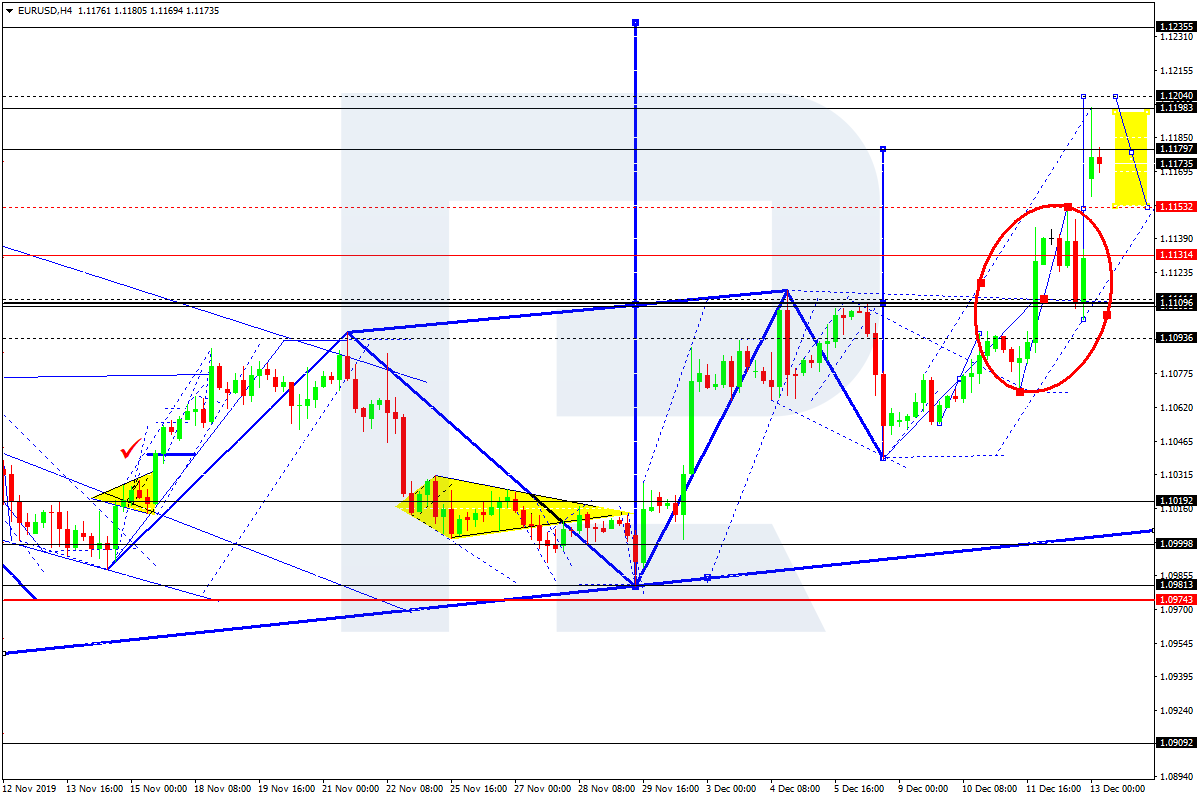
EURUSD, “Euro vs US Dollar”
After forming a continuation pattern around 1.1111 and breaking 1.1153, EURUSD has almost reached the short-term upside target at 1.1098. Possibly, today the pair may consolidate around 1.1180 and expand this range both upwards and downwards, 1.1200 and 1.1155 respectively. If later the price breaks this range to the upside, the market may resume moving upwards with the key target at 1.1236 if to the downside – start a new correction to reach 1.1111.

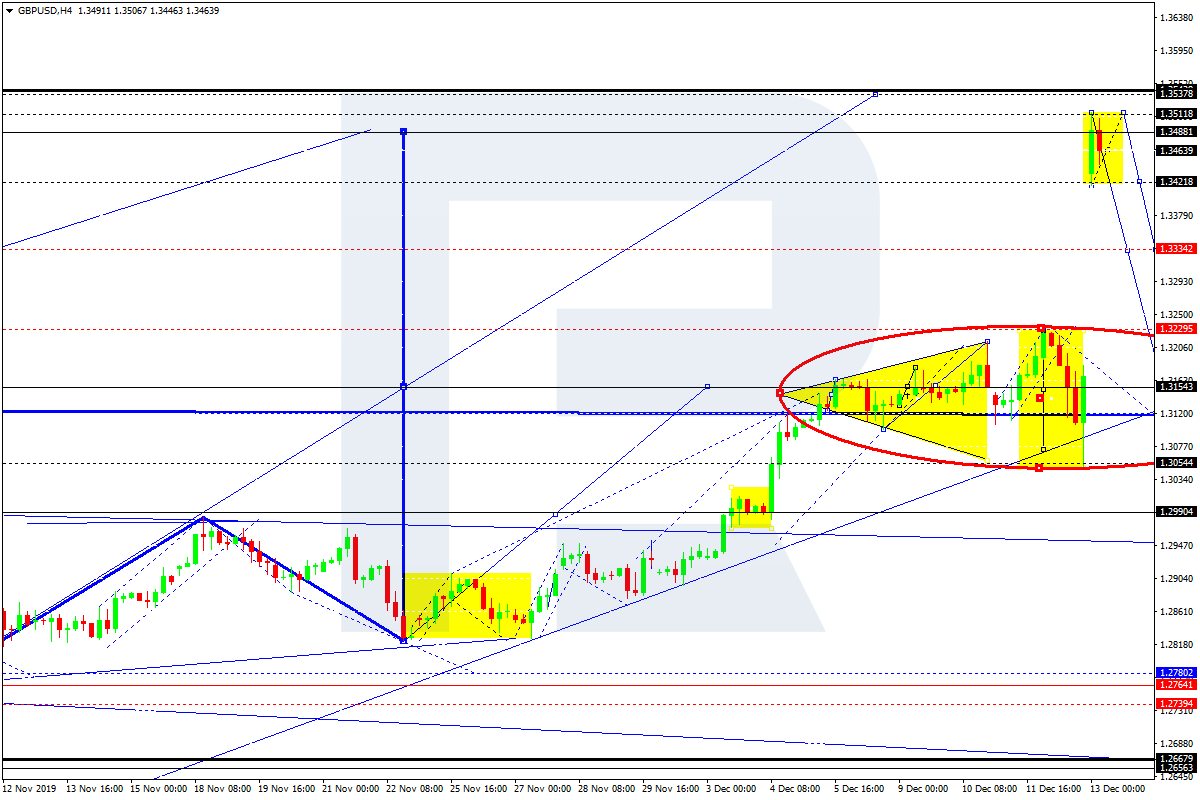
GBPUSD, “Great Britain Pound vs US Dollar”
After rebounding from 1.3050 and breaking 1.3225, GBPUSD has almost reached the short-term target of the third ascending wave at 1.3488. Today, the pair may consolidate around this level. If later the price breaks this range to the downside at 1.3420, the market may start a new correction to reach 1.3333; if to the upside at 1.3511 – expand the range towards 1.3539 and then resume moving downwards with the target at 1.3200.
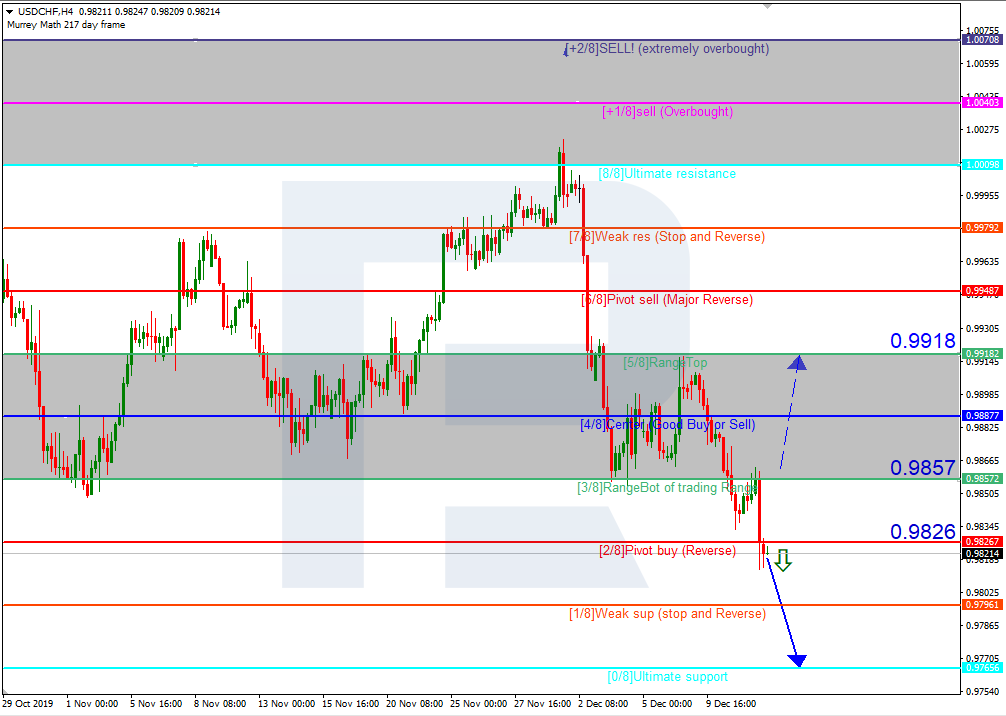
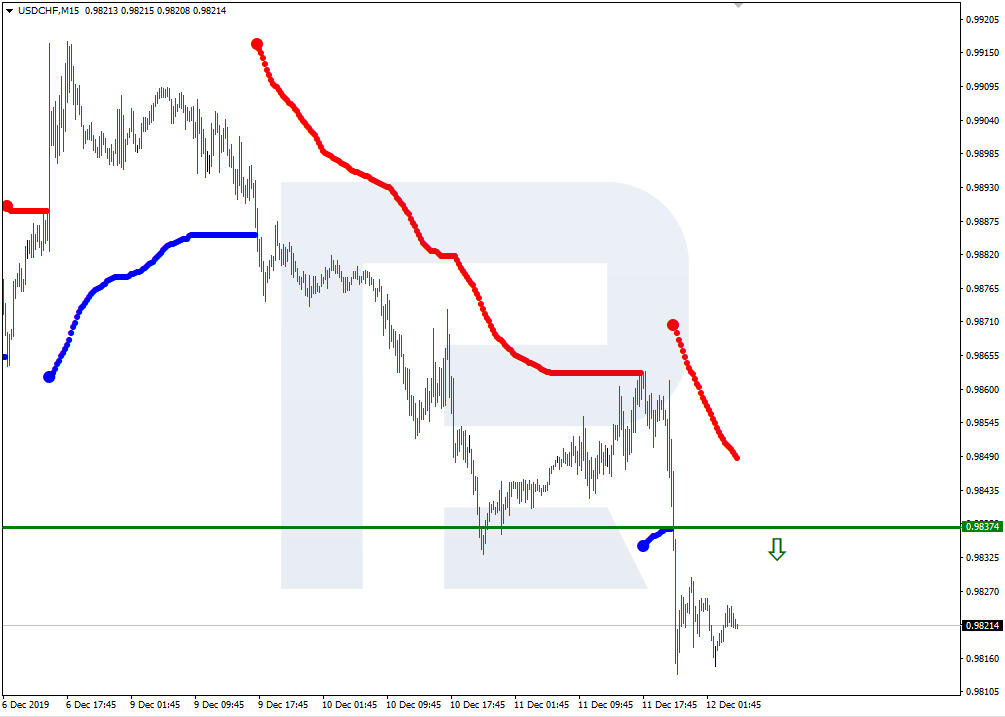
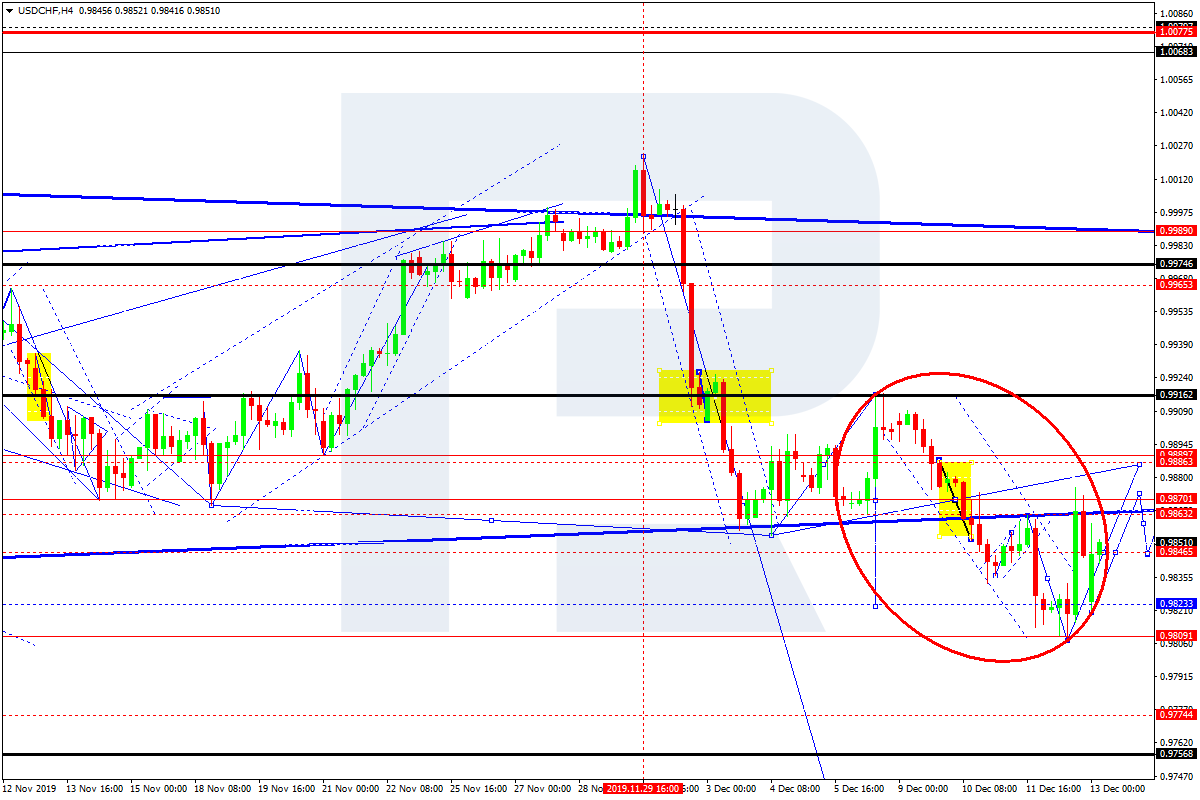
USDCHF, “US Dollar vs Swiss Franc”
After reaching the downside target at 0.9808, USDCHF has formed the ascending impulse towards 0.9870; right now, it is consolidating around 0.9845. Possibly, today the pair may expand this range both downwards and upwards, 0.9820 and 0.9880 respectively. If later the price breaks this range to the upside, the market may start another correction with the target at 0.9916; if to the downside – form a new descending structure to reach 0.9777.
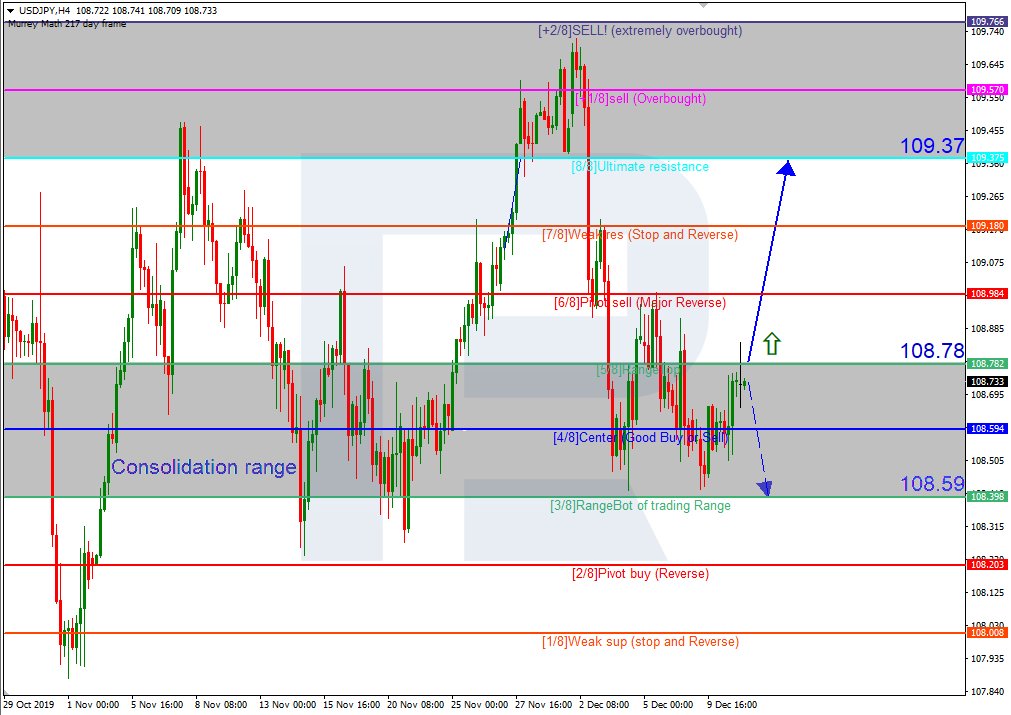
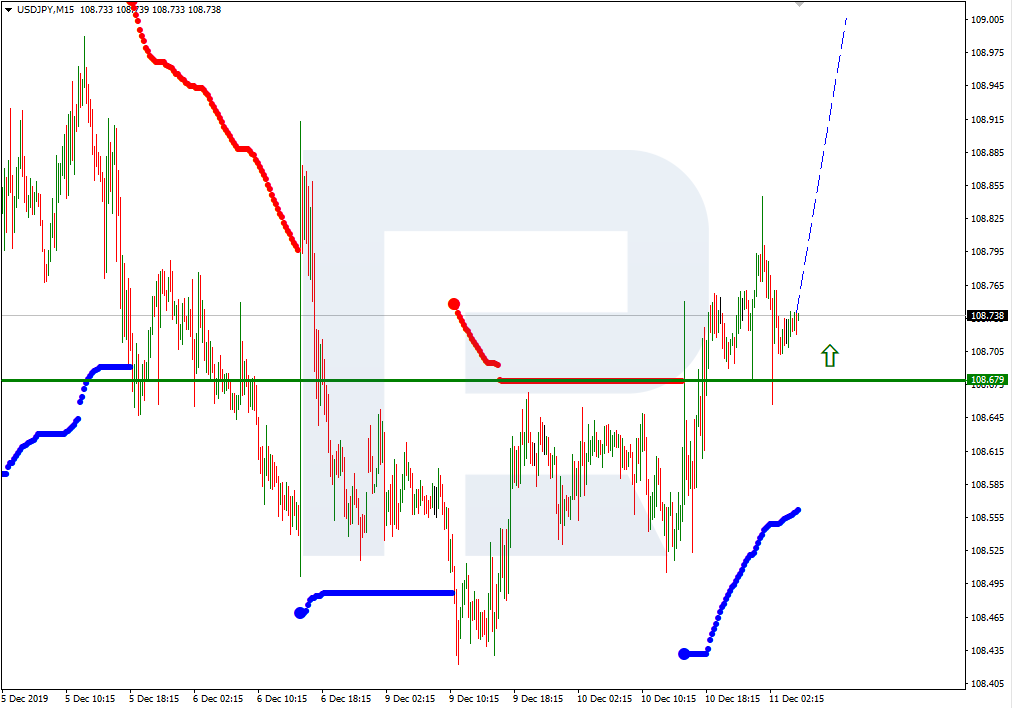
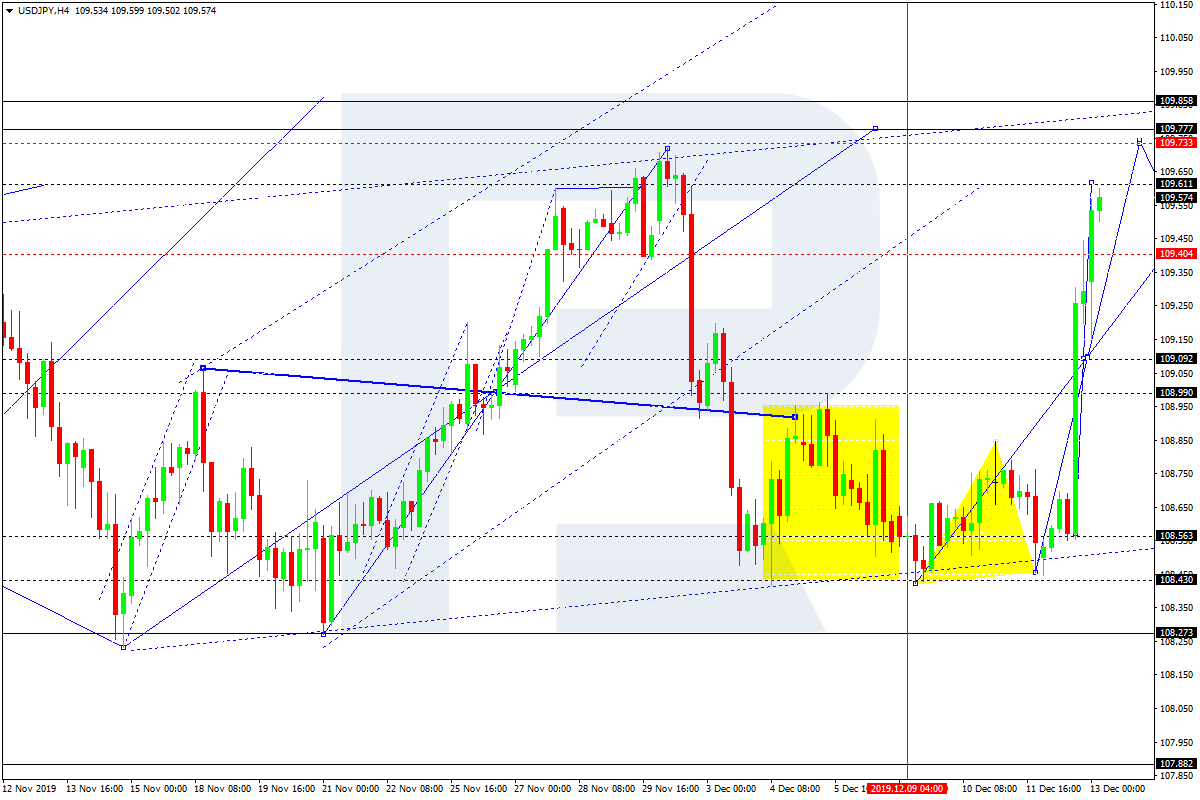
USDJPY, “US Dollar vs Japanese Yen”
USDJPY has broken 109.00; right now, it is still growing towards 109.77. Today, the pair may reach 109.70 and then start a new correction towards 109.40, at least. After that, the instrument may form one more ascending structure to reach to 109.77.
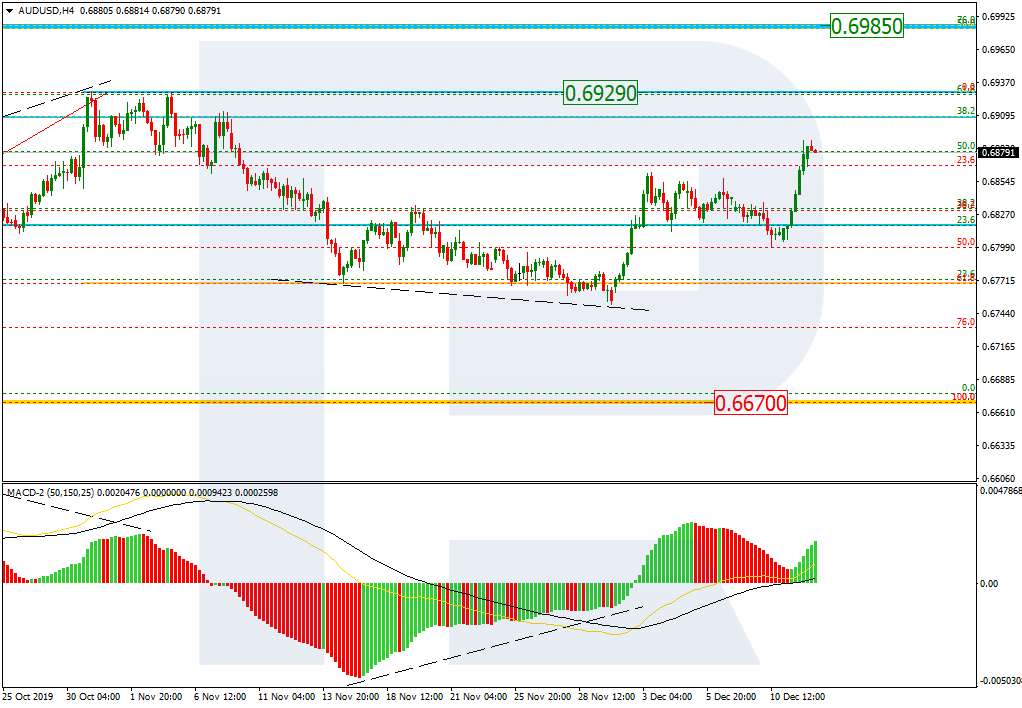
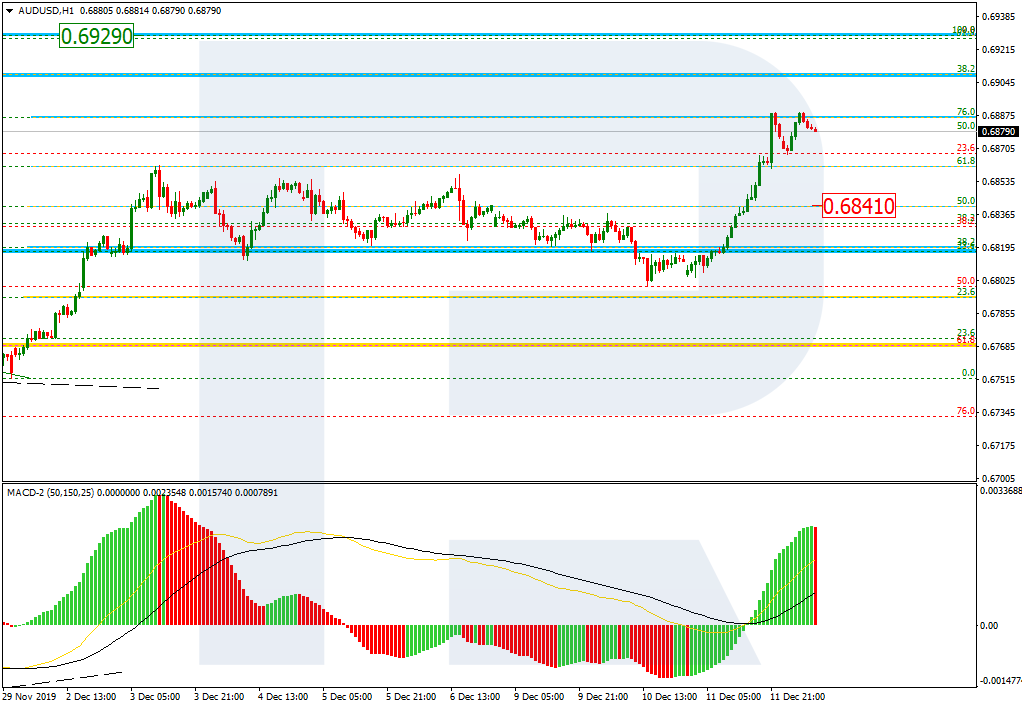
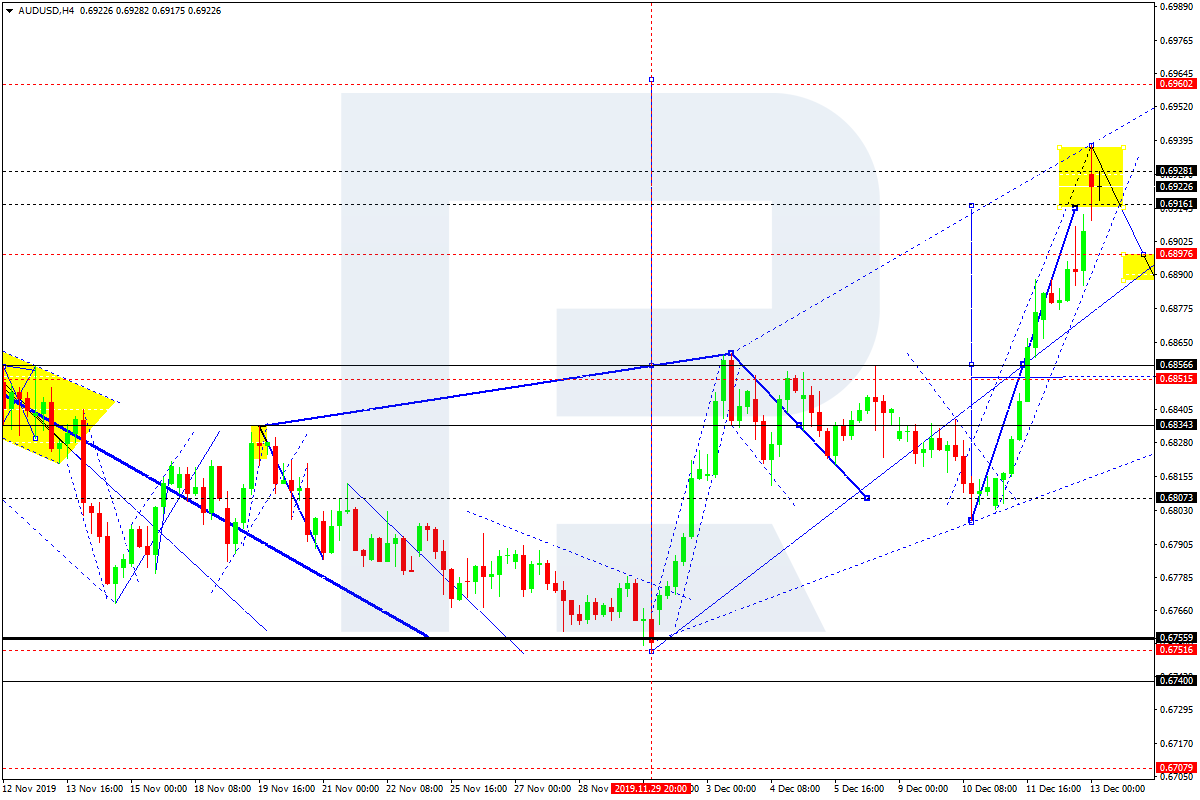
AUDUSD, “Australian Dollar vs US Dollar”
AUDUSD has reached the short-term upside target at 0.6916; right now, it is consolidating at the top. Possibly, the pair may fall to reach 0.6878 (at least) and then resume moving upwards with the key upside target at 0.6962.
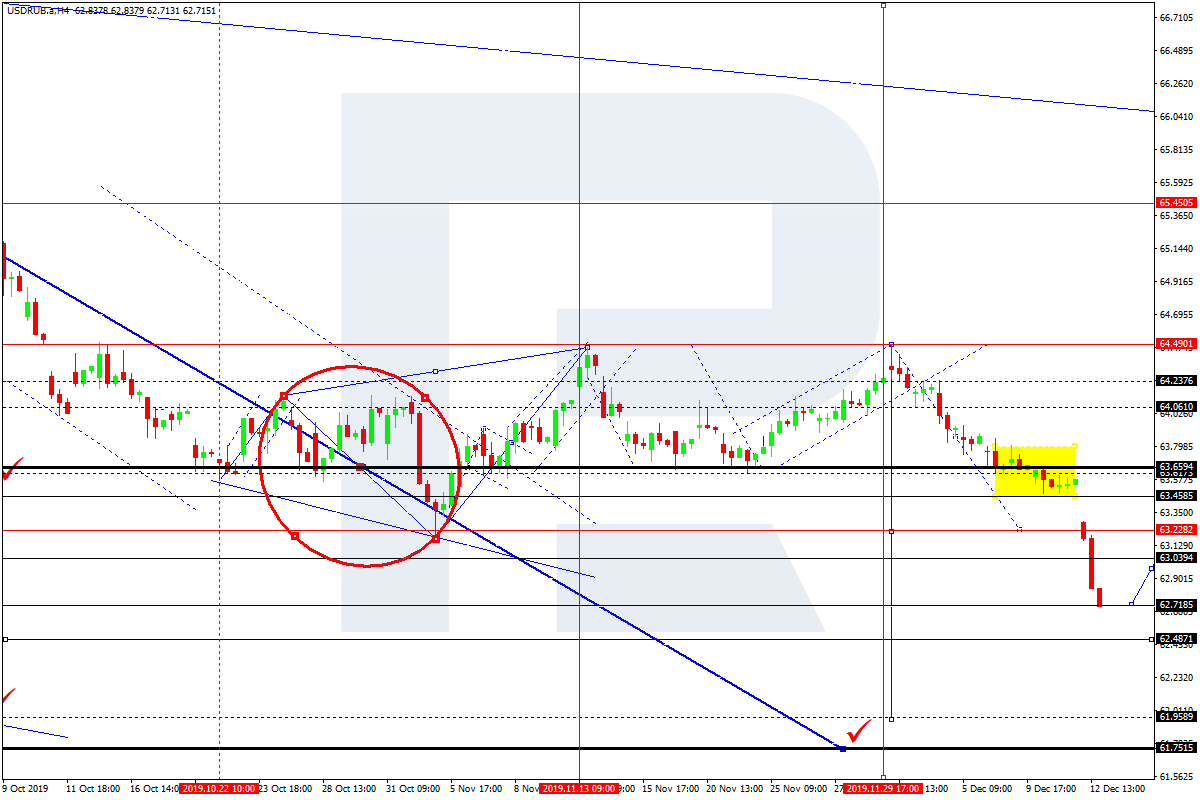
USDRUB, “US Dollar vs Russian Ruble”
USDRUB has reached the short-term downside target at 62.75. Possibly, today the pair may consolidate near the lows. If later the price breaks this range to the downside at 62.60, the market may continue trading inside the downtrend towards 62.22; if to the upside at 62.80 – start a new correction with the target at 63.25 and then resume trading inside the downtrend.
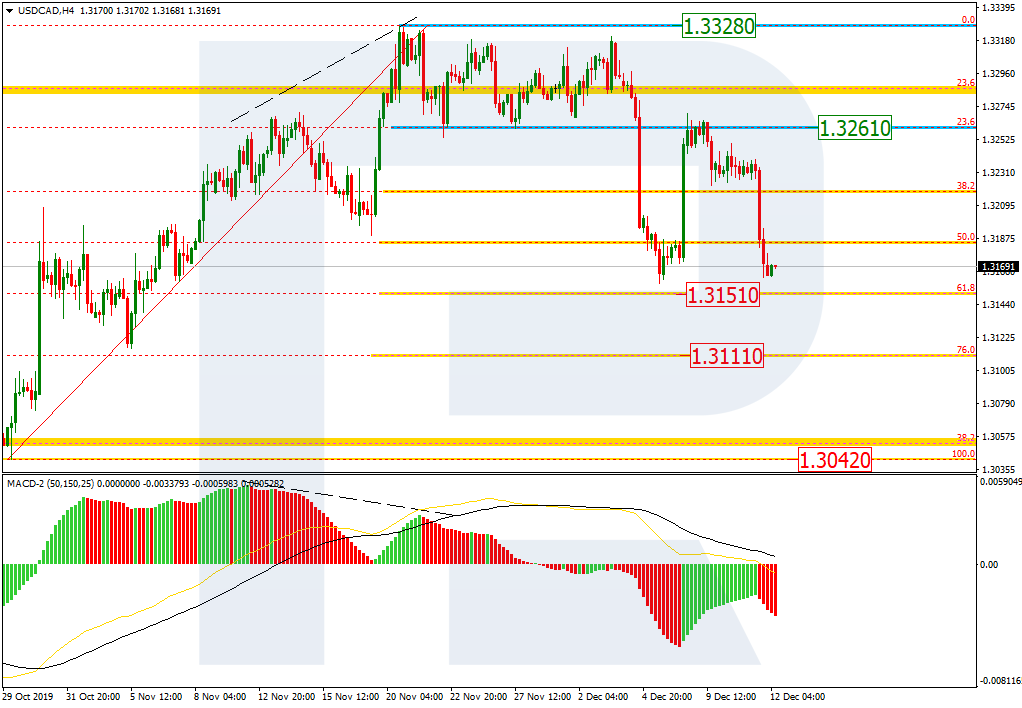
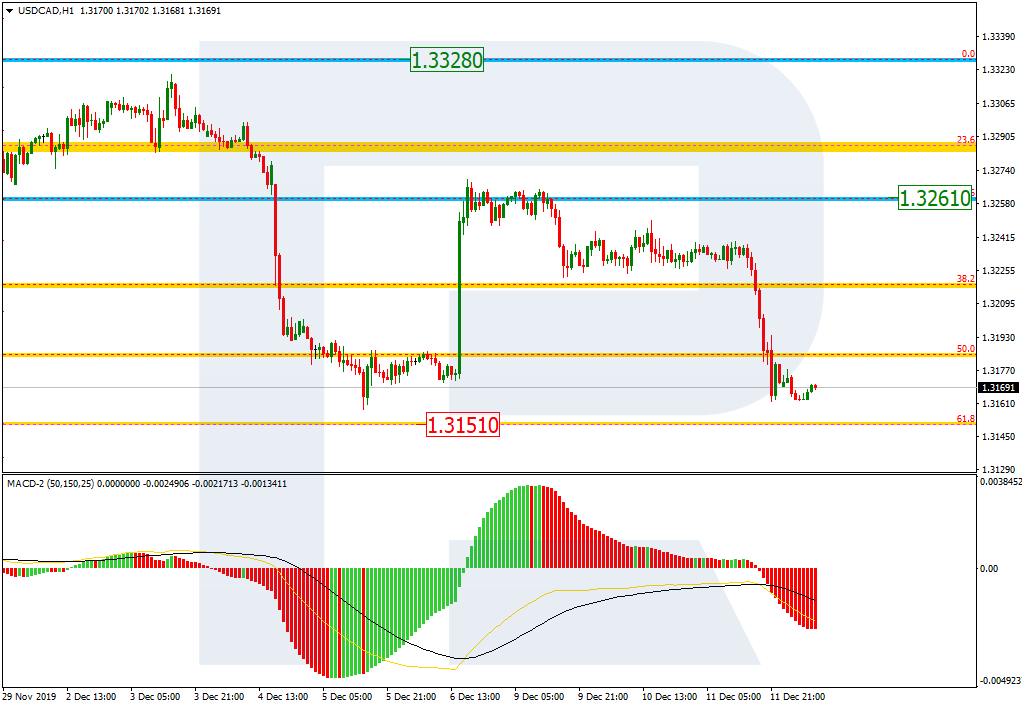
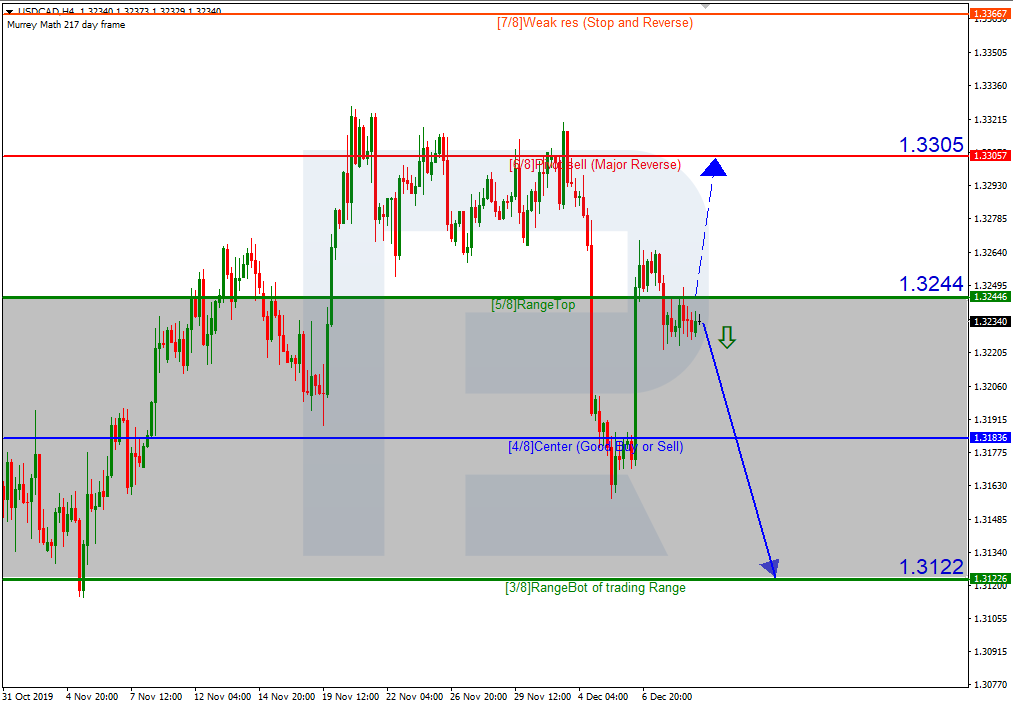
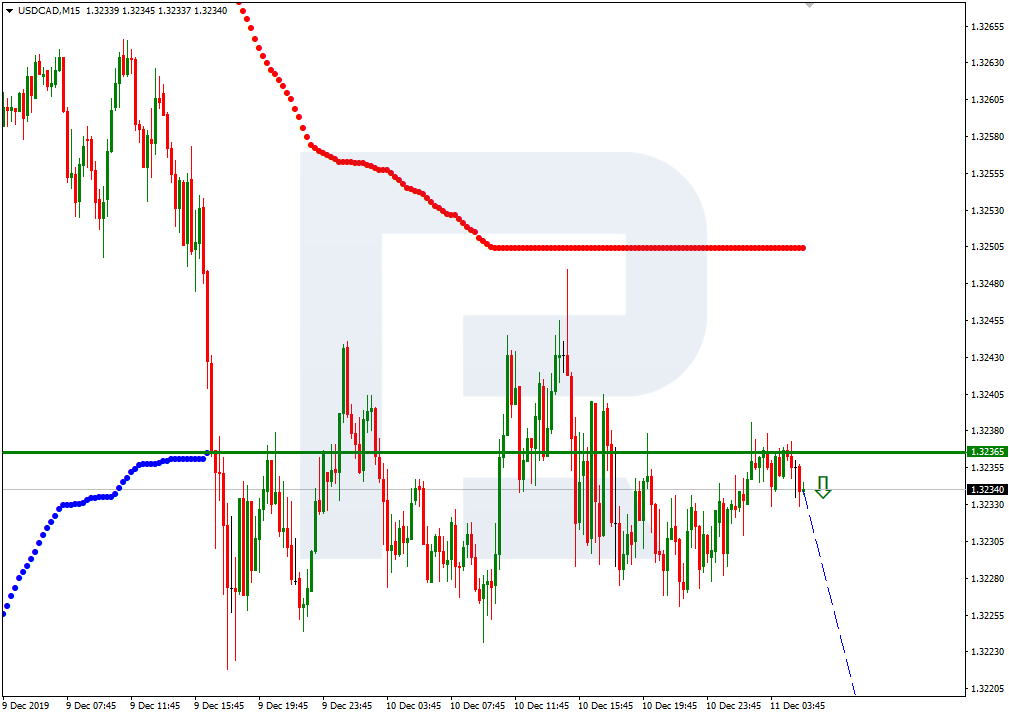
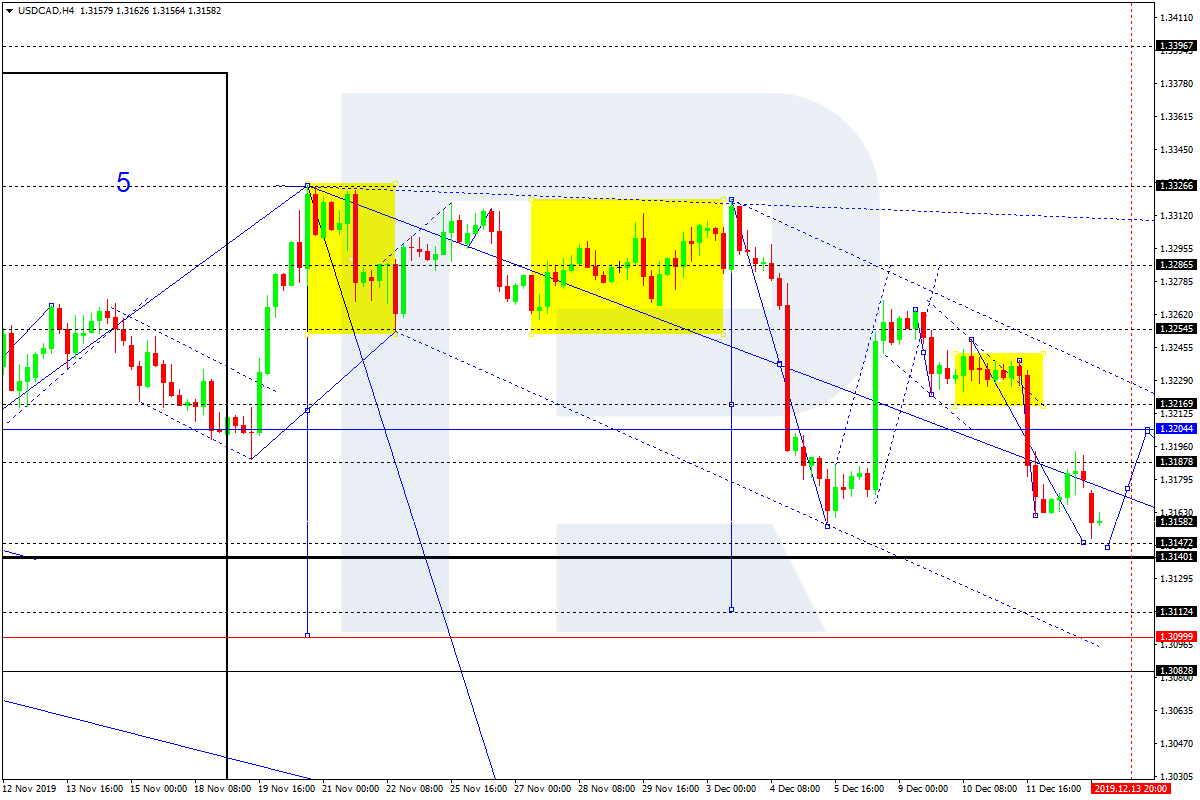
USDCAD, “US Dollar vs Canadian Dollar”
USDCAD is moving downwards with the target at 1.3140. Today, the pair may reach 1.3147 and then form one more ascending structure towards 1.3200. Later, the market may resume moving downwards to reach the above-mentioned target.
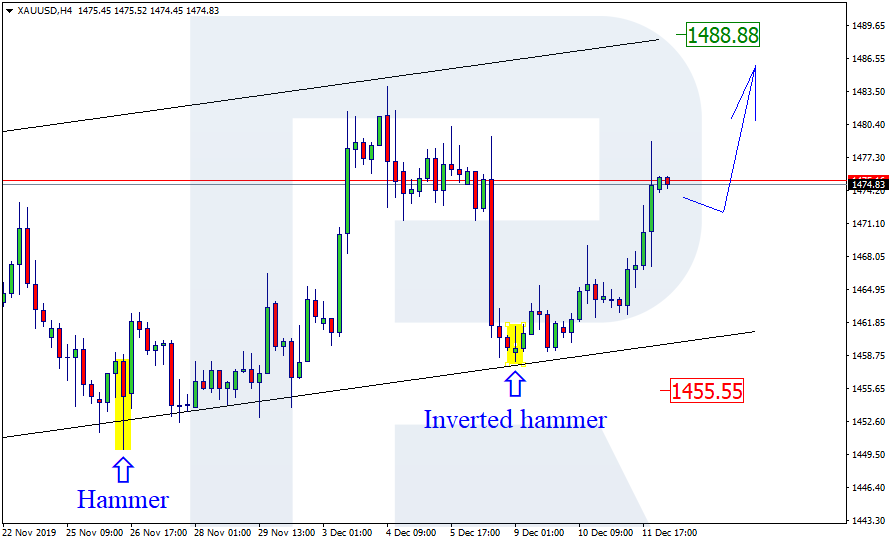
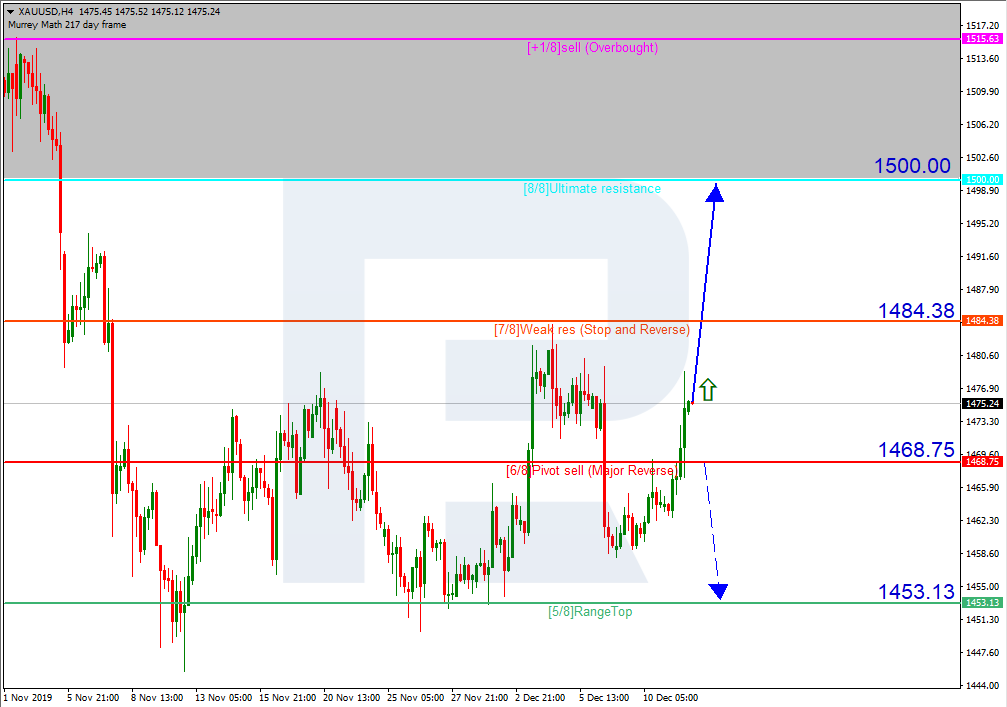
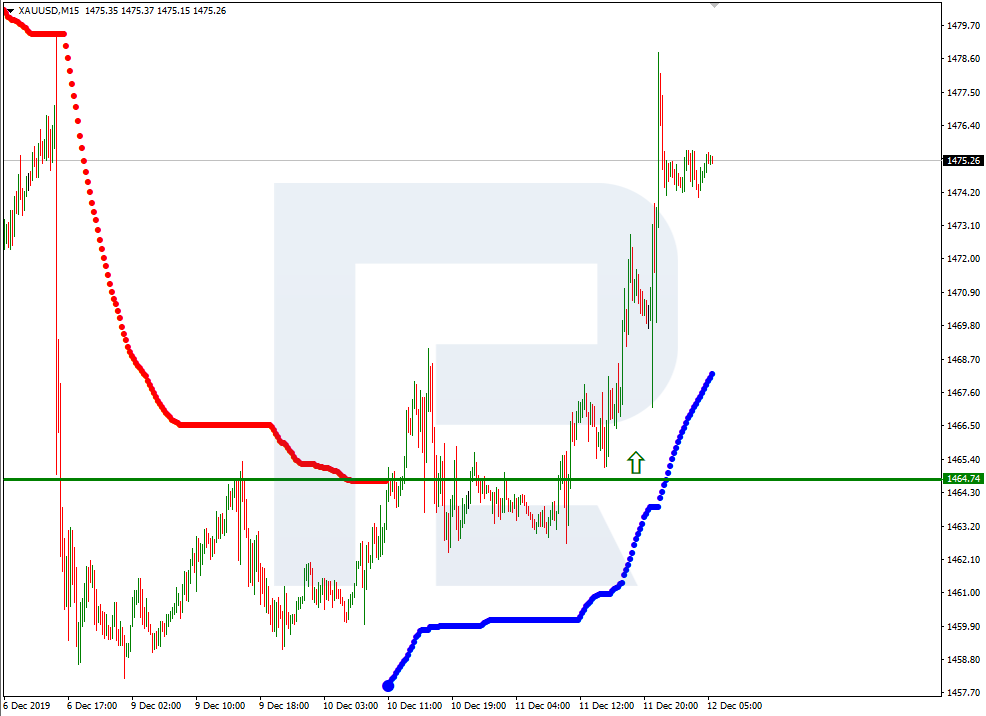
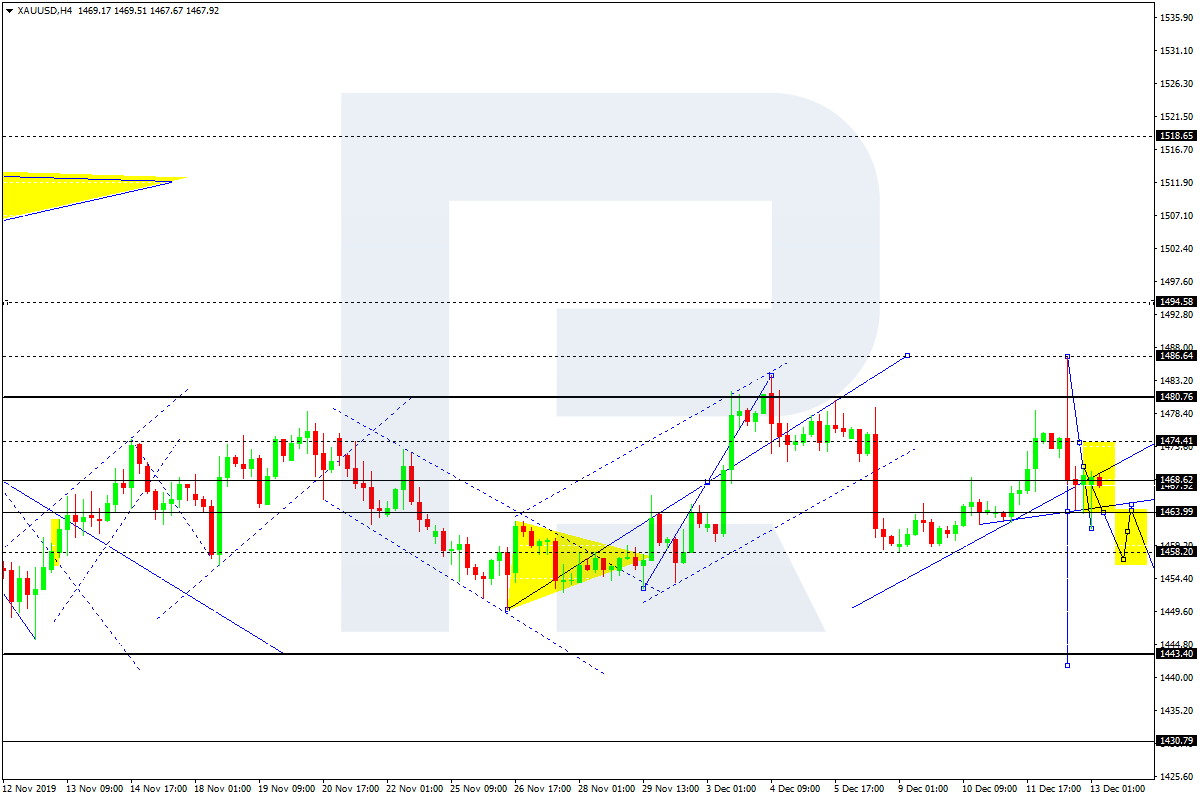
XAUUSD, “Gold vs US Dollar”
Gold has completed the ascending wave at 1486.60 along with the descending impulse at 1468.60; right now, it is consolidating around the latter level. The main scenario implies that the price may form a new descending structure towards 1458.20 and then resume moving upwards to return to 1468.60. Later, the market may start another decline with the target at 1444.00.
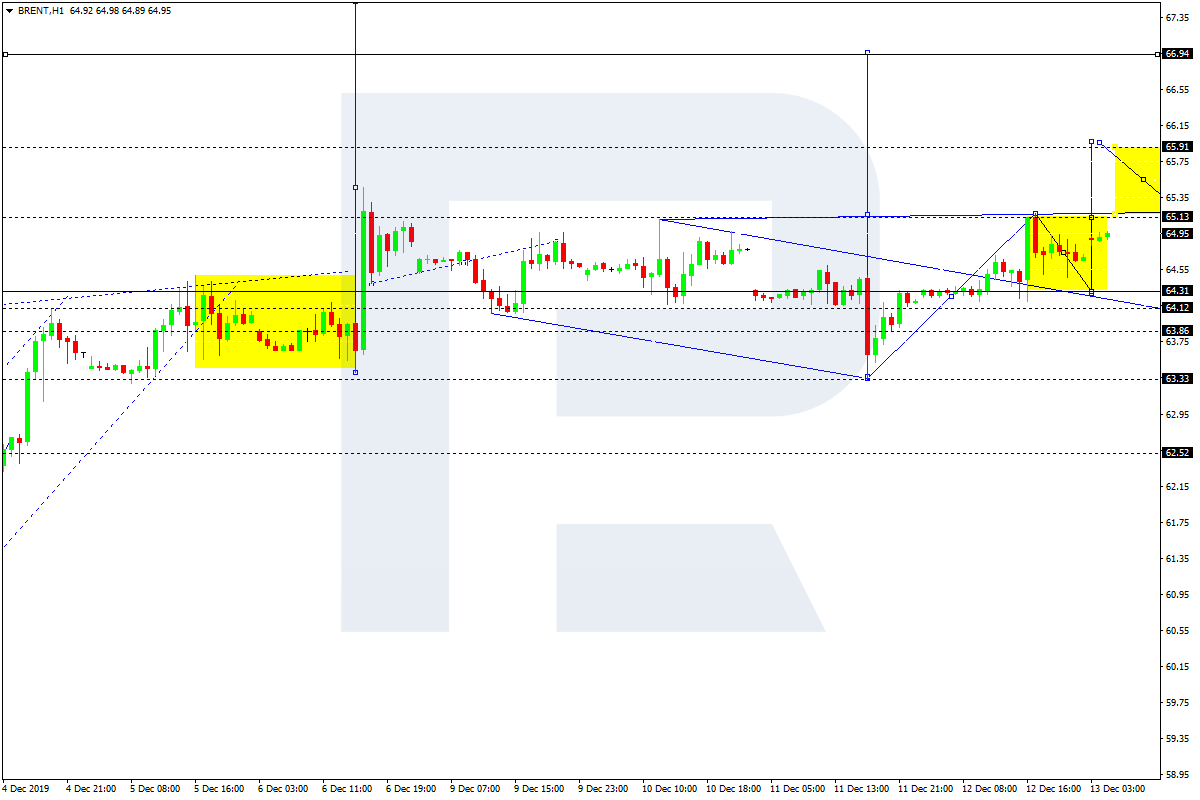
BRENT
Brent has finished the ascending impulse at 65.15; right now, it is correcting downwards to reach 64.30. After that, the market may start a new growth with the short-term target at 65.90.
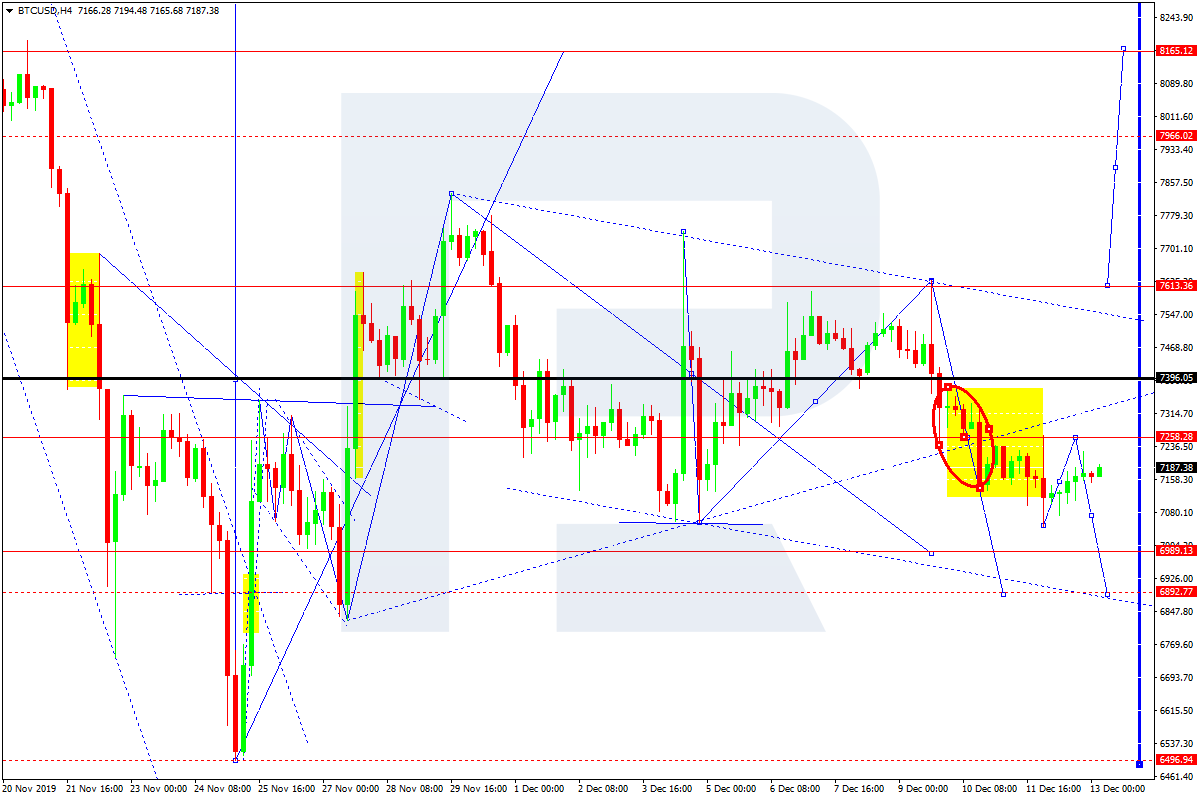
BTCUSD, “Bitcoin vs US Dollar”
BTCUSD is without any particular direction. According to the main scenario, the price is expected to fall towards 7000.00 and then resume moving upwards with the target at 7600.00.