Murrey Math Lines 24.04.2020 (EURUSD, GBPUSD)

Murrey Math Lines 24.04.2020 (EURUSD, GBPUSD)

24.04.2020

EURUSD, “Euro vs. US Dollar”

In the H4 chart, EURUSD is moving not far from the “oversold area”. In this case, the pair may test 0/8, rebound from it, and then resume growling towards the resistance at 1/8. However, this scenario may no longer be valid if the price breaks 0/8 to the downside. After that, the instrument may continue falling to reach the support at -1/8.

EURUSD_H4
Risk Warning: the result of previous trading operations do not guarantee the same results in the future

As we can see in the M15 chart, the pair is moving quite far away from the upside line of the VoltyChannel indicator, that’s why only a rebound from 0/8 from the H4 chart may confirm further growth.

EURUSD_M15
Risk Warning: the result of previous trading operations do not guarantee the same results in the future

GBPUSD, “Great Britain Pound vs US Dollar”

As we can see in the H4 chart, GBPUSD is trading not far from the downside border of the range at 3/8. The main scenario implies that the pair may test this level, rebound from it, and then resume falling towards the support at 2/8. However, this scenario may no longer be valid if the price breaks the resistance at 3/8 to the upside. After that, the instrument may continue growing to reach 4/8.

GBPUSD_H4
Risk Warning: the result of previous trading operations do not guarantee the same results in the future

In the M15 chart, the pair may break the downside line of the VoltyChannel indicator and, as a result, continue trading downwards.

GBPUSD_M15

Forex Technical Analysis & Forecast 24.04.2020

Forex Technical Analysis & Forecast 24.04.2020

24.04.2020

EURUSD, “Euro vs US Dollar”

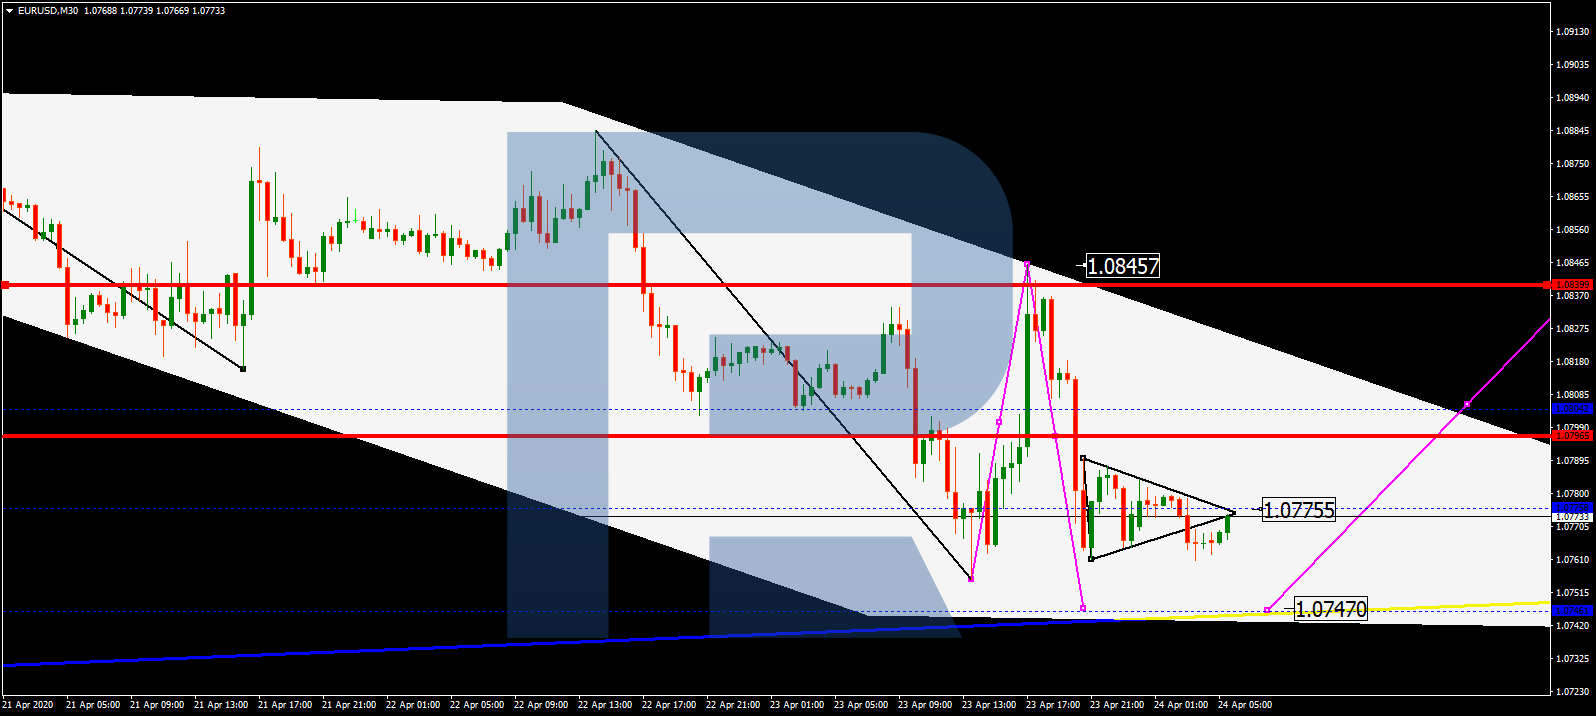
After finishing the correction at 1.0844 and then rebounding from this level, EURUSD continues forming the fifth descending wave with the target at 1.0747; it has already completed the descending impulse at 1.0775. Possibly, the pair may form a new consolidation range around this level, which may be considered as a downside continuation pattern. Later, the market may break 1.0760 downwards and continue falling to reach the above-mentioned target or even extend this wave down to 1.0700.
EURUSD
Risk Warning: the result of previous trading operations do not guarantee the same results in the future

GBPUSD, “Great Britain Pound vs US Dollar”

After completing the correction at 1.2420, GBPUSD is falling towards 1.2300. Possibly, today the pair may reach it and then start a new correction towards 1.2355. After that, the instrument may start another decline to break the short-term target at 1.2255 and then continue moving downwards to reach 1.2190.

GBPUSD
Risk Warning: the result of previous trading operations do not guarantee the same results in the future

USDRUB, “US Dollar vs Russian Ruble”

USDRUB is forming a new descending impulse towards 73.50 and may later grow to reach 75.50, thus forming a new consolidation range. If later the price breaks this range to the downside, the market may resume trading inside the downtrend to break 71.55 and then continue falling with the target at 69.55.

USDRUB
Risk Warning: the result of previous trading operations do not guarantee the same results in the future

USDJPY, “US Dollar vs Japanese Yen”

After finishing the ascending structure towards 107.97 along with the descending impulse at 107.50, USDJPY is consolidating around 107.60. Possibly, the pair may break the range to the downside to reach 107.17. After that, the instrument may resume growing with the target at 108.55.

USDJPY
Risk Warning: the result of previous trading operations do not guarantee the same results in the future

USDCHF, “US Dollar vs Swiss Franc”

After rebounding from 0.9710, USDCHF continues growing with the target at 0.9785. Later, the market may correct towards 0.9750 and then form one more ascending structure to reach 0.9800.

USDCHF
Risk Warning: the result of previous trading operations do not guarantee the same results in the future

AUDUSD, “Australian Dollar vs US Dollar”

After finishing the correction at 0.6400, AUDUSD is falling towards 0.6288. After that, the instrument may correct to reach 0.6340 and then resume trading inside the downtrend with the short-term target at 0.6233.

AUDUSD
Risk Warning: the result of previous trading operations do not guarantee the same results in the future

BRENT

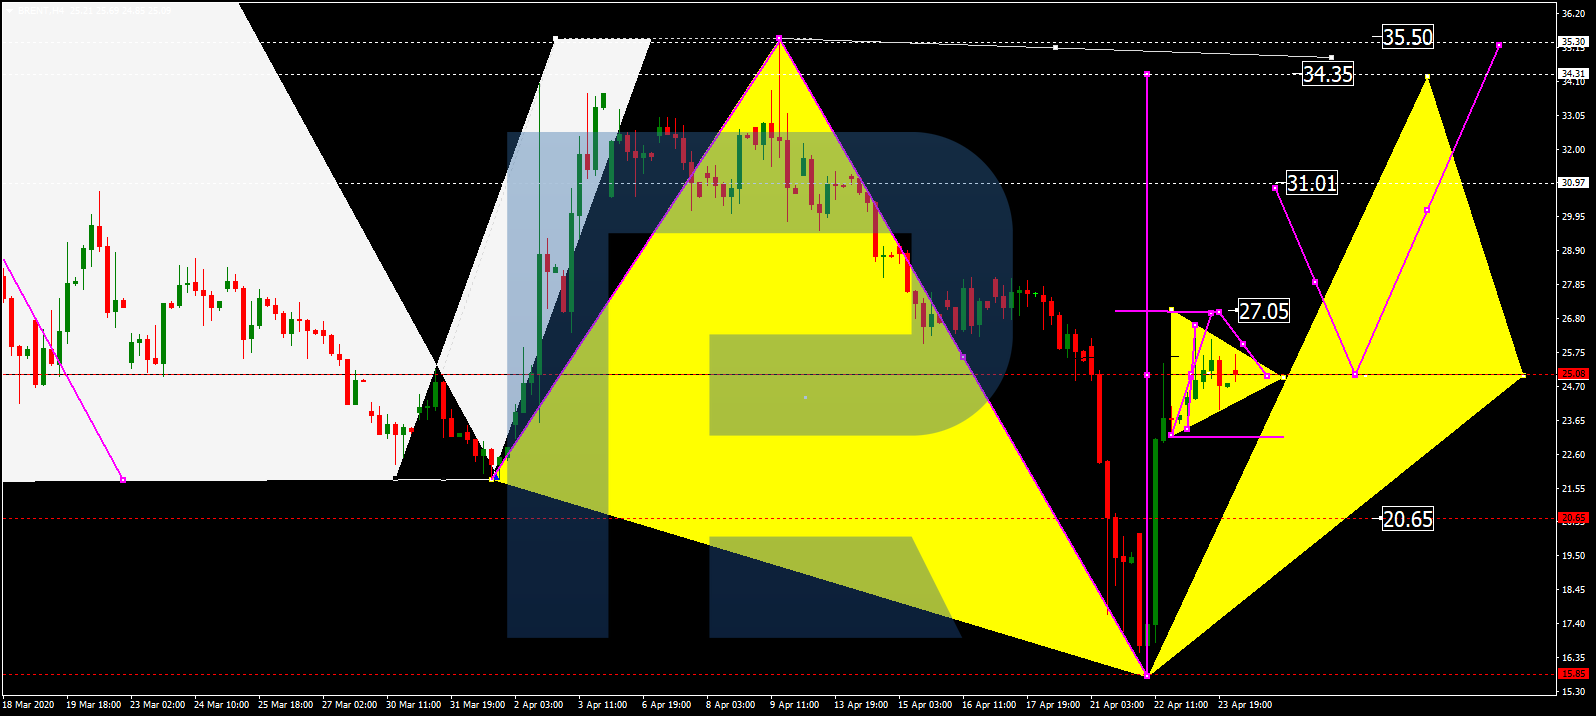
Brent is consolidating around 25.00. Today, the pair may form one more ascending impulse towards 27.05 and then fall to return to 25.00 or even start a new correction with the target at 21.00. However, if the price grows and breaks 27.05, the market may resume trading upwards with the first target at 34.34.
BRENT
Risk Warning: the result of previous trading operations do not guarantee the same results in the future

XAUUSD, “Gold vs US Dollar”

Gold is still consolidating around 1729.50. Today, the pair may break the range to the downside and fall with the first target at 1702.70. After that, the instrument may start another growth to reach 1720.40.

GOLD
Risk Warning: the result of previous trading operations do not guarantee the same results in the future

BTCUSD, “Bitcoin vs US Dollar”

After reaching the target at 7550.00, BTCUSD is consolidating at this level. According to the main scenario, the price may start a new correction to reach 6700.00 and then form one more ascending structure towards 8500.00.

BITCOIN
Risk Warning: the result of previous trading operations do not guarantee the same results in the future

S&P 500

After finishing the ascending impulse at 2845.0, S&P 500 has completed the correction towards 2772.3. Possibly, today the price may resume growing towards 2927.5 and then start another correction with the target at 2660.5.
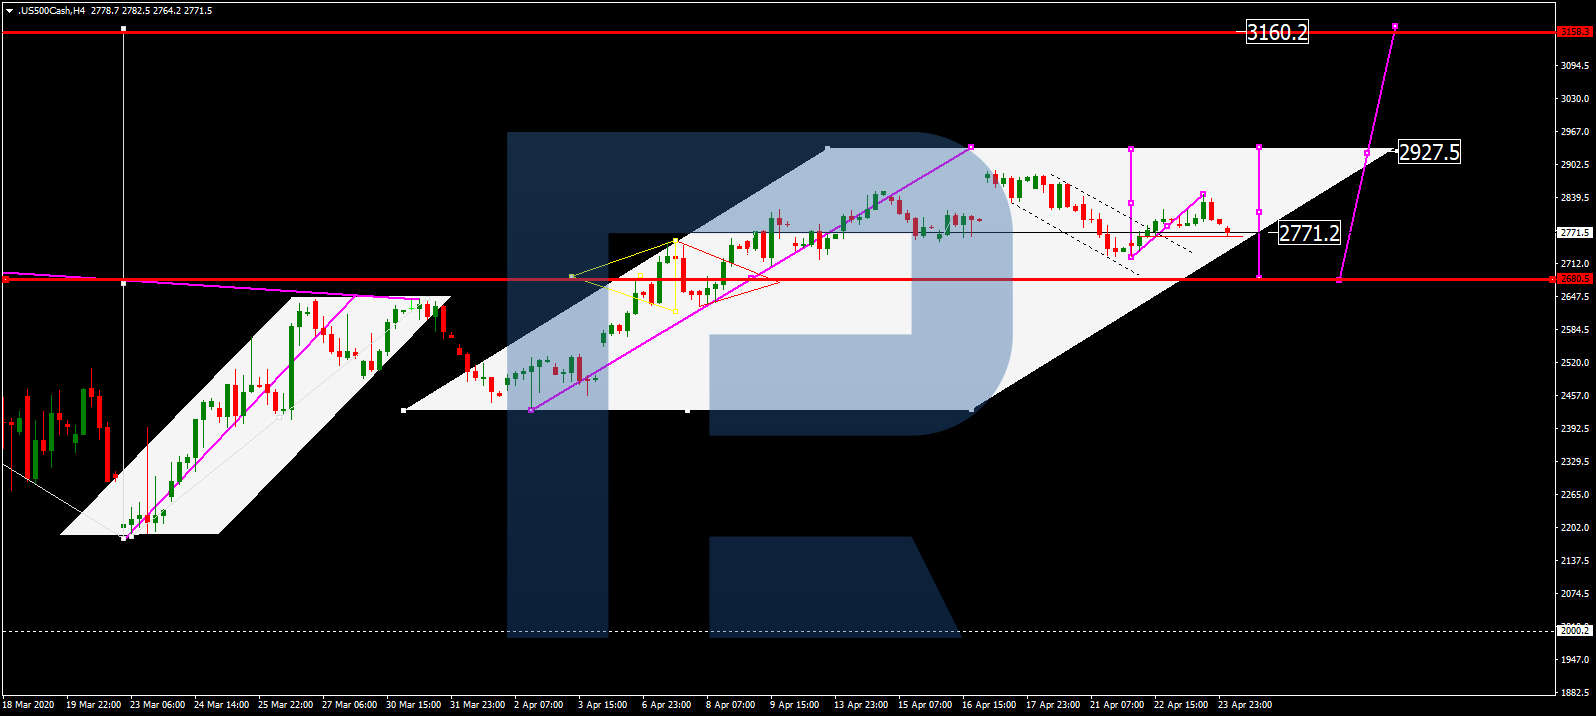
S&P500
Risk Warning: the result of previous trading operations do not guarantee the same results in the future

Ichimoku Cloud Analysis 24.04.2020 (XAUUSD, EURUSD, BTCUSD)

Ichimoku Cloud Analysis 24.04.2020 (XAUUSD, EURUSD, BTCUSD)

24.04.2020

XAUUSD, “Gold vs US Dollar”

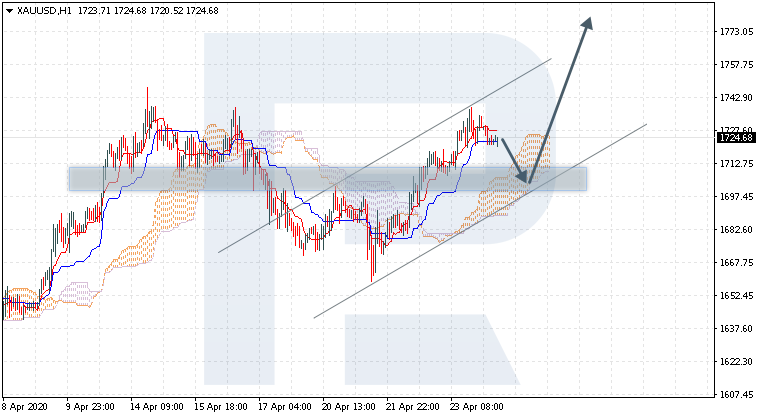
XAUUSD is trading at 1724.00; the instrument is moving above Ichimoku Cloud, thus indicating a bullish tendency. The markets could indicate that the price may test the cloud’s downside border at 1710.00 and then resume moving upwards to reach 1775.00. Another signal to confirm further ascending movement is the price’s rebounding from the rising channel’s downside border. However, the scenario that implies further growth may be canceled if the price breaks the cloud’s downside border and fixes below 1685.00. In this case, the pair may continue falling towards 1625.00.

XAUUSD
Risk Warning: the result of previous trading operations do not guarantee the same results in the future

EURUSD, “Euro vs US Dollar”

EURUSD is trading at 1.0762; the instrument is moving below Ichimoku Cloud, thus indicating a bearish tendency. The markets could indicate that the price may test the cloud’s downside border at 1.0785 and then resume moving downwards to reach 1.0675. Another signal to confirm further descending movement is the price’s rebounding from the descending channel’s upside border. However, the scenario that implies further decline may be canceled if the price breaks the cloud’s upside border and fixes above 1.0845. In this case, the pair may continue growing towards 1.0925.

EURUSD
Risk Warning: the result of previous trading operations do not guarantee the same results in the future

BTCUSD, “Bitcoin vs US Dollar”

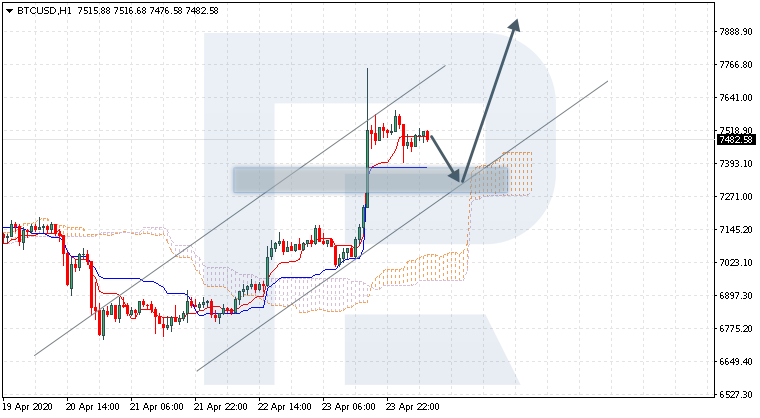
BTCUSD is trading at 7482.00; the instrument is moving above Ichimoku Cloud, thus indicating a bullish tendency. The markets could indicate that the price may test the cloud’s upside border at 7325.00 and then resume moving upwards to reach 7925.00. Another signal to confirm further ascending movement is the price’s rebounding from the rising channel’s downside border. However, the scenario that implies further growth may be canceled if the price breaks the cloud’s downside border and fixes below 7005.00. In this case, the pair may continue falling towards 6405.00.

BTCUSD

rfxsignals April 23, 2020 No Comments

Daily Free Forex Signals For 23/04/2020

Daily Free Forex Signals For 23/04/2020

Here your going to see Daily Free Forex Signals For 23/04/2020 to free forex signal alert from our kitkat trading system and other trading logic’s .we provide like this free forex signals from 2012 on wards with more than 50,000 traders around the world .The free forex signals have 70 to 85% quality always .we give for you a note as maximum focus take profit 1 as your target and must use stop loss values .if you have any other query’s please visit our live chat or email option

USDCHF SELL-0.97344
SL-0.98714
TP1-0.96748
TP2-0.96040

AUDNZD SELL-1.05922
SL-1.06879
TP1-1.05162
TP2-1.04579

USDCAD SELL-1.41297
SL-1.42835
TP1-1.40502
TP2-1.39635

CADCHF BUY-0.68980
SL-0.67833
TP1-0.69337
TP2-0.69672

NZDCHF BUY-0.58483
SL-0.57090
TP-0.59147.

USDJPY SELL-107.397
SL-107.899
TP1-107.168
TP2-106.965

AUDNZD SELL-1.05992
SL-1.06475
TP1-1.05823
TP2-1.05640

GBPNZD SELL-2.05851
SL-2.06881
TP1-2.05467
TP2-2.05055

GBPJPY SELL-132.617
SL-133.368
TP1-132.371
TP2-132.150

CADJPY SELL-75.926
SL-76.399
TP1-75.747
TP2-75.600

EURUSD SELL-1.07614
SL-1.09163
TP1-1.06904
TP2-1.06147

AUDUSD BUY -0.63568
SL-0.62758
TP1-0.63850
TP2-0.64115

NZDUSD BUY-0.59914
SL-0.59032
TP1-0.60161
TP2-0.60372

AUDCHF BUY 0.61550
SL:0.57794
TP1:0.61741
TP2:0.61977

EURCAD SELL 1.52955
SL:1.54532
TP1:1.52675
TP2:1.52293

EURAUD SELL 1.70588
SL:1.73553
TP1:1.70236
TP2:1.69909

NZDCHF BUY: 0.58135
SL: 0.55196
TP1: 0.59215
TP2: 0.60338

EURNZD SELL: 1.80876
SL: 1.84531
TP1: 1.80522
TP2: 1.80183

EURAUD SELL: 1.70270
SL: 1.72359
TP1: 1.70031
TP2: 1.69805

USDCAD SELL: 1.41282
SL: 1.42132
TP1: 1.41073
TP2: 1.40860

GBPUSD BUY: 1.23546
SL: 1.20212
TP1: 1.24232
TP2: 1.24900

EURCHF SELL 1.05063
SL:1.05503
TP1:1.04945
TP2:1.04834

EURGBP SELL 0.87281
SL:0.88848
TP1:0.86967
TP2:0.86631

CADCHF BUY 0.69092
SL:0.65666
TP1:0.69694
TP2:0.70234

Murrey Math Lines 23.04.2020 (USDCHF, GOLD)

Murrey Math Lines 23.04.2020 (USDCHF, GOLD)

23.04.2020

USDCHF, “US Dollar vs Swiss Franc”

As we can see in the H4 chart, XAUUSD is moving not far from the strong resistance at 8/8. In this case, the price is expected to test this level, rebound from it, and then resume falling towards the support at 6/8. However, this scenario may no longer be valid if the price breaks 8/8 to the upside. After that, the instrument may continue growing to reach the resistance at +1/8.

USDCHF_H4
Risk Warning: the result of previous trading operations do not guarantee the same results in the future

In the M15 chart, the pair may break the downside line of the VoltyChannel indicator and, as a result, continue the descending tendency.

USDCHF_M15
Risk Warning: the result of previous trading operations do not guarantee the same results in the future

XAUUSD, “Gold vs US Dollar”

In the H4 chart, XAUUSD is moving close to 7/8. In this case, the price is expected to break this level and then continue growing to reach the resistance at 8/8. However, this scenario may no longer be valid if the price breaks the support at 6/8 to the downside. After that, the instrument may fall to return to 5/8.

XAUUSD_H4
Risk Warning: the result of previous trading operations do not guarantee the same results in the future

As we can see in the M15 chart, the pair has broken the upside line of the VoltyChannel indicator and, as a result, may continue trading upwards to reach 8/8 from the H4 chart.

XAUUSD_M15
Risk Warning: the result of previous trading operations do not guarantee the same results in the future

Japanese Candlesticks Analysis 23.04.2020 (USDCAD, AUDUSD, USDCHF)

Japanese Candlesticks Analysis 23.04.2020 (USDCAD, AUDUSD, USDCHF)

23.04.2020

USDCAD, “US Dollar vs Canadian Dollar”

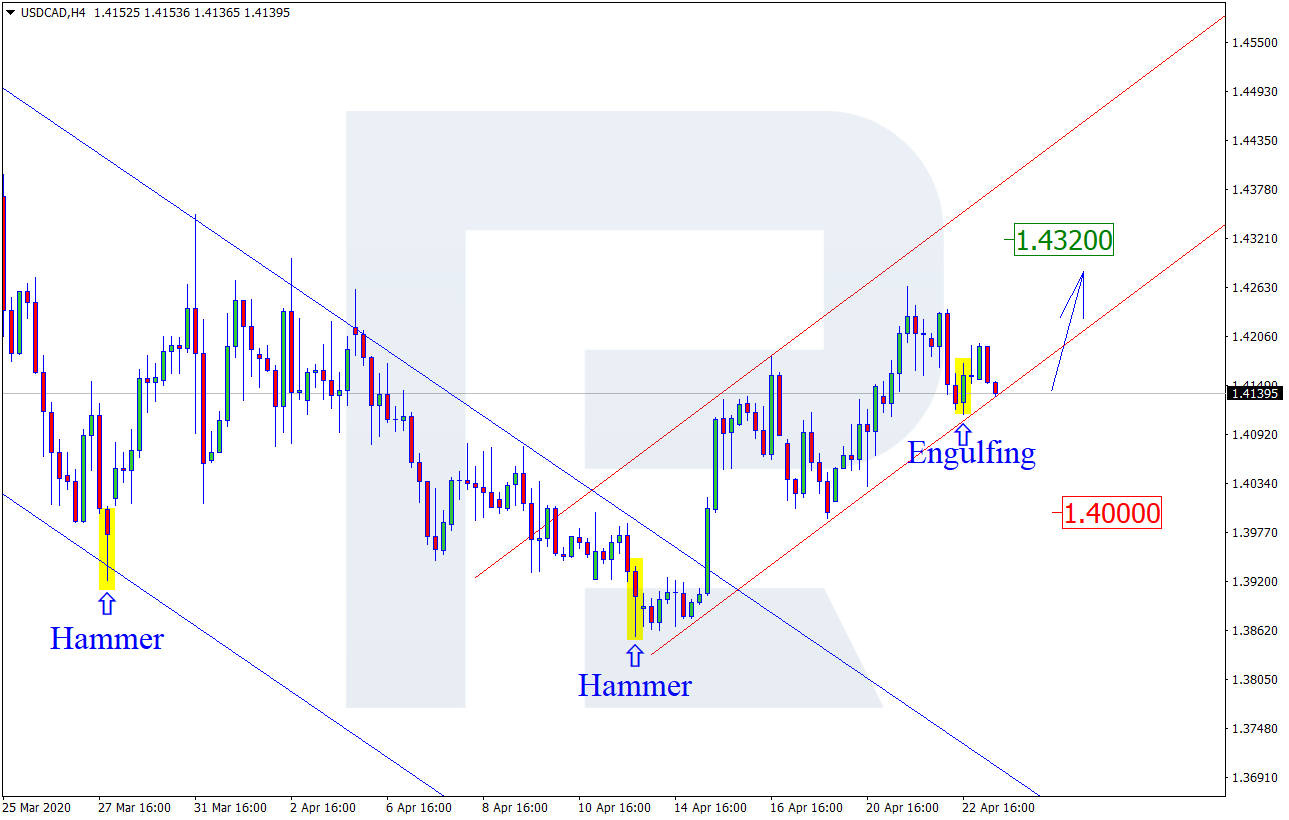
As we can see in the H4 chart, the pair is forming an ascending tendency. At the moment, after completing an Engulfing pattern and then attempting to reverse, AUDUSD is correcting. The upside target may be at 1.4320. At the same time, there might be another scenario, which implies that the instrument may fall towards the support level at 1.4000.

USDCAD
Risk Warning: the result of previous trading operations do not guarantee the same results in the future

AUDUSD, “Australian Dollar vs US Dollar”

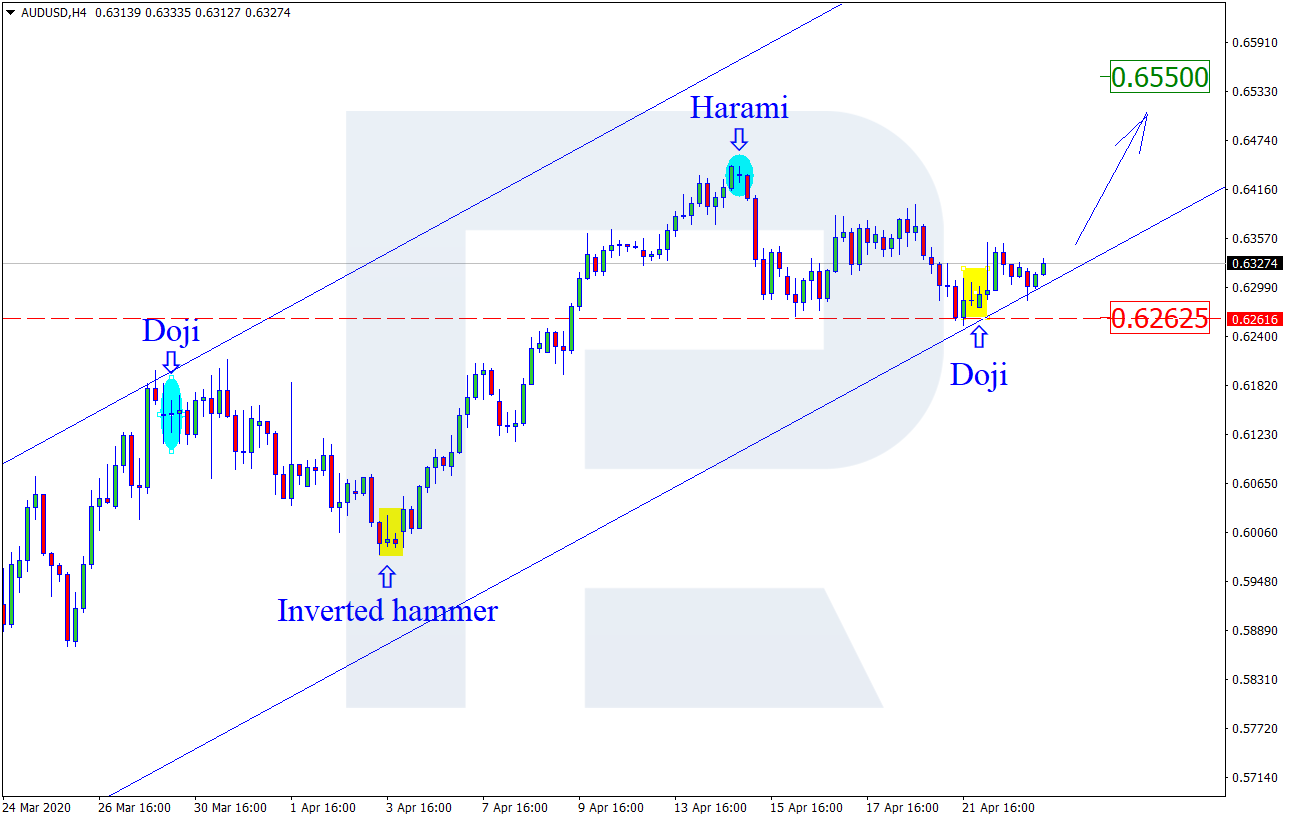
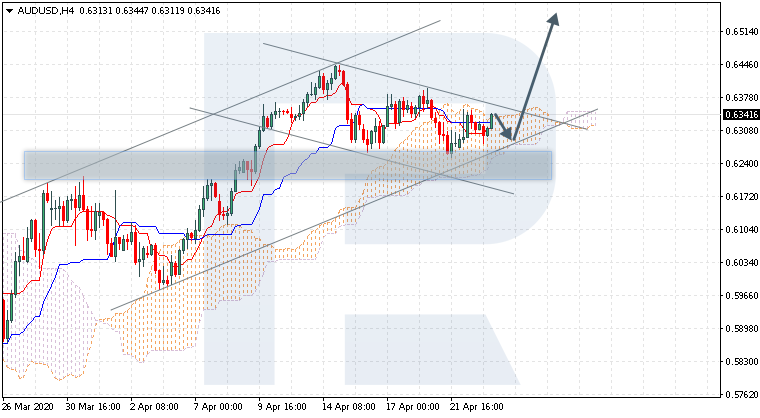
As we can see in the H4 chart, the pair is still correcting within the ascending tendency. After completing a Doji pattern not far from the support level, the price is expected to reverse and then resume growing. the upside target remains at 0.6550. Still, the instrument may choose an opposite scenario and continue trading sideways to test the support level at 0.6262.

AUDUSD
Risk Warning: the result of previous trading operations do not guarantee the same results in the future

USDCHF, “US Dollar vs Swiss Franc”

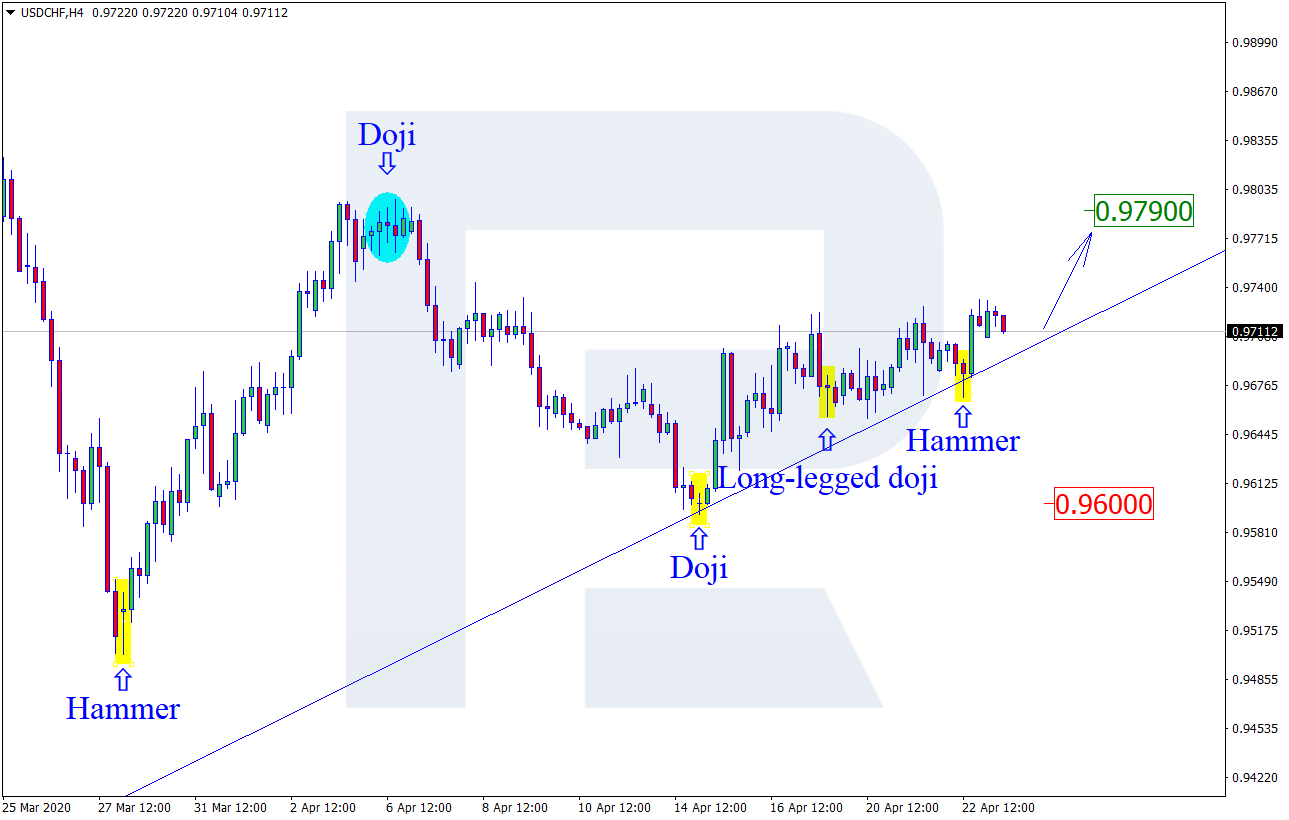
As we can see in the H4 chart, the pair continues the ascending tendency. By now, USDCHF has formed several reversal patterns, such as Hammer, near the channel’s downside border. The current situation suggests that after reversing the pair may continue the ascending tendency. In this case, the upside target may be at 0.9790. However, one shouldn’t ignore another scenario, according to which the instrument may fall and return to 0.9600.

USDCHF
Risk Warning: the result of previous trading operations do not guarantee the same results in the future

Forex Technical Analysis & Forecast 23.04.2020

Forex Technical Analysis & Forecast 23.04.2020

23.04.2020

EURUSD, “Euro vs US Dollar”

After breaking 1.0844 and then reaching 1.0803, EURUSD is consolidating above this level. Possibly, the pair may expand this range down to 1.0795 and then form one more ascending structure to break 1.0825. Later, the market may start a new correction to return to 1.0844 and then resume trading inside the downtrend with the target at 1.0750.

EURUSD
Risk Warning: the result of previous trading operations do not guarantee the same results in the future

GBPUSD, “Great Britain Pound vs US Dollar”

GBPUSD is still consolidating around 1.2323. Possibly, the pair may expand the range up to 1.2420 and then resume moving downwards with the first target at 1.2190.

GBPUSD
Risk Warning: the result of previous trading operations do not guarantee the same results in the future

USDRUB, “US Dollar vs Russian Ruble”

USDRUB is forming a new descending impulse towards 75.25 and may later grow to reach 76.40, thus forming a new consolidation range. If later the price breaks this range to the downside, the market may resume trading inside the downtrend with the target at 69.52; if to the upside – choose an alternative scenario to extend the wave up to 78.05 and then start a decline to reach the above-mentioned target.

USDRUB
Risk Warning: the result of previous trading operations do not guarantee the same results in the future

USDJPY, “US Dollar vs Japanese Yen”

After finishing the ascending structure towards 107.90 along with the correction at 107.66, USDJPY is expected to start another growth to reach 108.07. After that, the instrument may resume falling with the target at 107.50.

USDJPY
Risk Warning: the result of previous trading operations do not guarantee the same results in the future

USDCHF, “US Dollar vs Swiss Franc”

After breaking 0.9706 to the upside, USDCHF is expected to continue growing with the short-term target at 0.9745. Later, the market may correct towards 0.9660 and then form one more ascending structure to reach 0.9800.

USDCHF
Risk Warning: the result of previous trading operations do not guarantee the same results in the future

AUDUSD, “Australian Dollar vs US Dollar”

AUDUSD is still consolidating around 0.6280. Possibly, the pair may form one more ascending structure to reach 0.6363 and then resume trading inside the downtrend with the short-term target at 0.6214.

AUDUSD
Risk Warning: the result of previous trading operations do not guarantee the same results in the future

BRENT

Brent has completed the ascending impulse towards 25.40; right now, it is consolidating below this level. The mains scenario implies that the price may correct to reach 20.70 and then grow to break 25.40. Later, the market may resume growing towards 31.00 and then start a new correction to return to 25.40.

BRENT
Risk Warning: the result of previous trading operations do not guarantee the same results in the future

XAUUSD, “Gold vs US Dollar”

Gold has completed the ascending wave at 1718.10, which may be considered as the third ascending structure. Today, the pair may correct towards 1693.15 and then start another growth to reach 1727.47.

GOLD
Risk Warning: the result of previous trading operations do not guarantee the same results in the future

BTCUSD, “Bitcoin vs US Dollar”

After finishing the ascending structure towards 7140.00, BTCUSD is expected to consolidate around this level. According to the main scenario, the price may break the range to the upside and then continue trading upwards with the short-term target at 7520.00. Later, the market may start a new correction to reach 6800.00 and then form one more ascending structure towards 7700.00.

BITCOIN
Risk Warning: the result of previous trading operations do not guarantee the same results in the future

S&P 500

S&P 500 has finished the ascending impulse at 2816.0. Possibly, today the price may form a new consolidation range around this level. Later, the market may break it to the upside and continue growing towards 2927.6. After that, the instrument may start another correction to reach 2675.0 and then resume trading inside the uptrend with the target at 3160.2

S&P500
Risk Warning: the result of previous trading operations do not guarantee the same results in the future

Ichimoku Cloud Analysis 23.04.2020 (XAUUSD, AUDUSD, USDCAD)

Ichimoku Cloud Analysis 23.04.2020 (XAUUSD, AUDUSD, USDCAD)

23.04.2020

XAUUSD, “Gold vs US Dollar”

XAUUSD is trading at 1716.00; the instrument is moving above Ichimoku Cloud, thus indicating a bullish tendency. The markets could indicate that the price may test Tenkan-Sen and Kijun-Sen 1705.00 and then resume moving upwards to reach 1785.00. Another signal to confirm further ascending movement is the price’s rebounding from the rising channel’s downside border. However, the scenario that implies further growth may be canceled if the price breaks the cloud’s downside border and fixes below 1665.00. In this case, the pair may continue falling towards 1615.00.

XAUUSD
Risk Warning: the result of previous trading operations do not guarantee the same results in the future

AUDUSD, “Australian Dollar vs US Dollar”

AUDUSD is trading at 0.6341; the instrument is moving inside Ichimoku Cloud, thus indicating a sideways tendency. The markets could indicate that the price may test the support level at 0.6295 and then resume moving upwards to reach 0.6535. Another signal to confirm further ascending movement is the price’s rebounding from the rising channel’s downside border. However, the scenario that implies further growth may be canceled if the price breaks the cloud’s downside border and fixes below 0.6210. In this case, the pair may continue falling towards 0.6135. After breaking the descending channel’s upside border and fixing above 0.6395, the price may resume moving upwards.

AUDUSD
Risk Warning: the result of previous trading operations do not guarantee the same results in the future

USDCAD, “US Dollar vs Canadian Dollar”

USDCAD is trading at 1.4128; the instrument is moving above Ichimoku Cloud, thus indicating a bullish tendency. The markets could indicate that the price may test the cloud’s upside border at 1.4050 and then resume moving upwards to reach 1.4385. Another signal to confirm further ascending movement is the price’s rebounding from the descending channel’s upside border. However, the scenario that implies further growth may be canceled if the price breaks the cloud’s downside border and fixes below 1.3975. In this case, the pair may continue falling towards 1.3905.

USDCAD

Fibonacci Retracements Analysis 23.04.2020 (AUDUSD, USDCAD)

Fibonacci Retracements Analysis 23.04.2020 (AUDUSD, USDCAD)

23.04.2020

AUDUSD, “Australian Dollar vs US Dollar”

As we can see in the H4 chart, the divergence on MACD made the pair complete the correctional uptrend at 76.0% fibo and start a new pullback to the downside, which has already tested 0.6235. However, the pullback was pretty fast, so the instrument may start a new rising impulse towards 0.6445. After breaking this level, the pair may continue growing to reach the mid-term fractal high at 0.6684.

AUDUSD_H4
Risk Warning: the result of previous trading operations do not guarantee the same results in the future

In the H1 chart, the convergence made AUDUSD reverse and start a new growth. However, as long as the high at 0.6445 isn’t broken, the pair may yet resume falling towards 23.6% and 38.2% fibo at 0.6223 and 0.6086 respectively.

AUDUSD_H1
Risk Warning: the result of previous trading operations do not guarantee the same results in the future

USDCAD, “US Dollar vs Canadian Dollar”

In the H4 chart, the convergence made the pair resume growing and test the resistance at 1.4262. However, the price failed to break this level and fix above it. In this light, the instrument is expected to resume falling. The downside targets may be 50.0% and 61.8% fibo at 1.3808 and 1.3606 respectively.

USDCAD_H4
Risk Warning: the result of previous trading operations do not guarantee the same results in the future

As we can see in the H1 chart, the correctional uptrend reached 50.0% fibo and then there was a divergence on MACD indicating a possible reversal and a new decline. At the moment, the pair is heading towards 38.2%, 50.0%, 61.8%, and 76.0% fibo at 1.4108, 1.4060, 1.4012 and 1.3953 respectively.

USDCAD_H1

rfxsignals April 22, 2020 No Comments

Daily Free Forex Signals For 22/04/2020

Daily Free Forex Signals For 22/04/2020

Here your going to see Daily Free Forex Signals For 22/04/2020 to free forex signal alert from our kitkat trading system and other trading logic’s .we provide like this free forex signals from 2012 on wards with more than 50,000 traders around the world .The free forex signals have 70 to 85% quality always .we give for you a note as maximum focus take profit 1 as your target and must use stop loss values .if you have any other query’s please visit our live chat or email option

CADCHF BUY: 0.68523
SL: 0.68023
TP1: 0.68738
TP2: 0.68936

EURNZD SELL: 1.81140
SL: 1.82410
TP1: 1.80920
TP2: 1.80710

GBPCHF BUY: 1.19501
SL: 1.18498
TP1: 1.19733
TP2: 1.19972

USDCAD SELL: 1.41459
SL: 1.42680
TP1: 1.41245
TP2: 1.41013

GBPUSD BUY: 1.23434
SL: 1.22464
TP1: 1.23681
TP2: 1.23965

EURUSD BUY: 1.08637
SL: 1.08056
TP1: 1.08710
TP2: 1.08772

NZDUSD BUY: 0.59917
SL: 0.59430
TP1: 0.60110
TP2: 0.60323

NZDJPY BUY: 64.559
SL: 63.954
TP1: 64.771
TP2: 64.987

AUDUSD BUY: 0.63518
SL: 0.62545
TP1: 0.63741
TP2: 0.63964

EURAUD SEL: 1.71059
SL: 1.73390
TP1: 1.70824
TP2: 1.70586

AUDJPY BUY: 68.358
SL: 67.047
TP1: 68.579
TP2: 68.810

AUDCAD BUY: 0.89810
SL: 0.88993
TP1: 0.90000
TP2: 0.90222

EURGBP SELL: 0.87952
SL: 0.88501
TP1: 0.87750
TP2: 0.87543

USDCHF SELL: 0.96724
SL: 0.97158
TP1: 0.96514
TP2: 0.96296

CHFJPY BUY: 111.225
SL: 110.710
TP1: 111.449
TP2: 111.678

GBPJPY BUY: 133.301
SL: 131.825
TP1: 133.535
TP2: 133.769