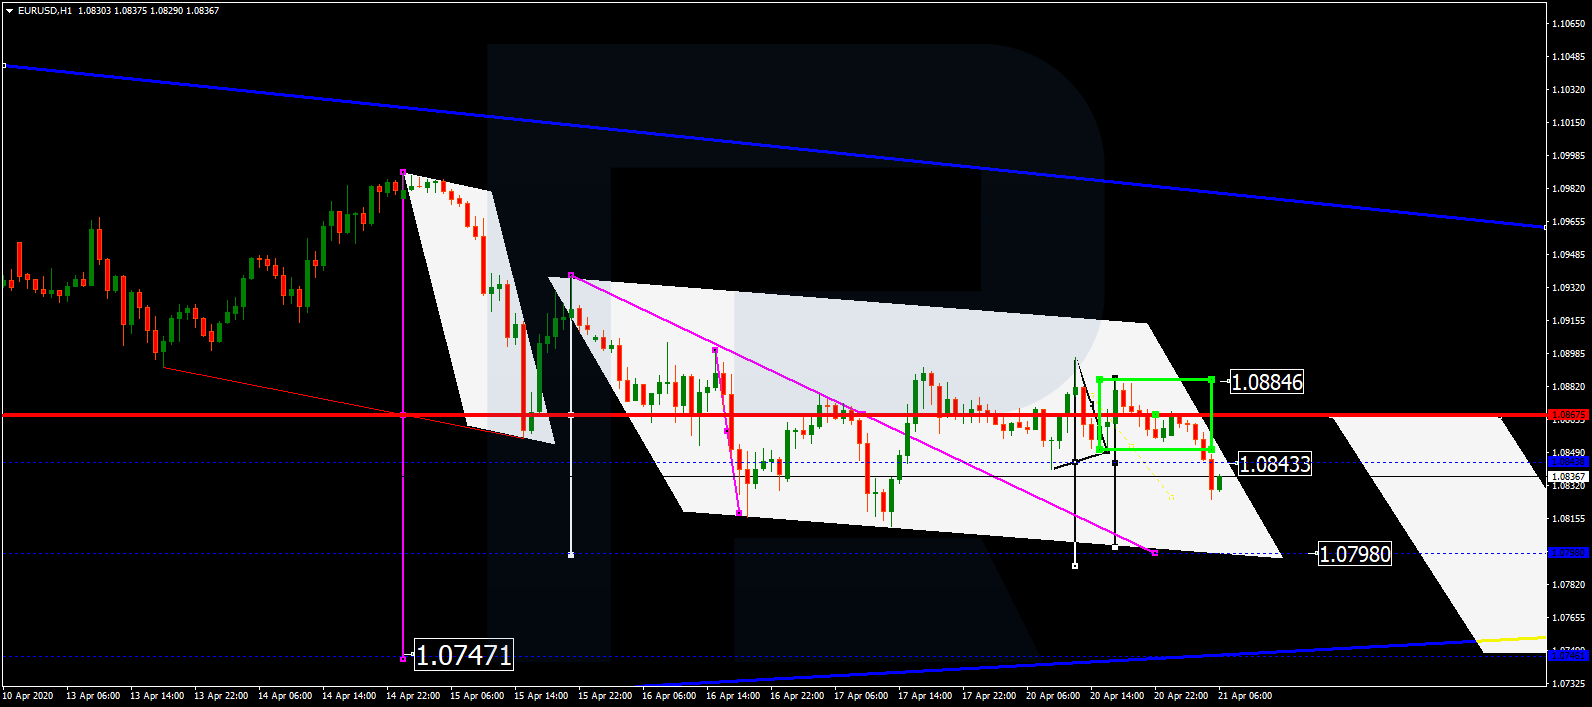
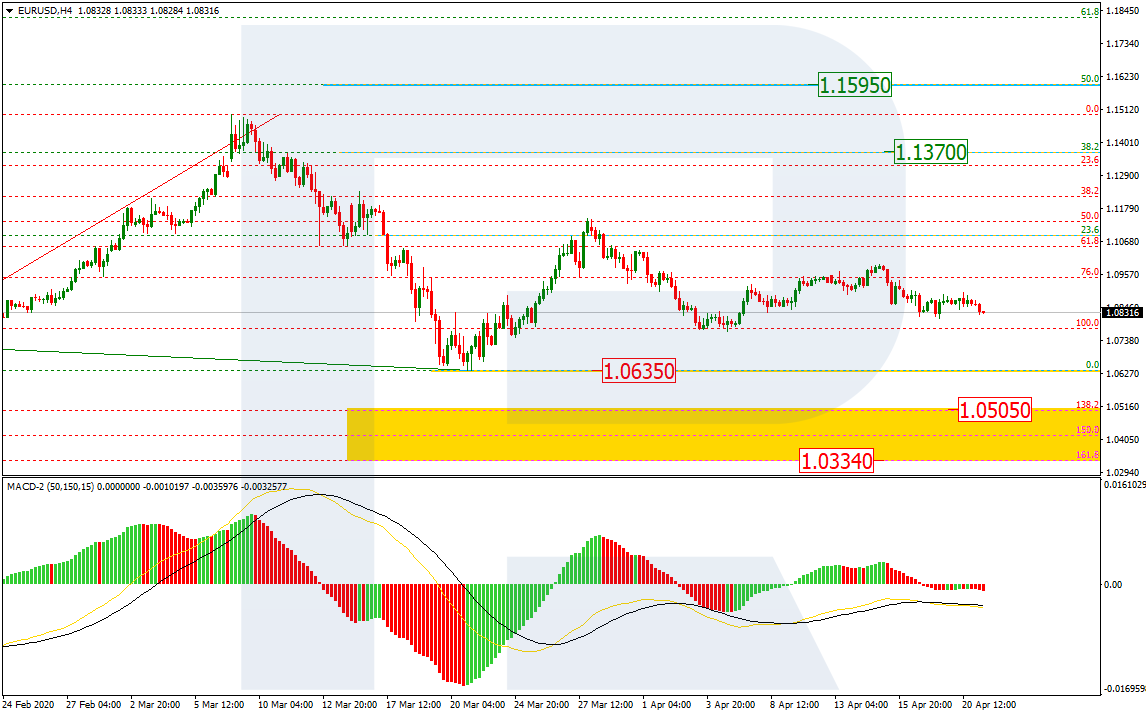
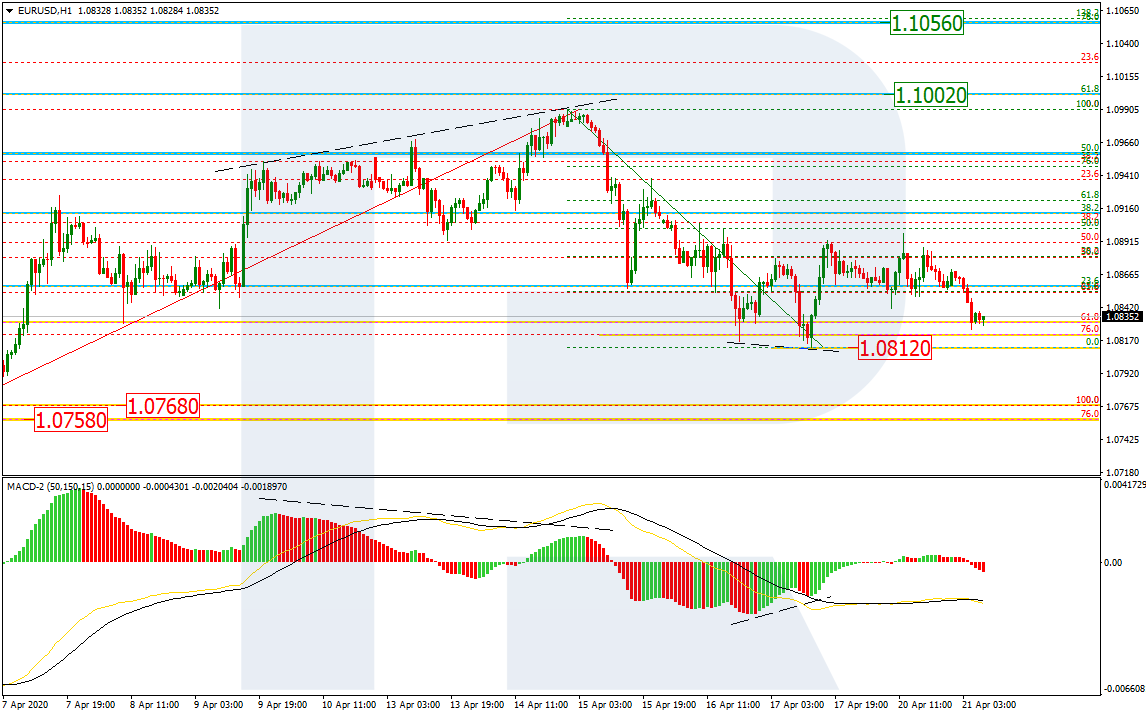
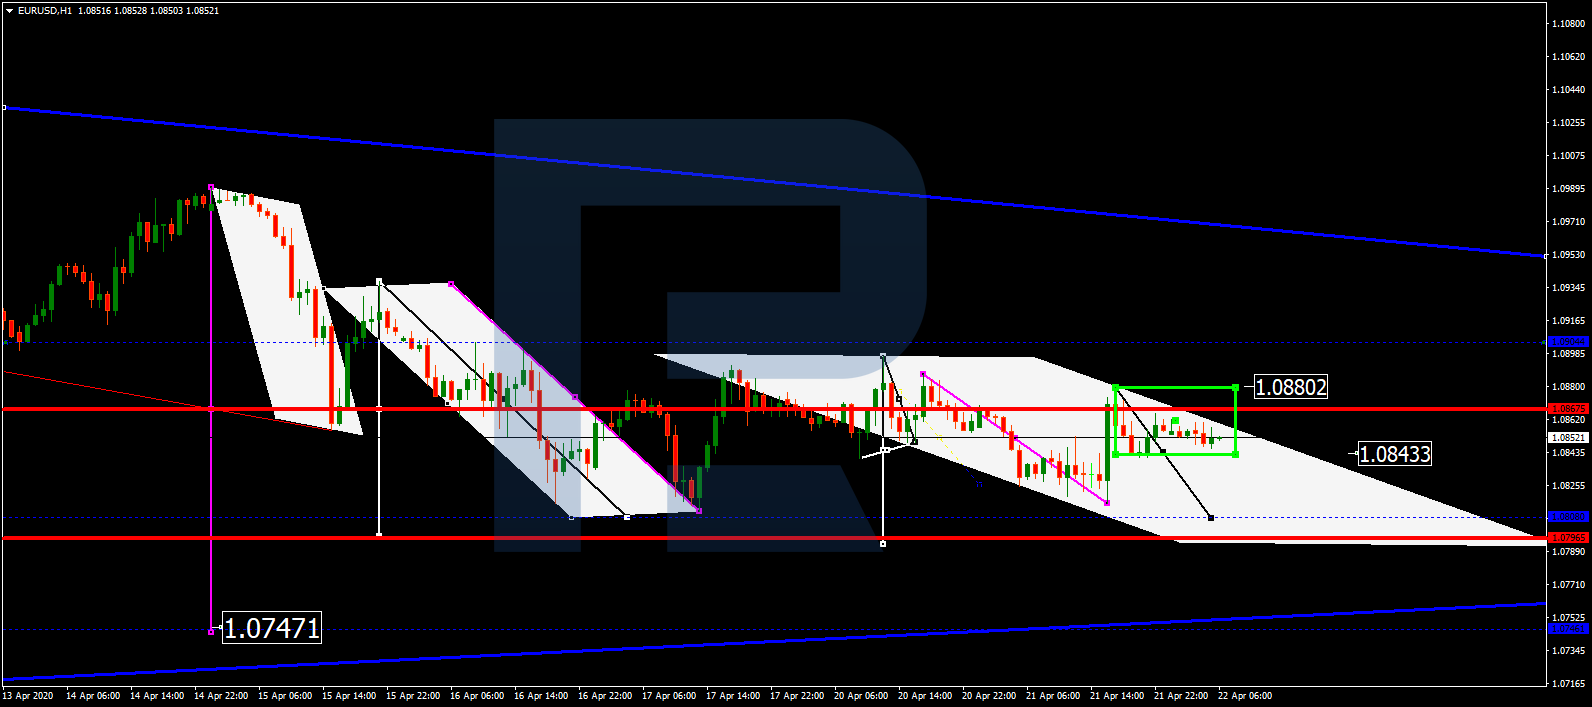
EURUSD, “Euro vs US Dollar”
After falling towards 1.0820, EURUSD has completed the ascending structure at 1.0880, thus forming a new consolidation range around 1.0844, which may be considered as a downside continuation pattern. According to the main scenario, the price is expected to start another decline to reach 1.0800 and then resume growing to return to 1.0844. After that, the instrument may form a new descending structure with the target at 1.0750.

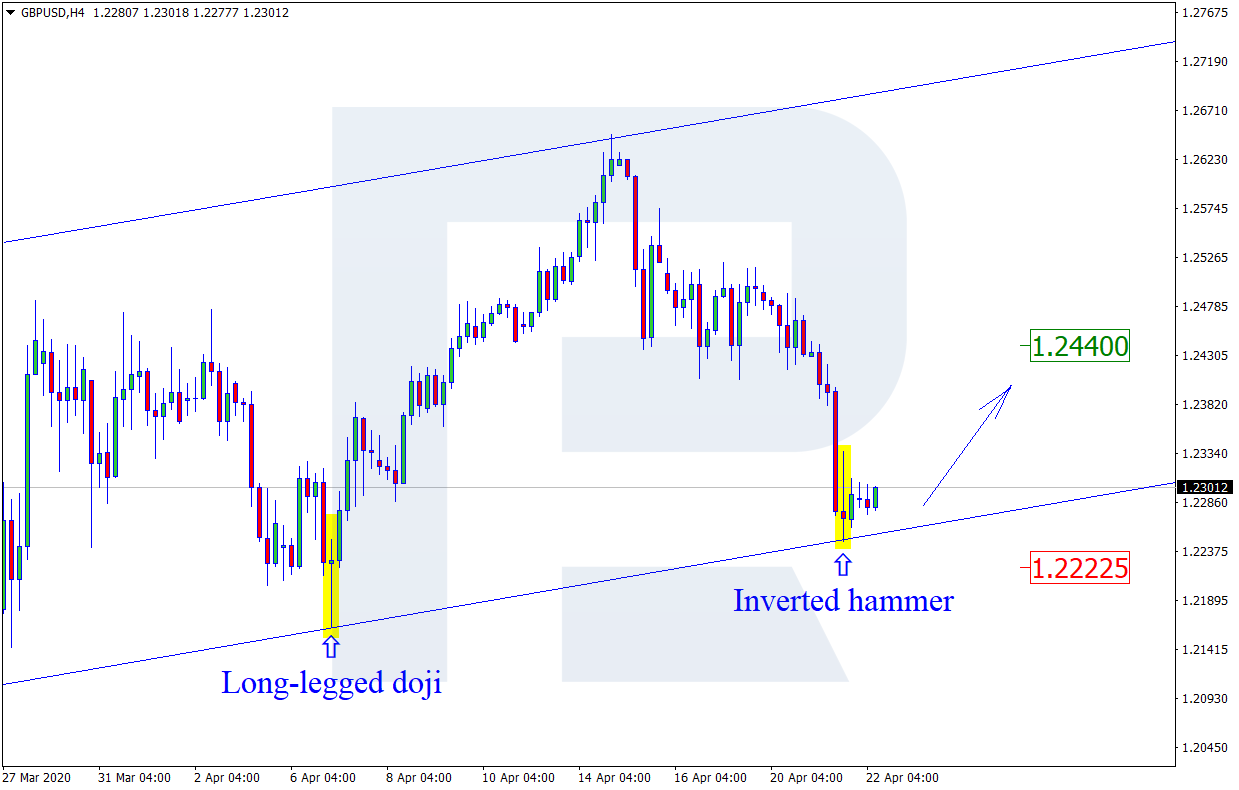
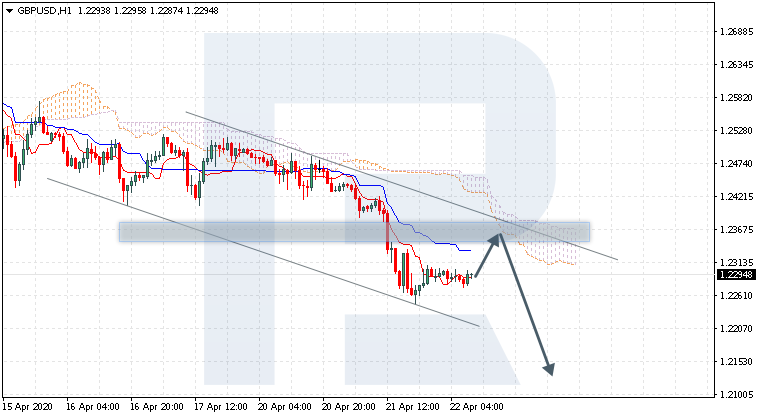
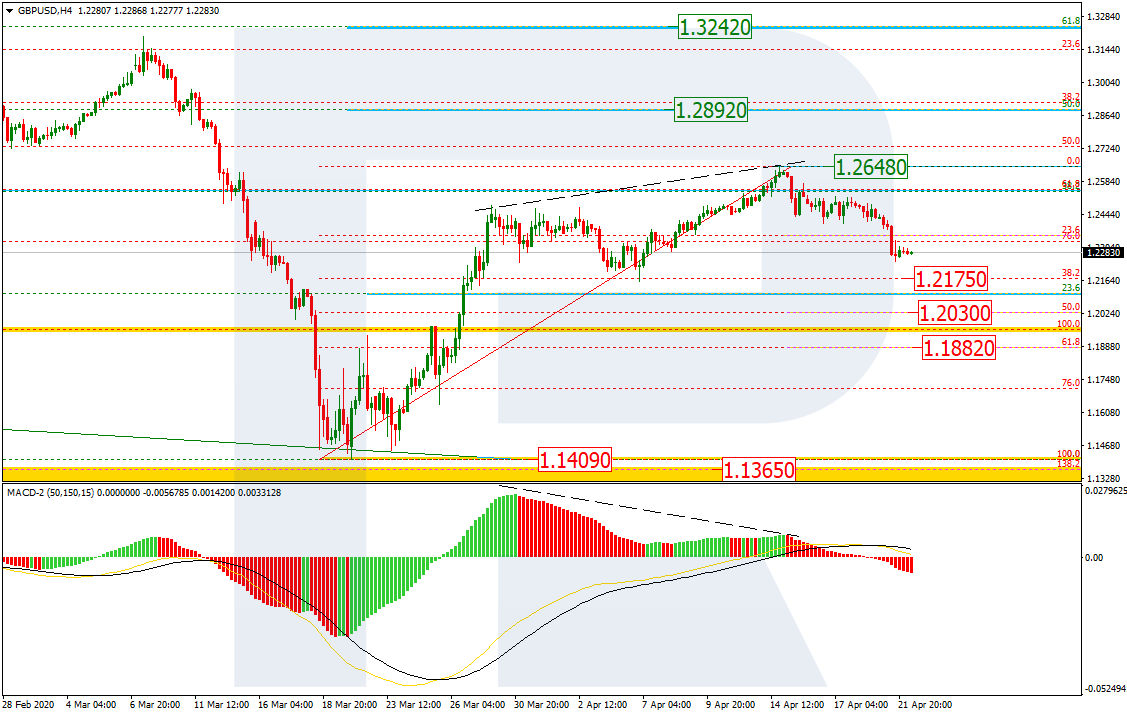
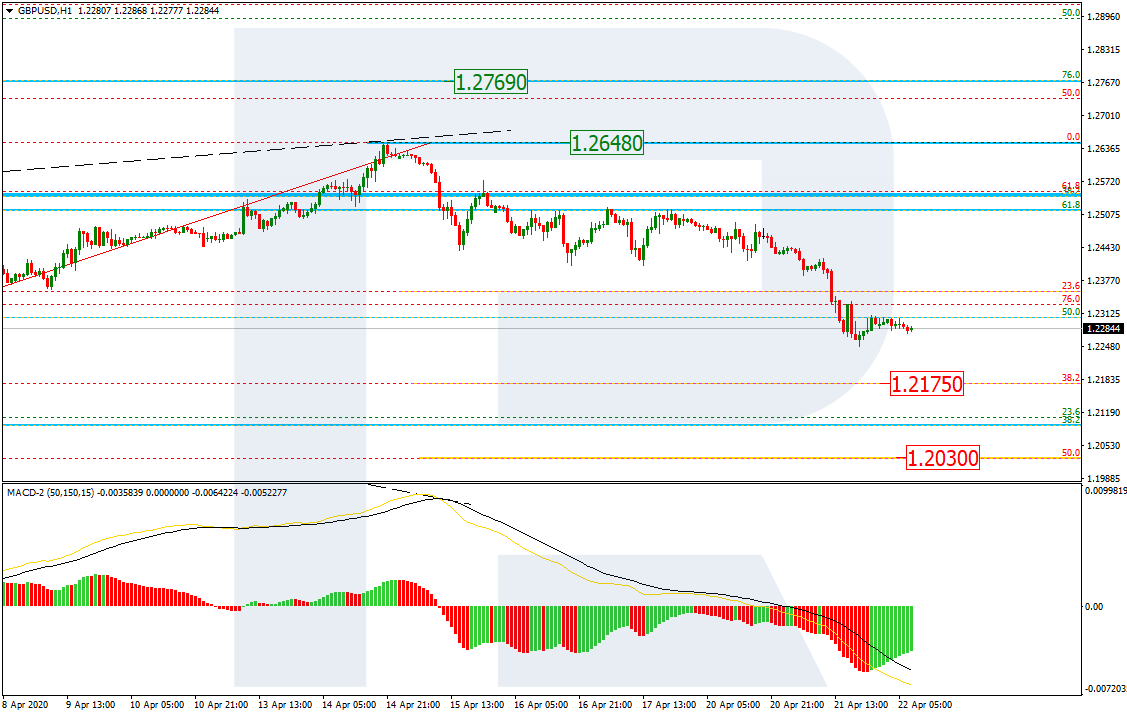
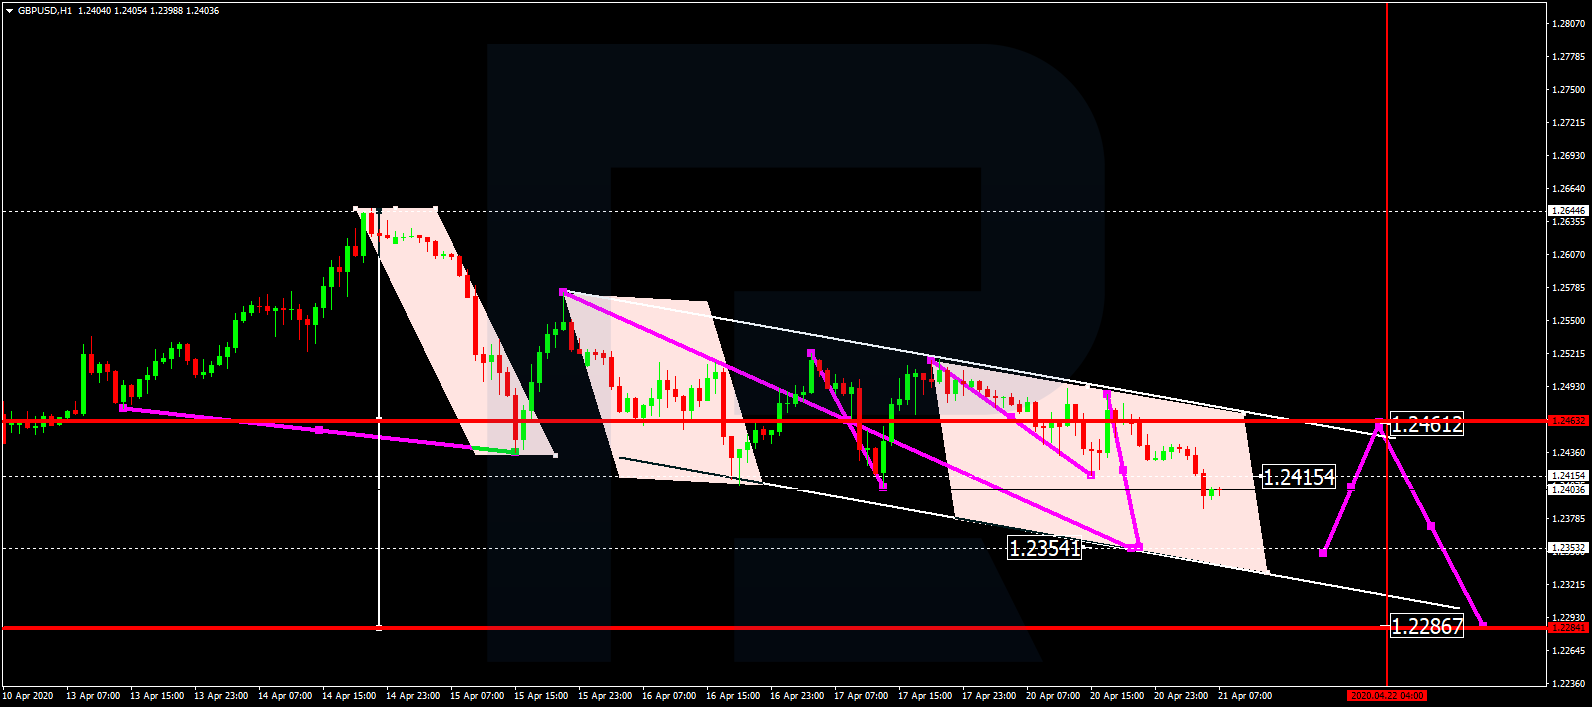
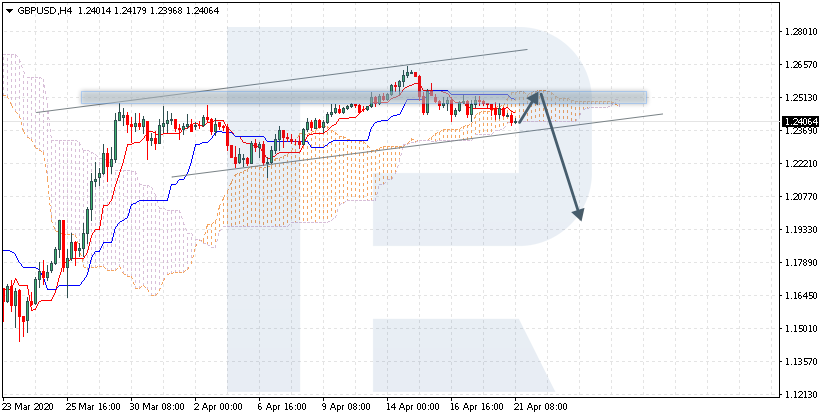
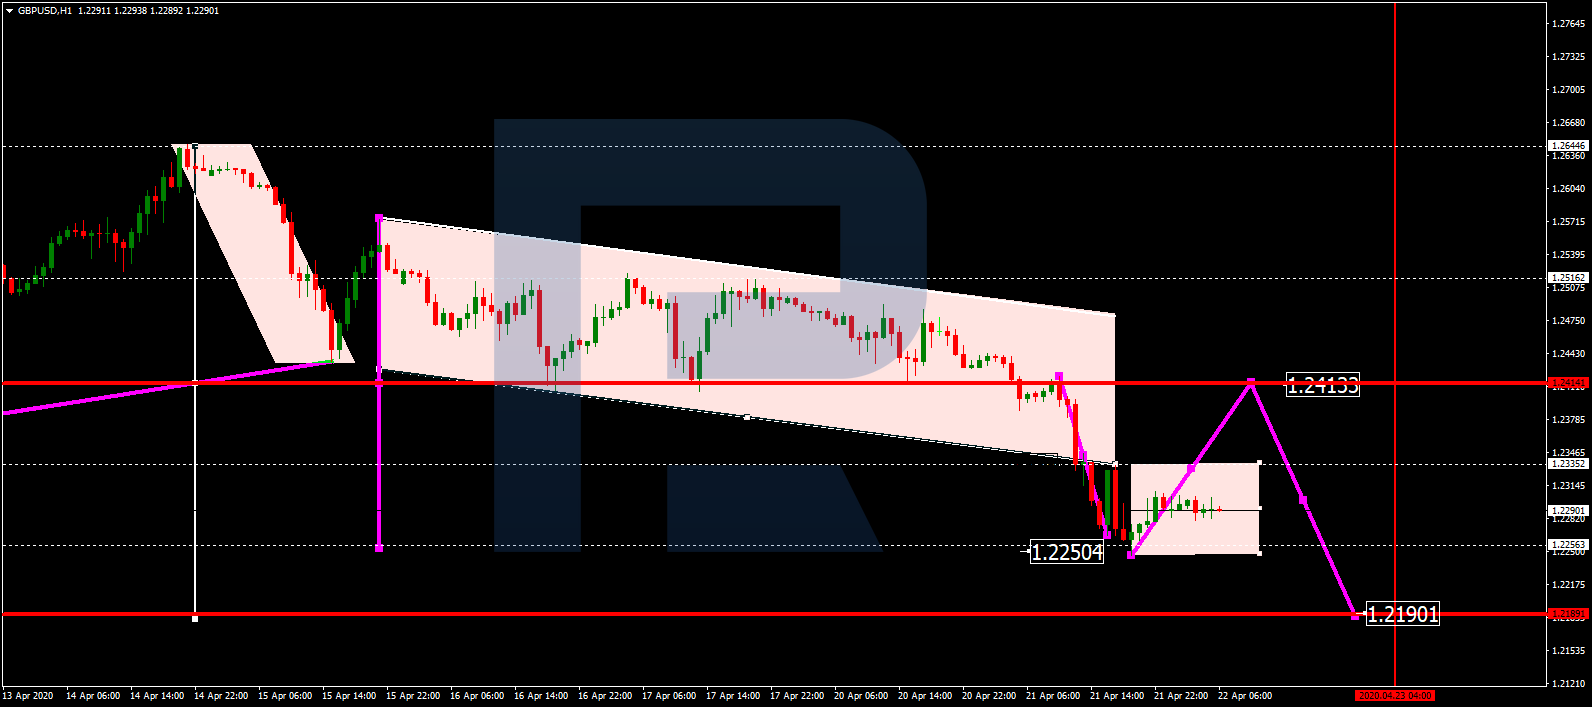
GBPUSD, “Great Britain Pound vs US Dollar”
After reaching the target of the third descending wave at 1.2250, GBPUSD is consolidating below this level. Possibly, the pair may grow towards 1.2333 and then resume moving downwards to reach 1.2190. Later, the market may start a new correction with the target at 1.2415.
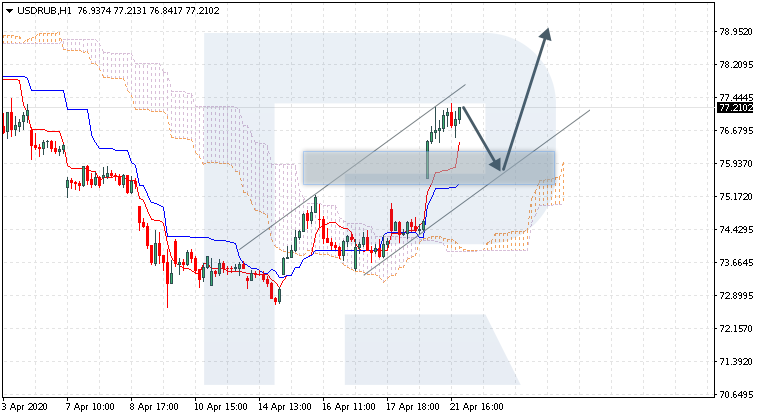
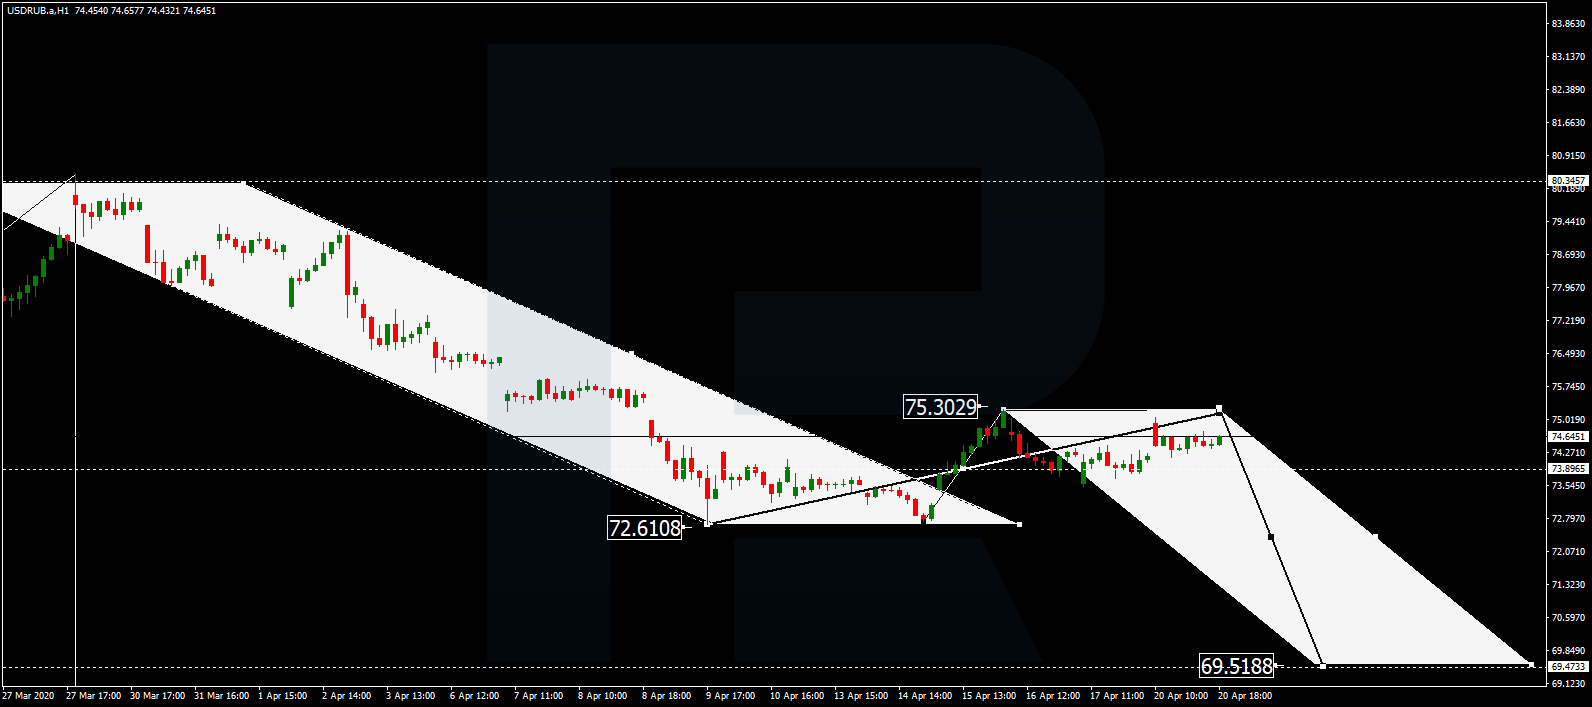
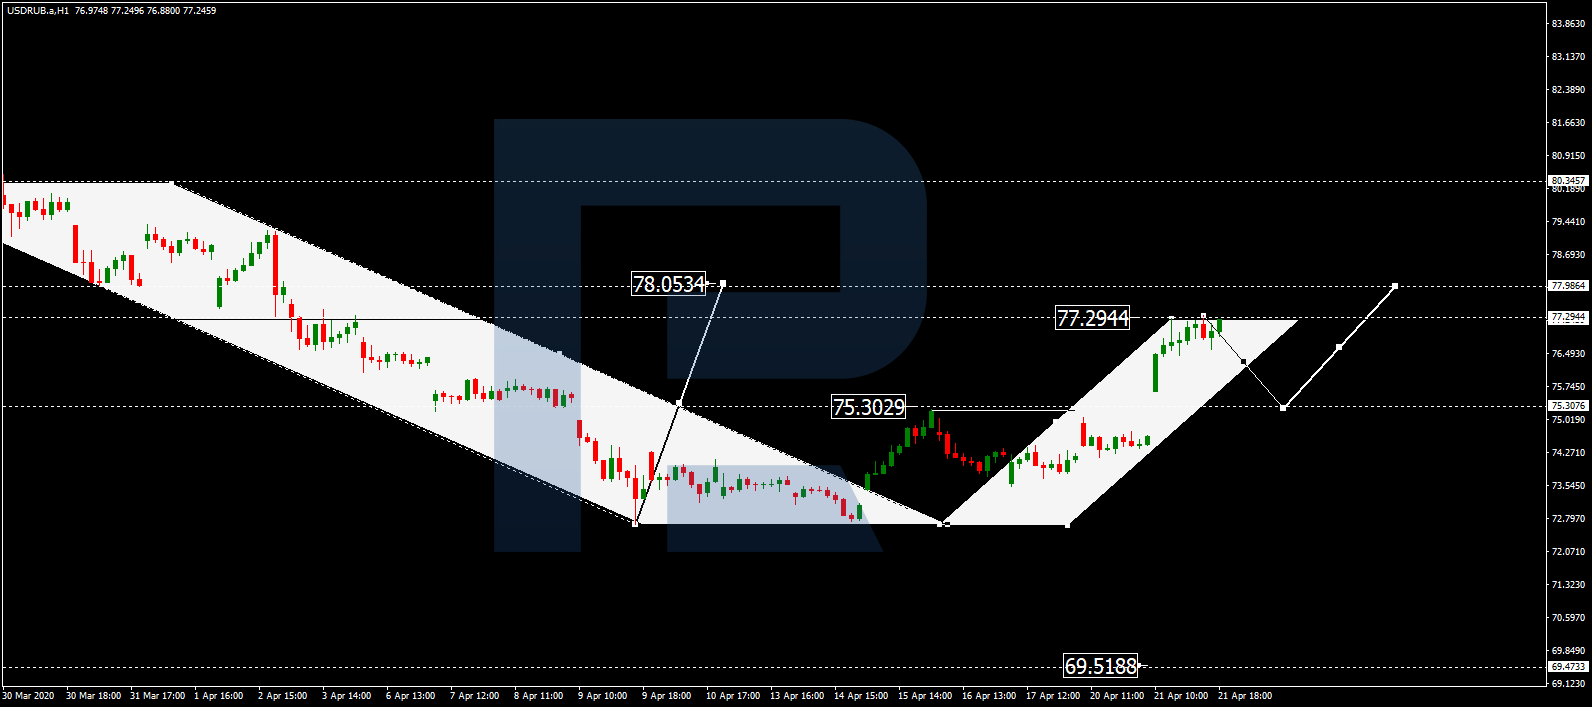
USDRUB, “US Dollar vs Russian Ruble”
After breaking 75.30 to the upside, USDRUB is still growing. Today, the pair may extend this wave to reach 78.05 and then start a new correction to return to 75.30.
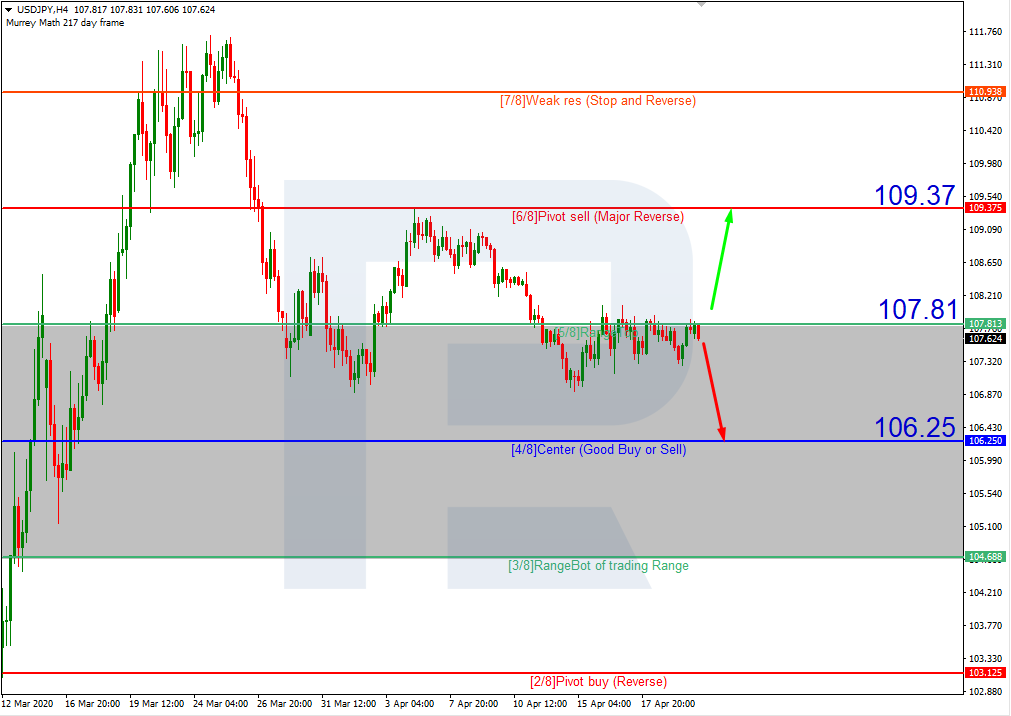
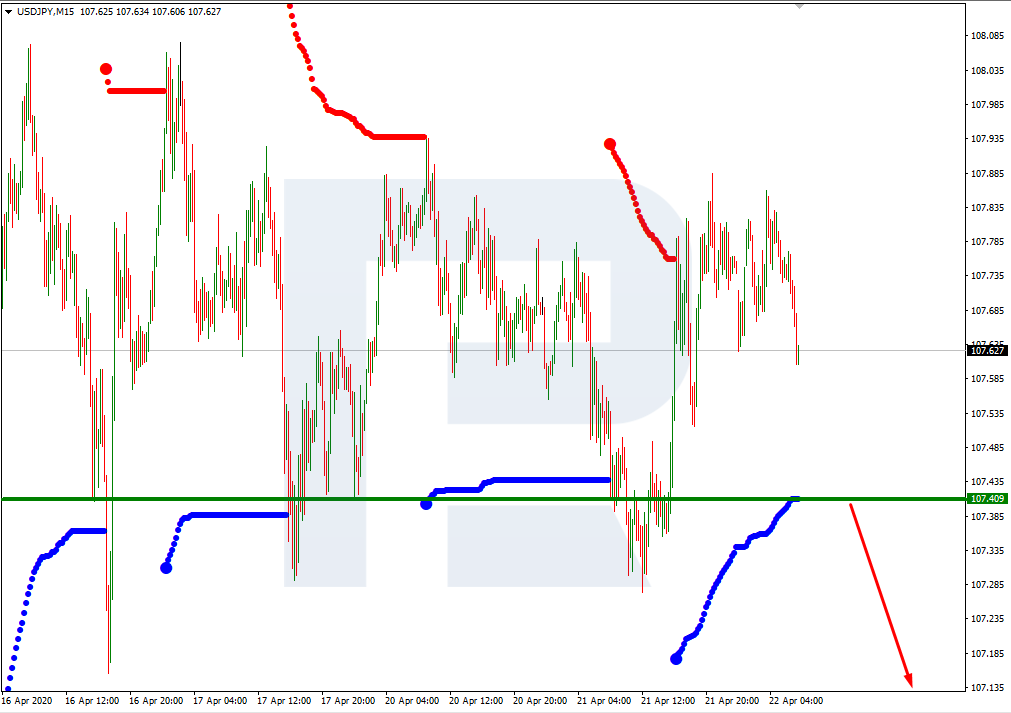
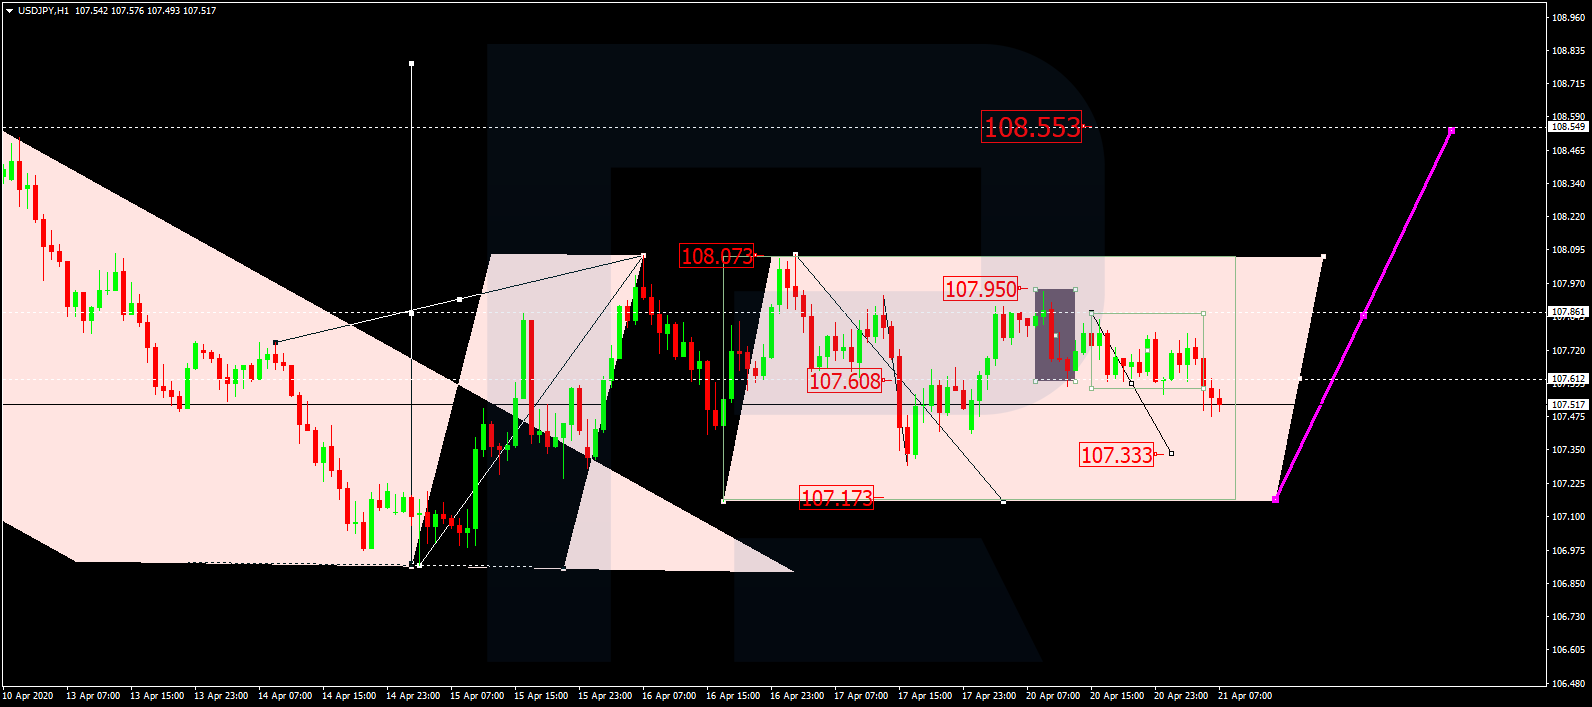
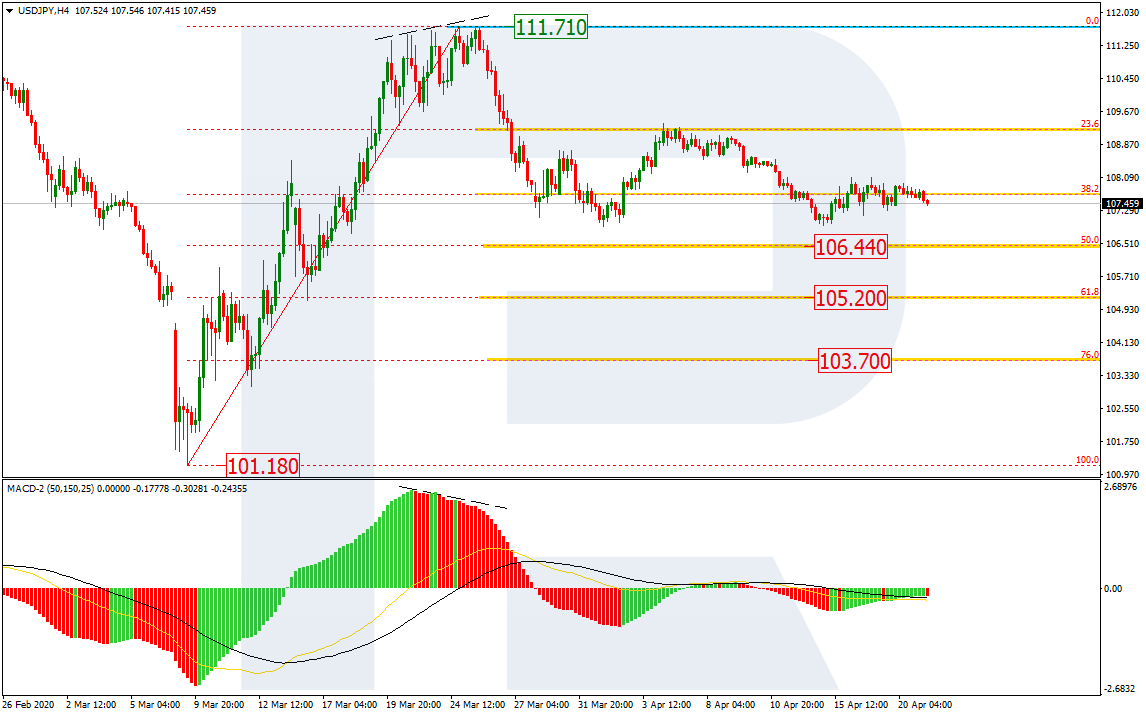
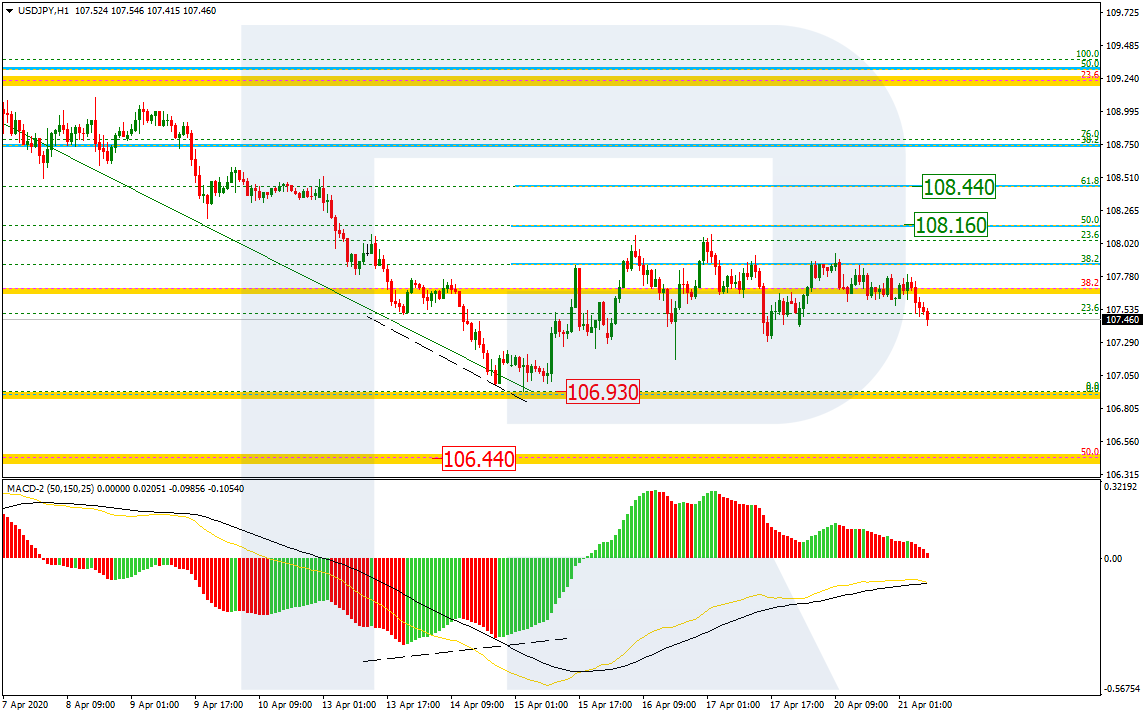
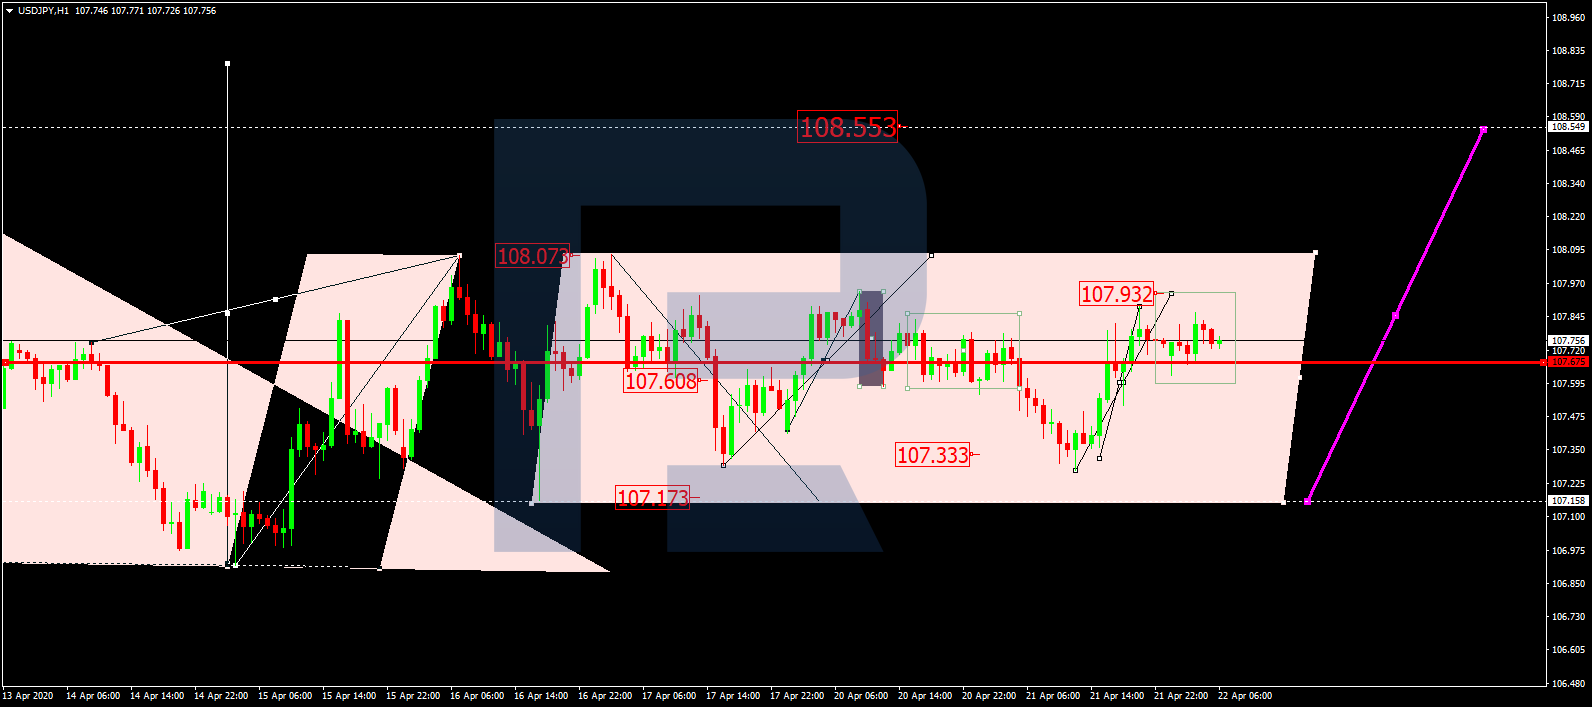
USDJPY, “US Dollar vs Japanese Yen”
USDJPY is forming a wide consolidation range around 107.60. Possibly, today the pair may expand the range up to 107.90 and then return to 107.60. After that, the instrument may expand the range again up to 108.07. However, if the price breaks 107.60 to the downside, the market may start another decline to expand the range down to 107.20.
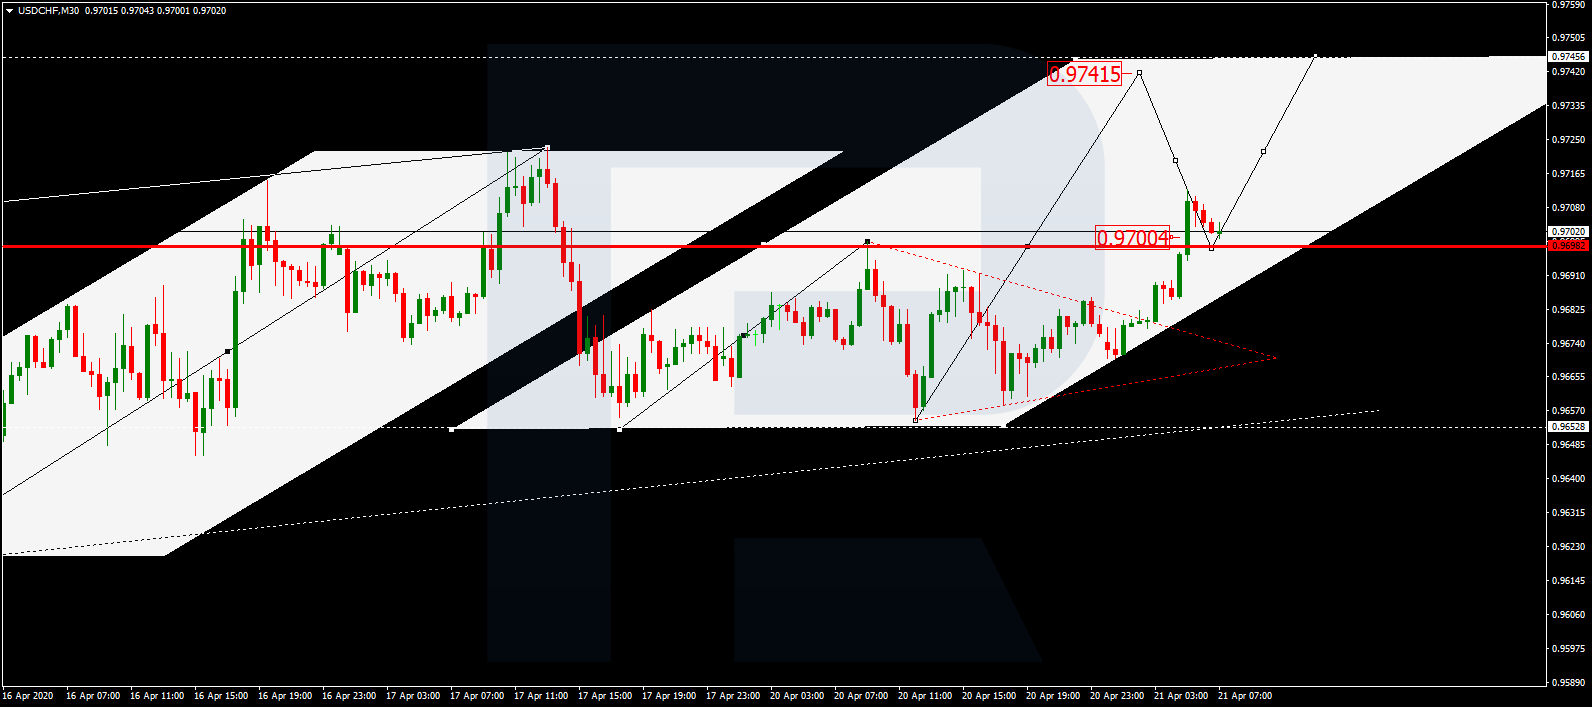
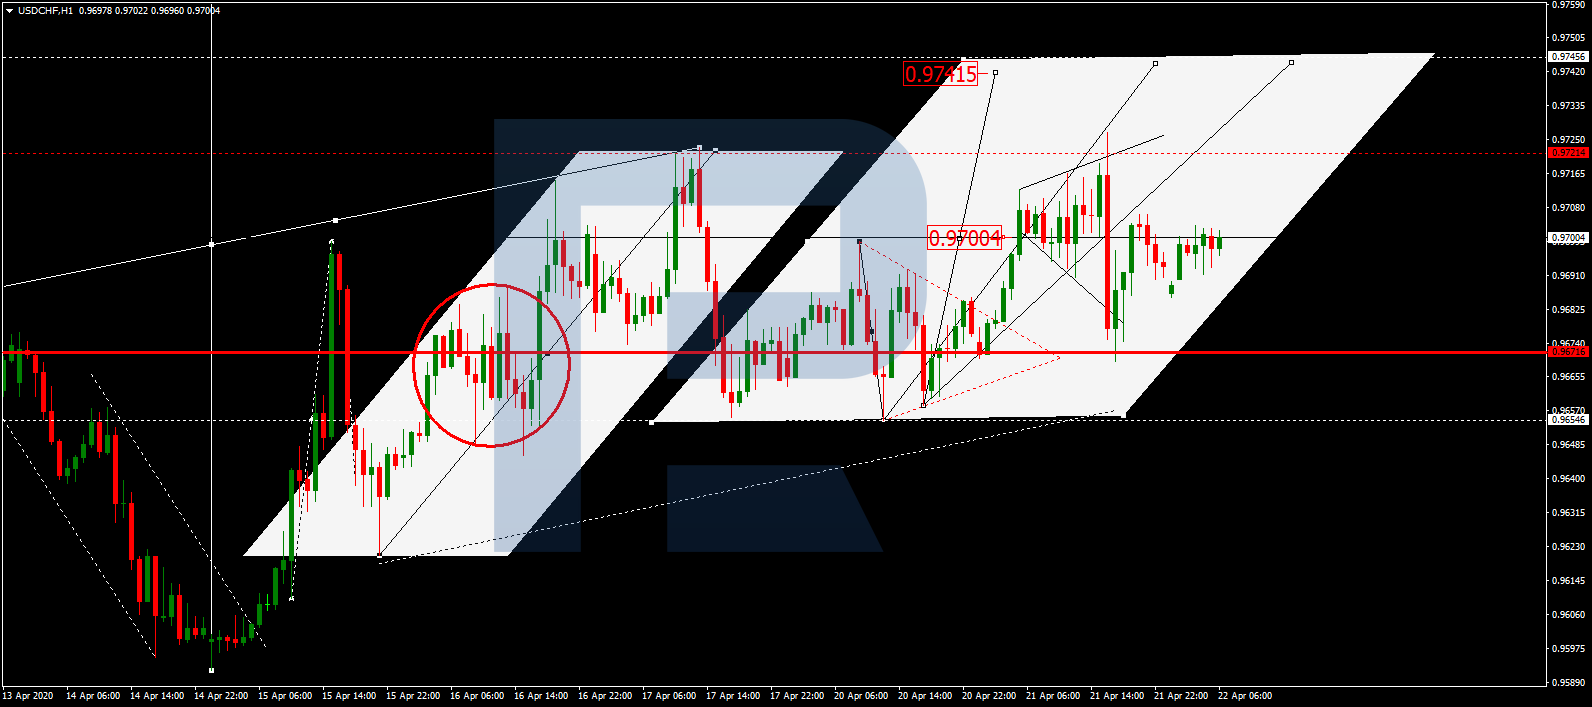
USDCHF, “US Dollar vs Swiss Franc”
After expanding the consolidation range up to 0.9726 and then down to 0.9675, USDCHF is moving not far from 0.9700, right in the middle of the range, which may be considered as an upside continuation pattern. The main scenario implies that the price may break the upside border and reach the first target at 0.9740. However, if the pair breaks the downside border, the market may correct towards 0.9650 and then resume trading upwards to reach the above-mentioned target.
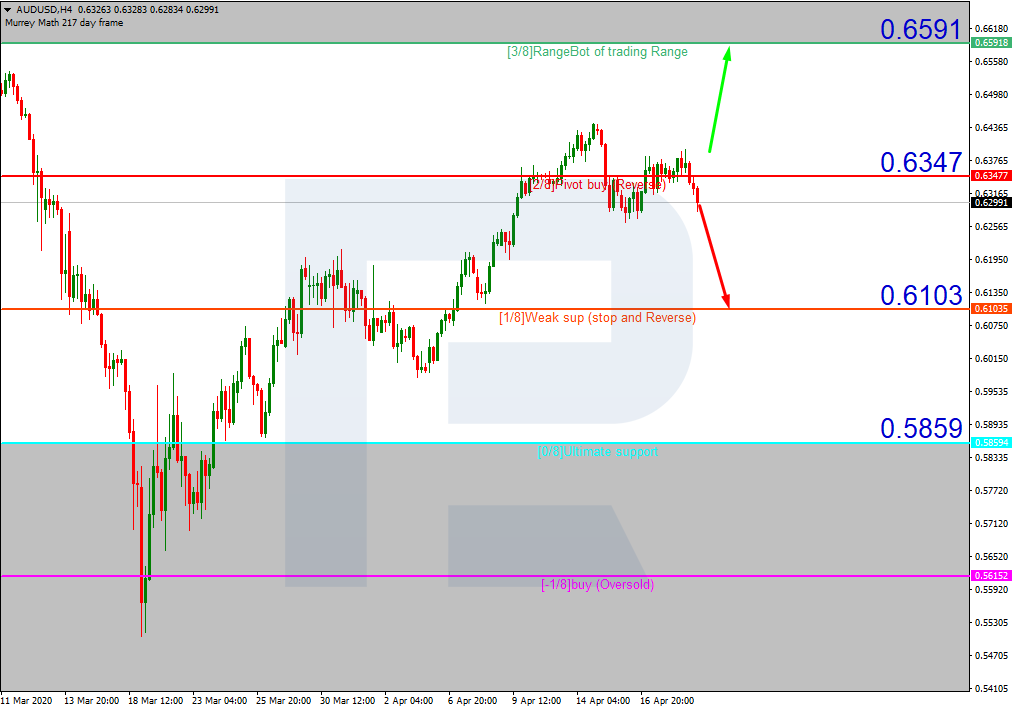
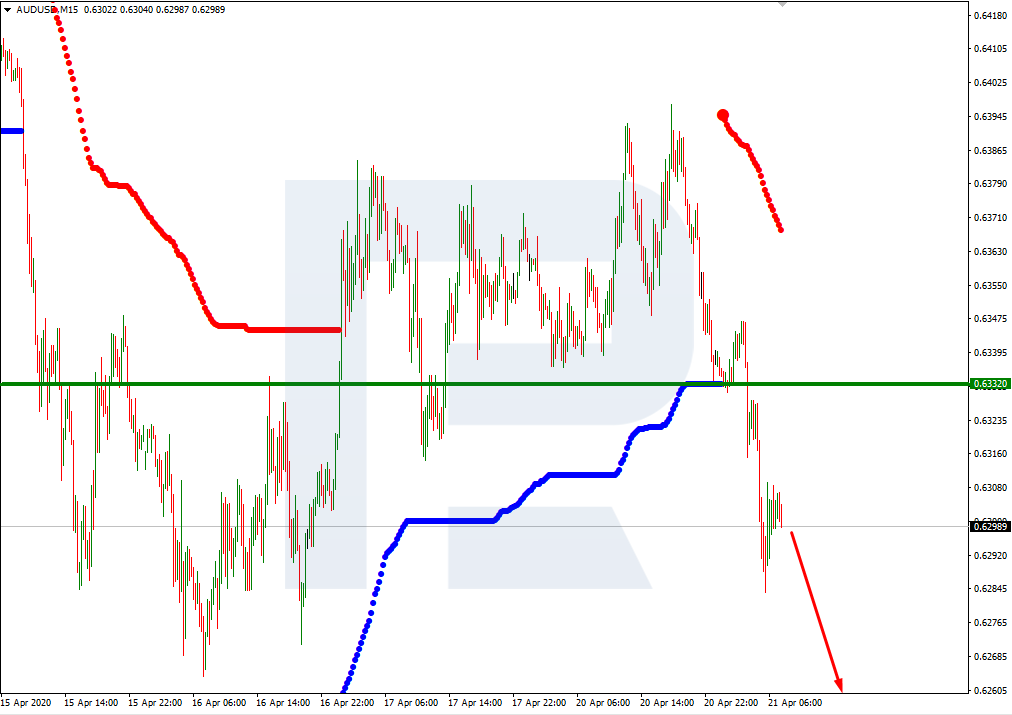
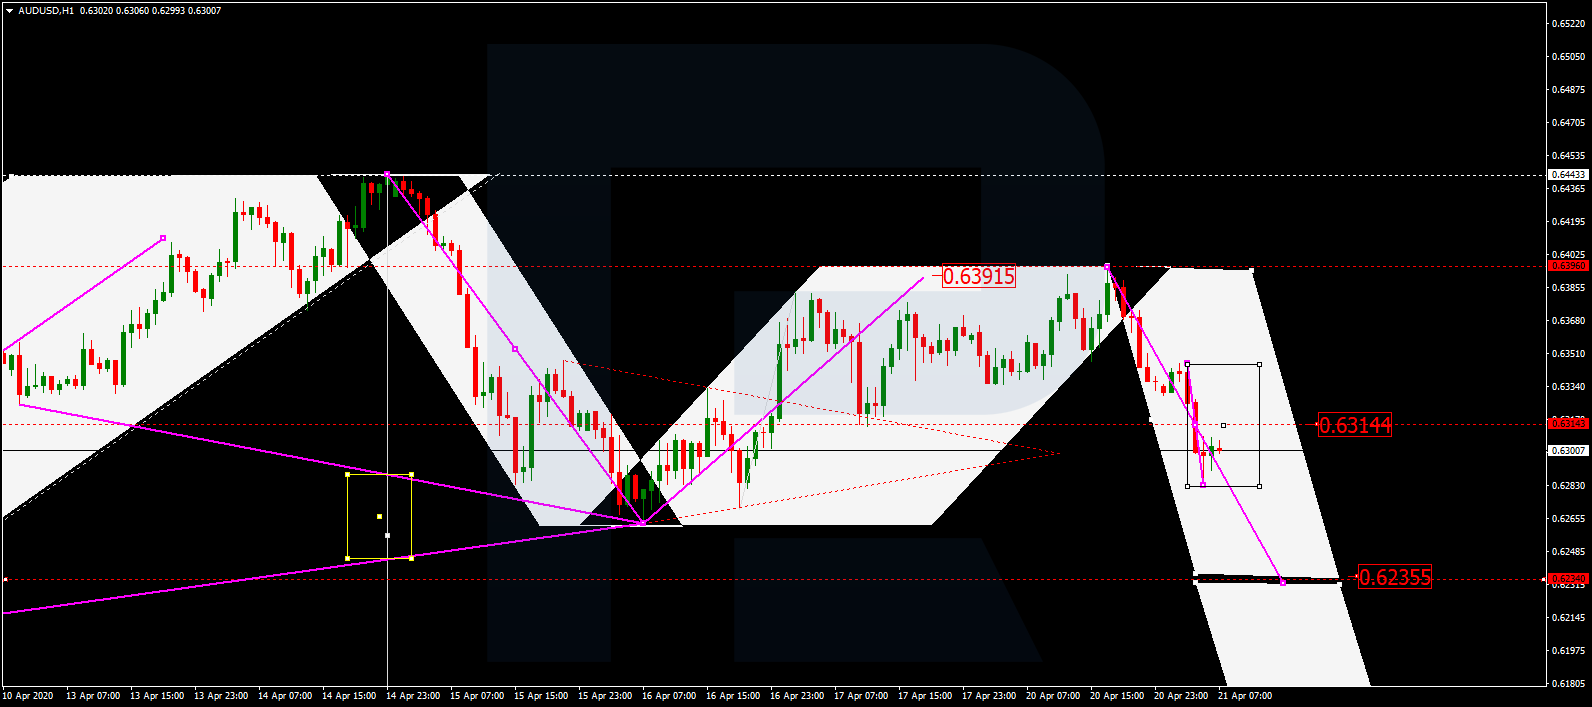
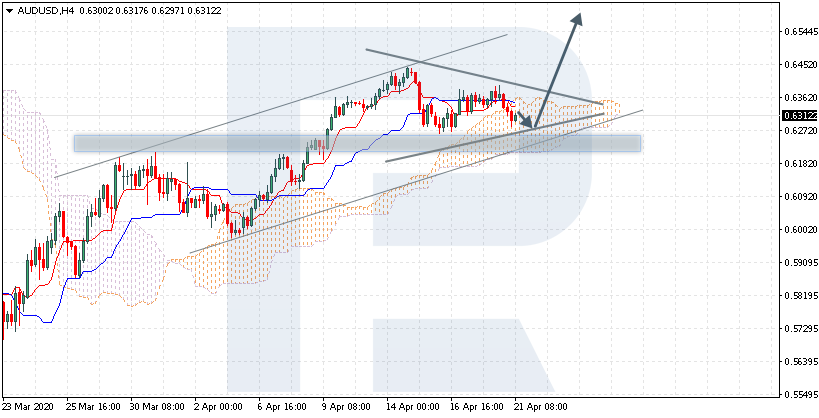
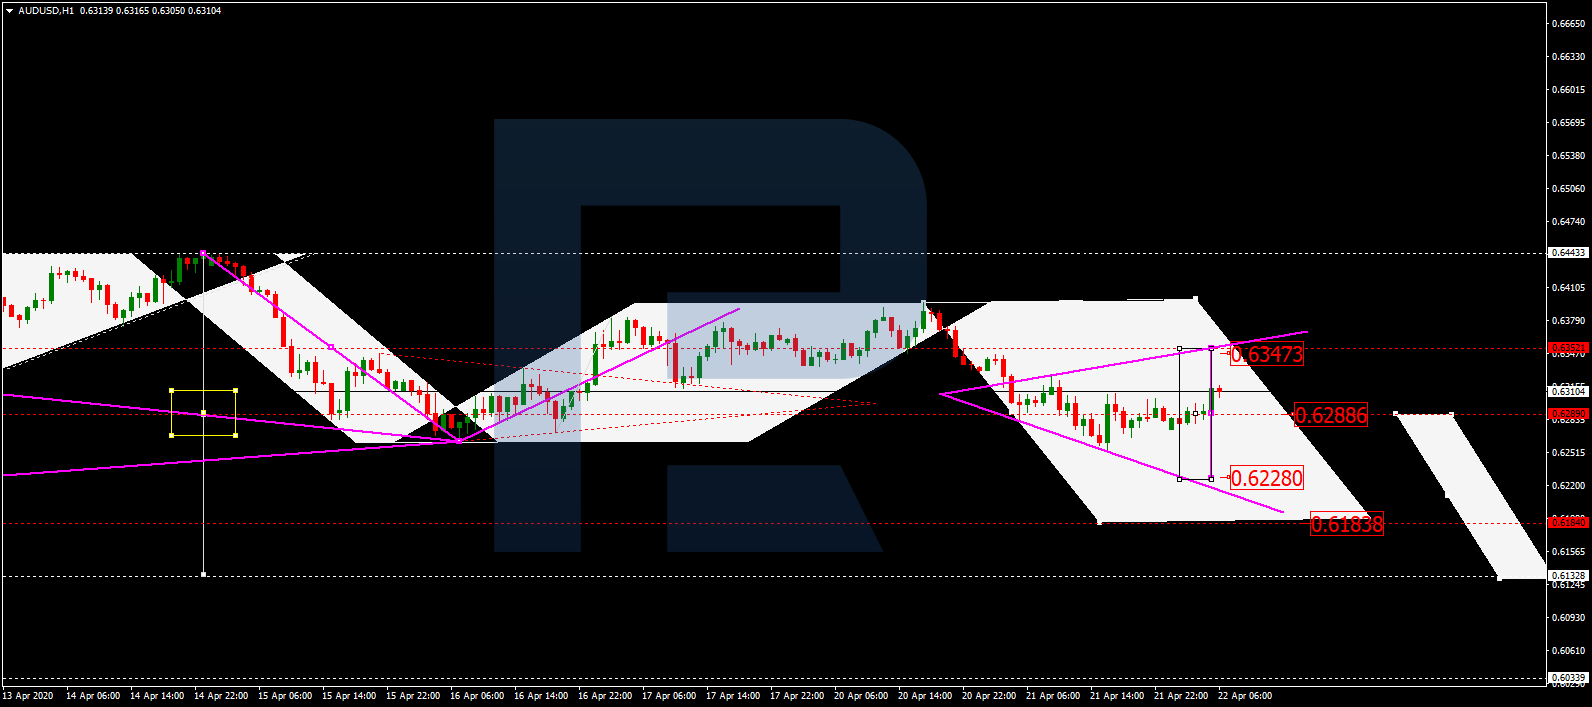
AUDUSD, “Australian Dollar vs US Dollar”
After finishing the descending structure towards 0.6235 and then completing the correction at 0.6352, AUDUSD is expected to continue falling and reach 0.6228. Possibly, the pair may form a downside continuation pattern. After that, the instrument may grow to reach 0.6288 and then resume trading inside the downtrend with the short-term target at 0.6183.
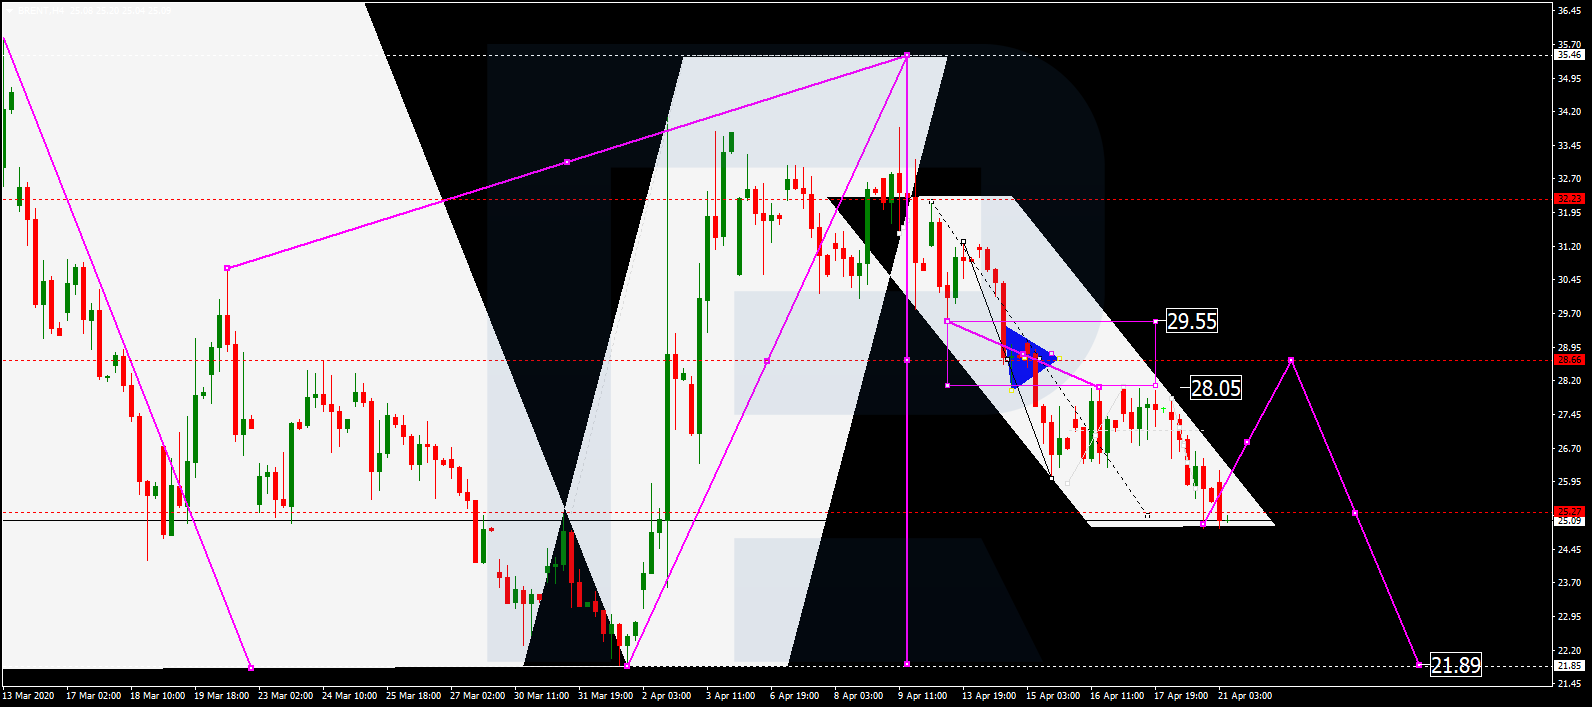
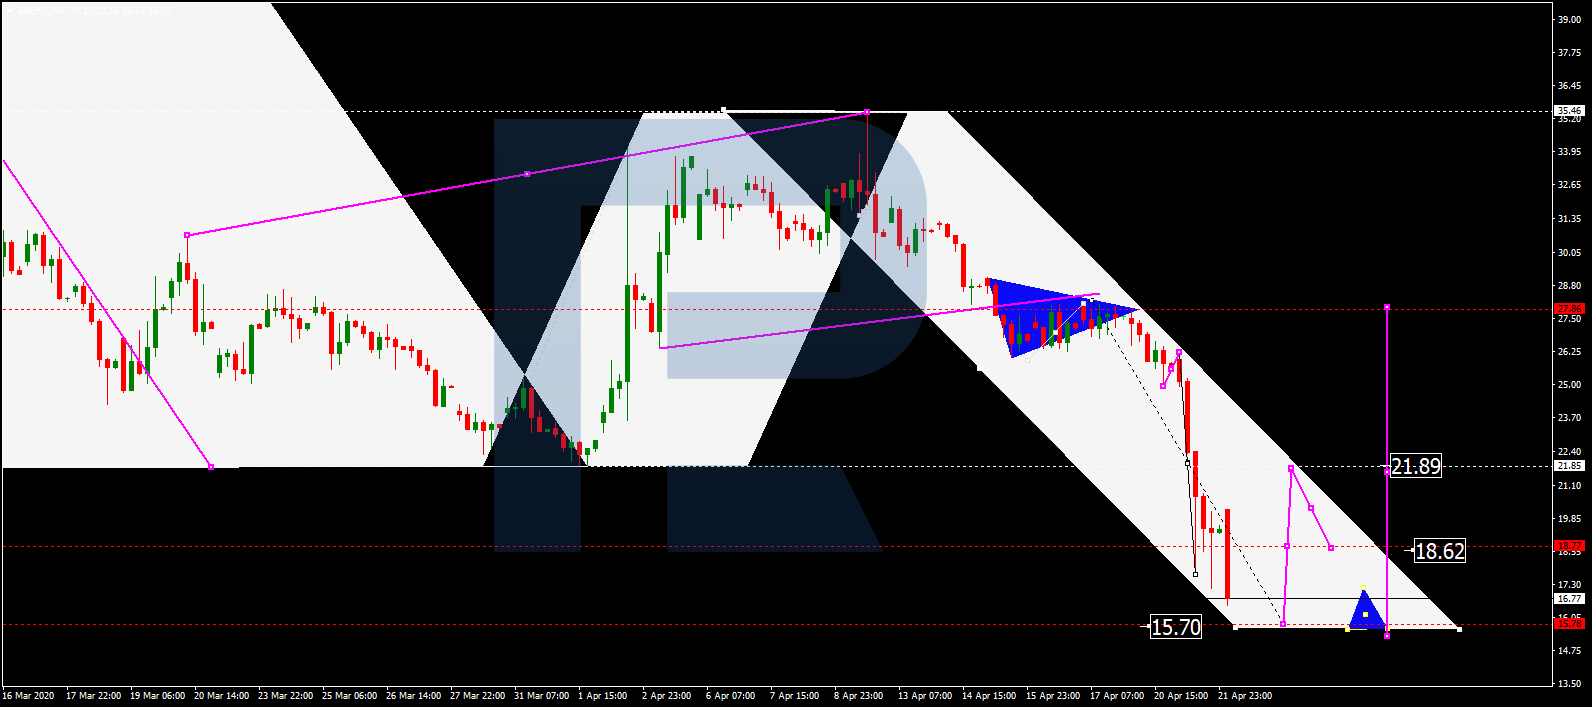
BRENT
Brent is moving downwards. Possibly, the pair may reach 15.70 and then resume growing towards 18.60, thus forming a new consolidation range between these two levels. If later the price breaks 25.00 to the upside, the market may form one more ascending structure with the target at 21.90.
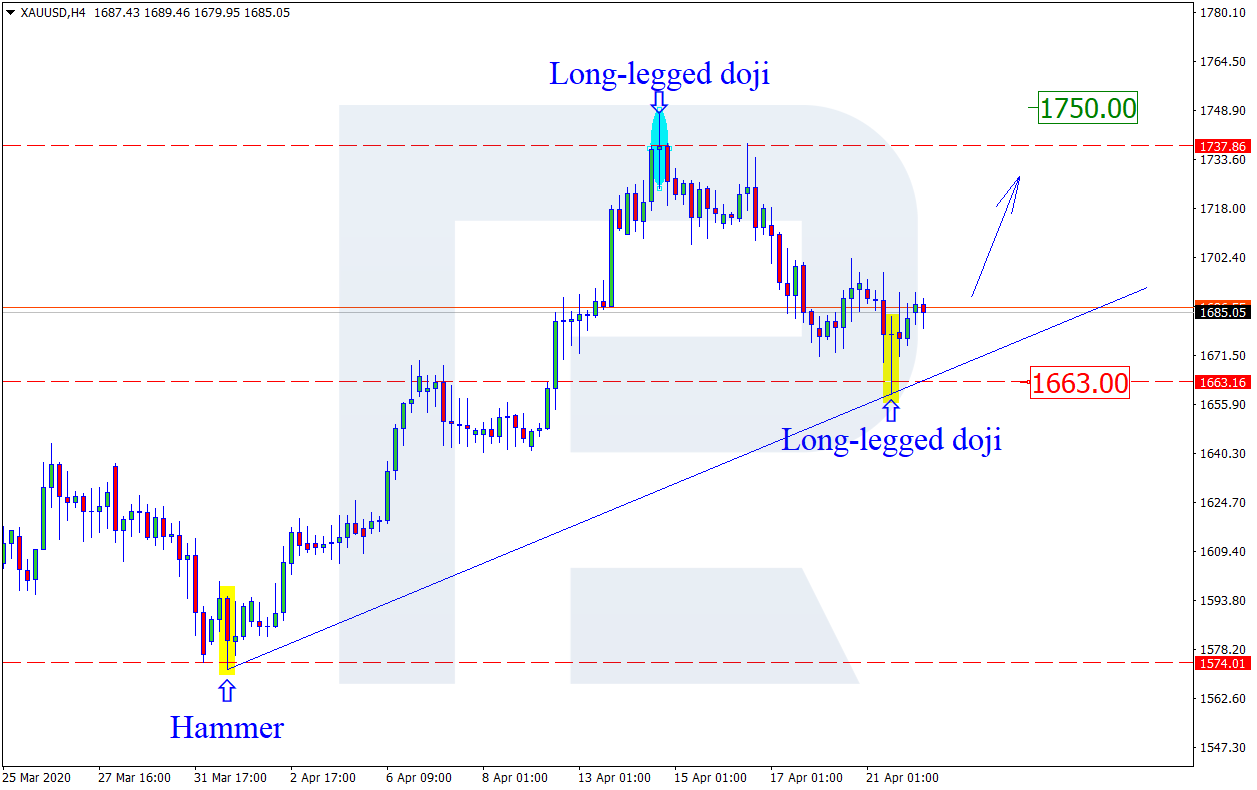
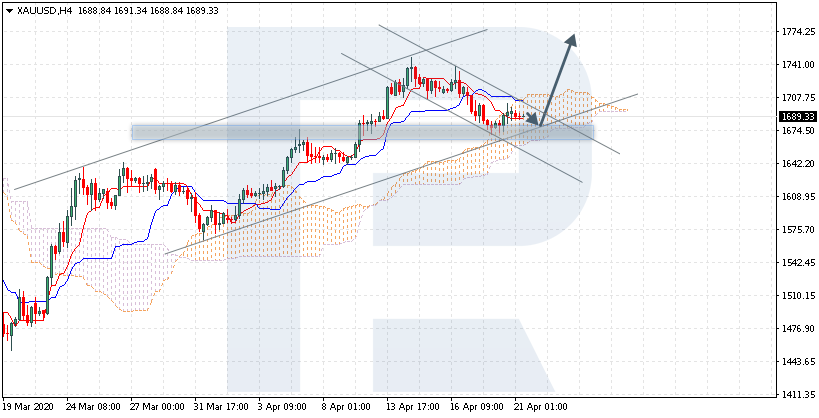
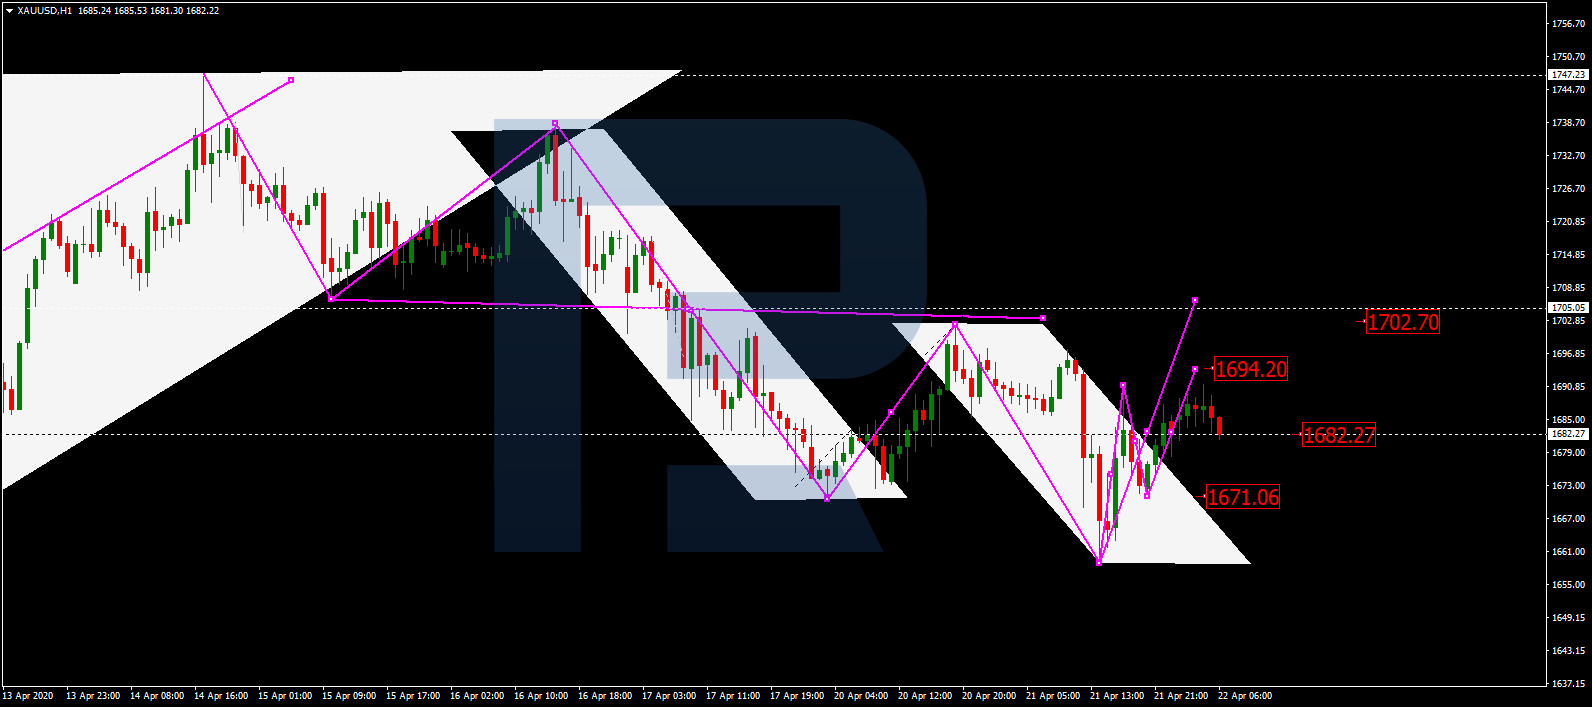
XAUUSD, “Gold vs US Dollar”
After completing the descending wave at 1660.00, Gold is trading upwards with the short-term target at 1694.20. After that, the instrument may correct towards 1682.22 and then form one more ascending structure to reach 1702.70.
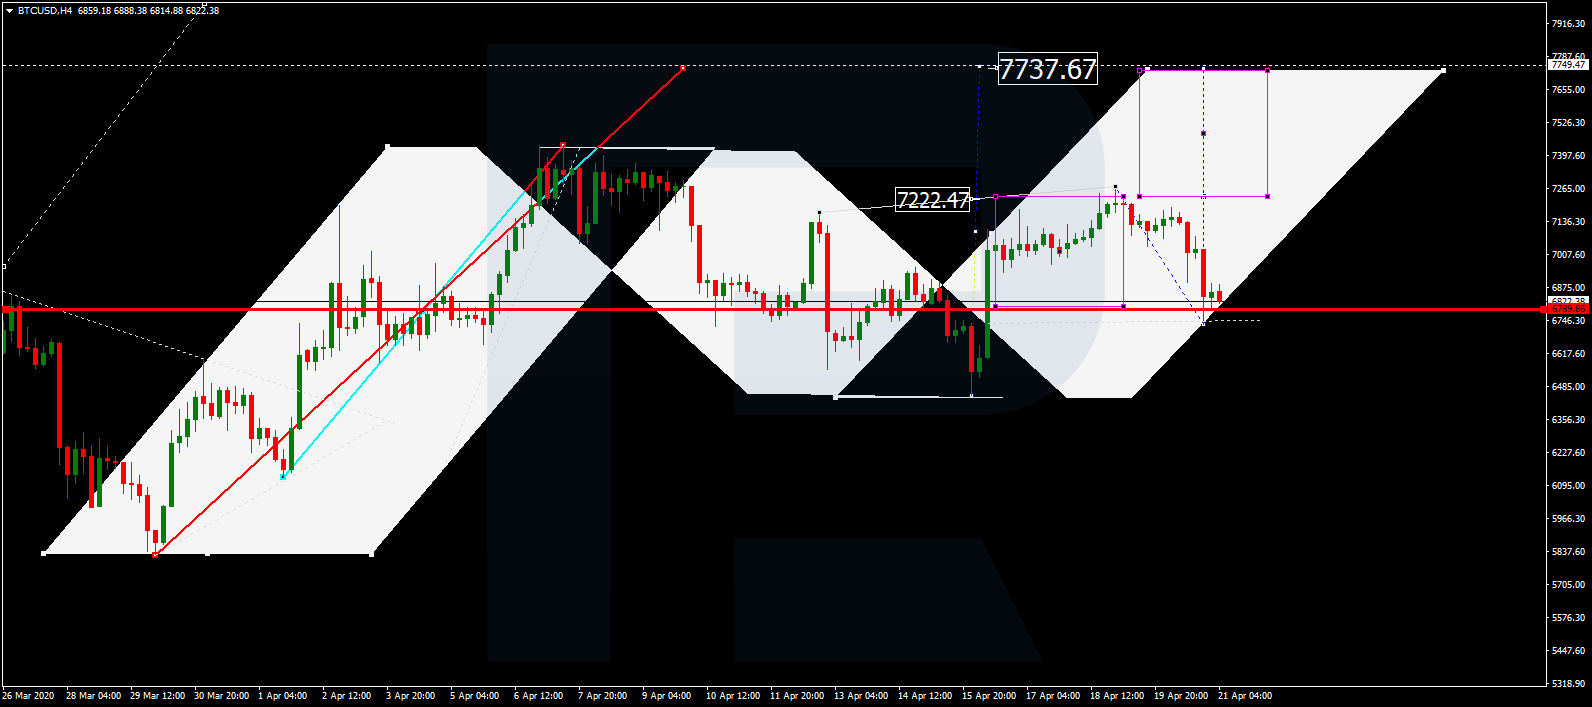
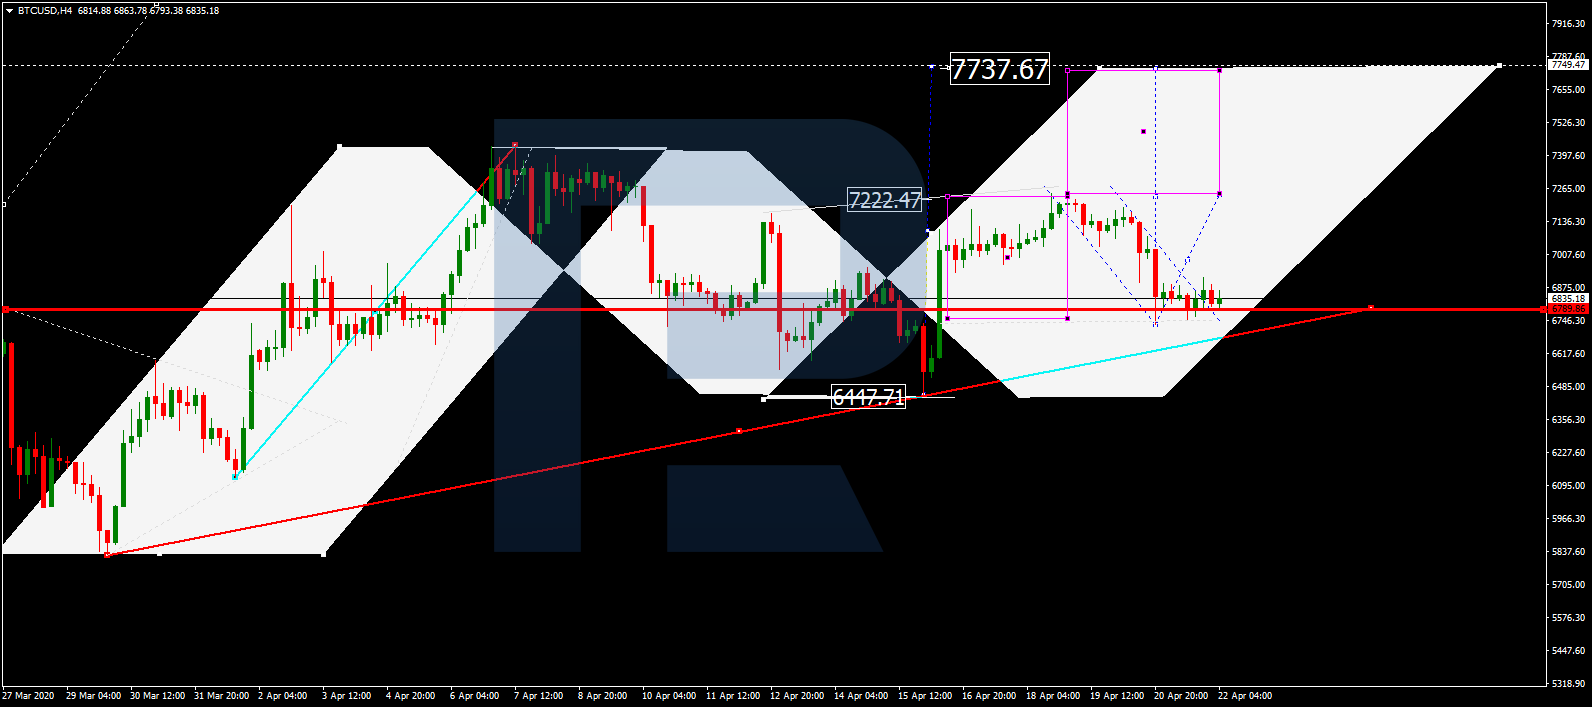
BTCUSD, “Bitcoin vs US Dollar”
BTCUSD is consolidating above 6800.00. According to the main scenario, the price is expected to grow to break 7000.00 and then continue trading upwards with the target at 7700.00. Later, the market may start a new correction to reach 6800.00.
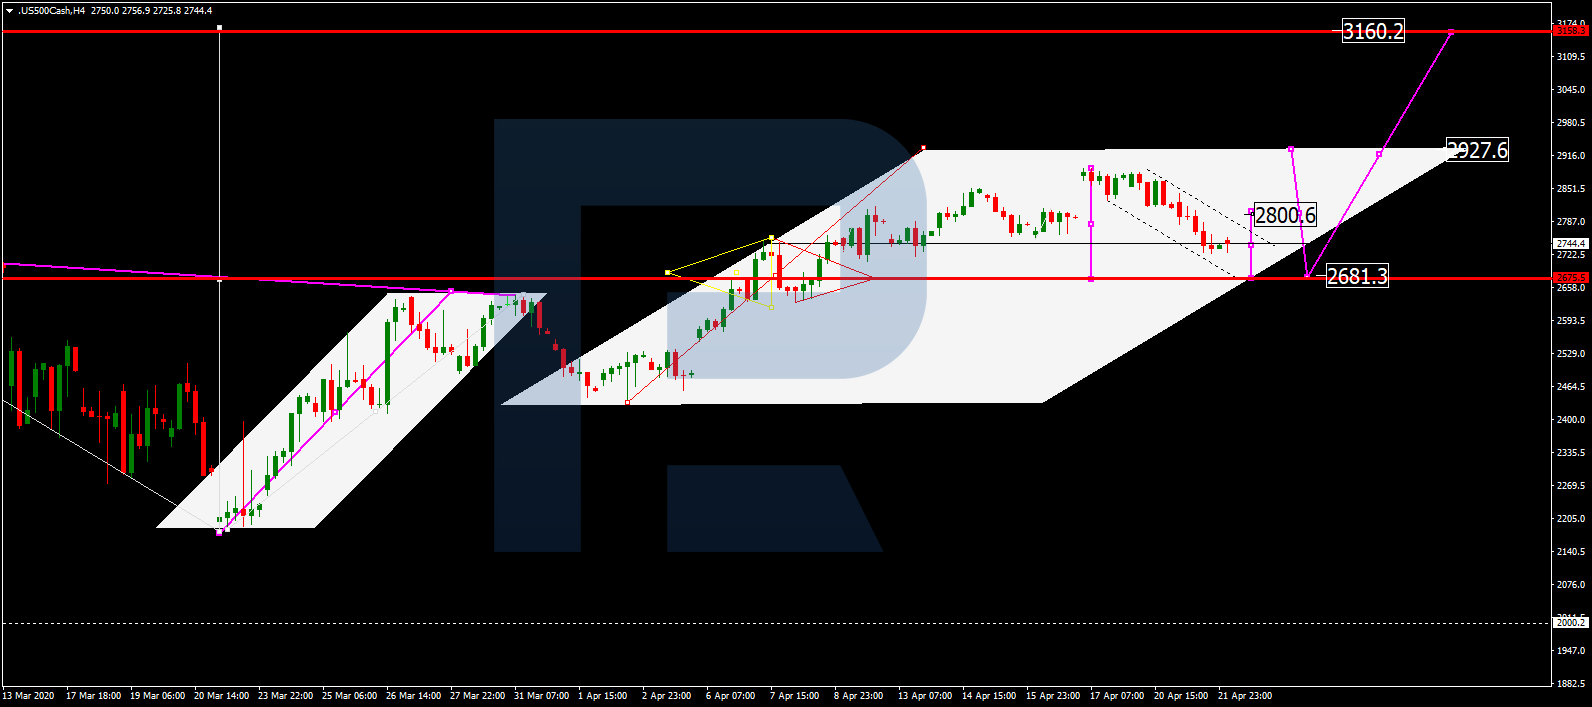
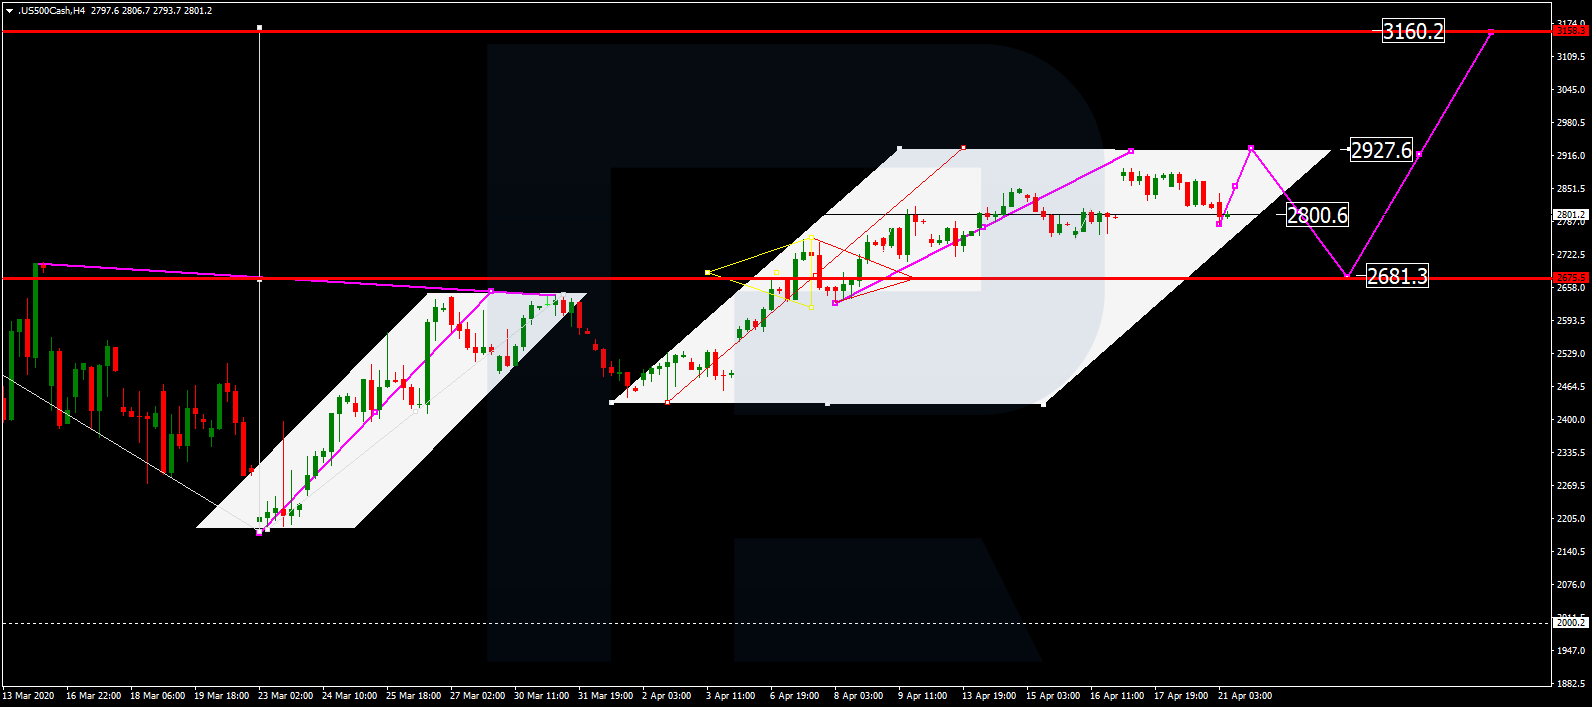
S&P 500
S&P 500 is still correcting. Possibly, the price may form a new descending structure towards 2681.3 and then start another growth to break 2800.5. After that, the instrument may resume trading inside the uptrend with the short-term target at 2927.6.