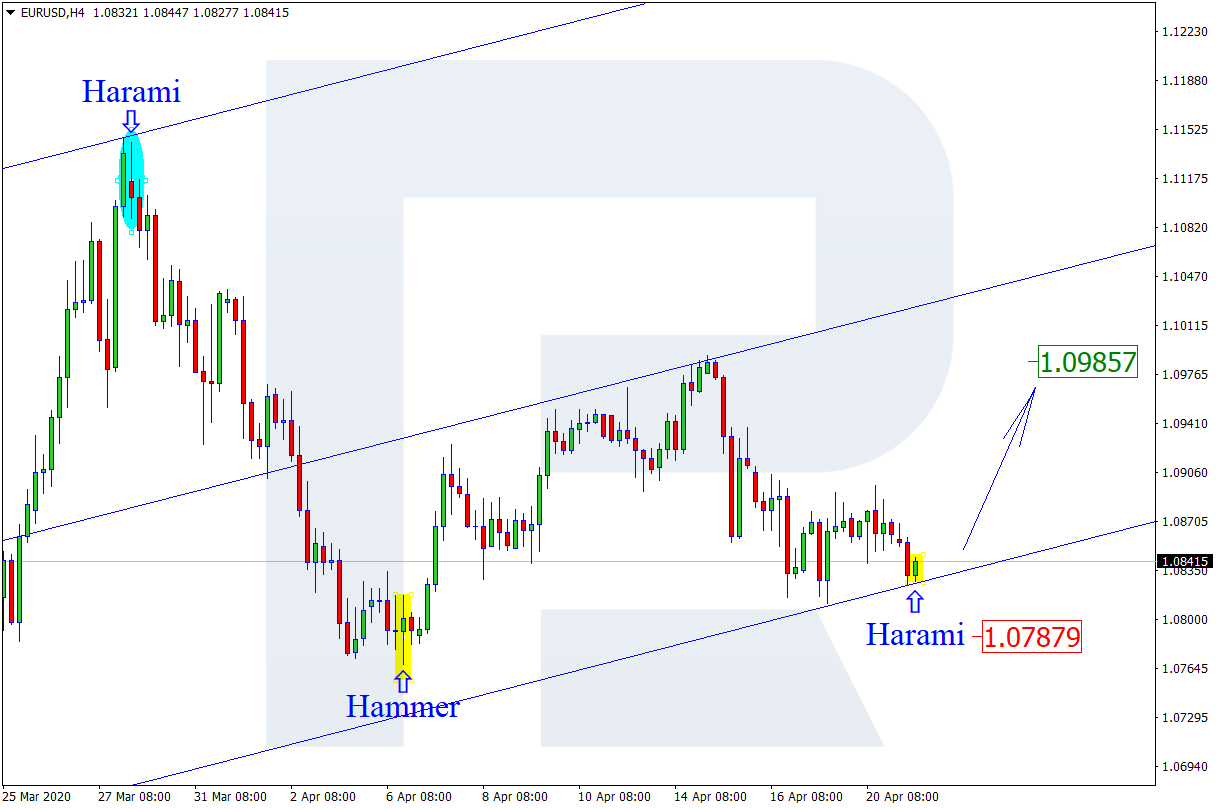
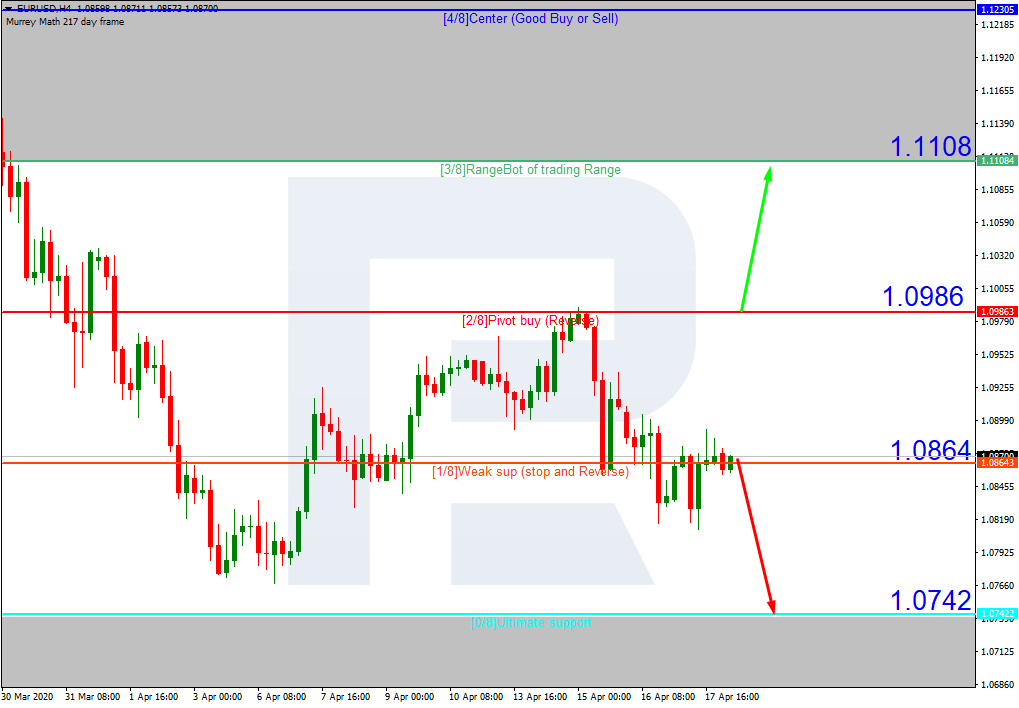
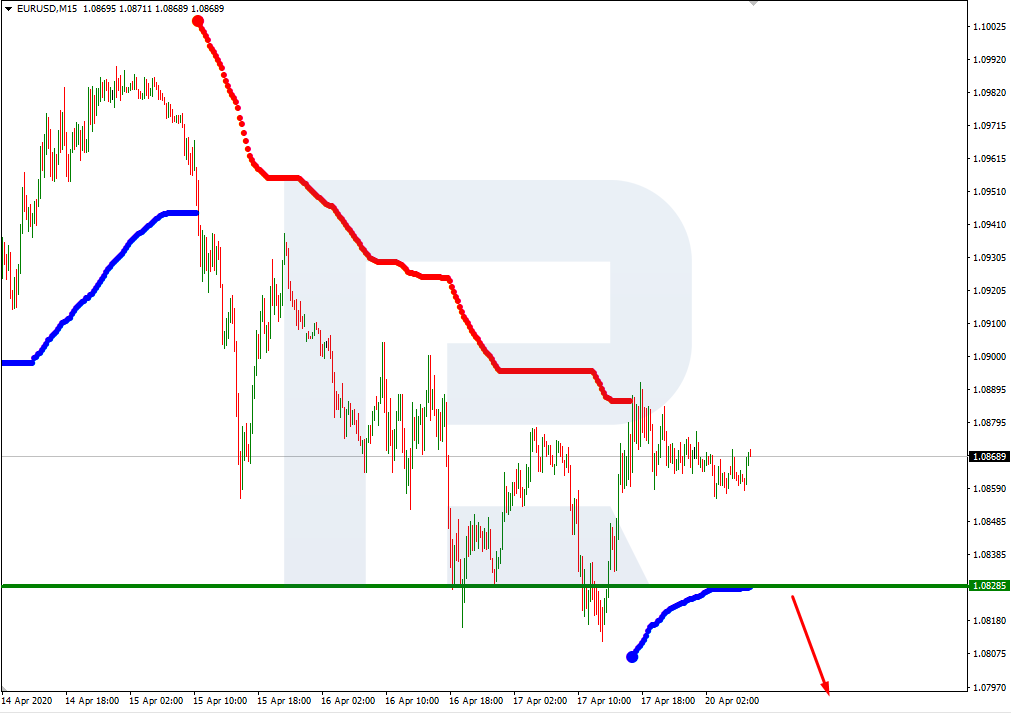
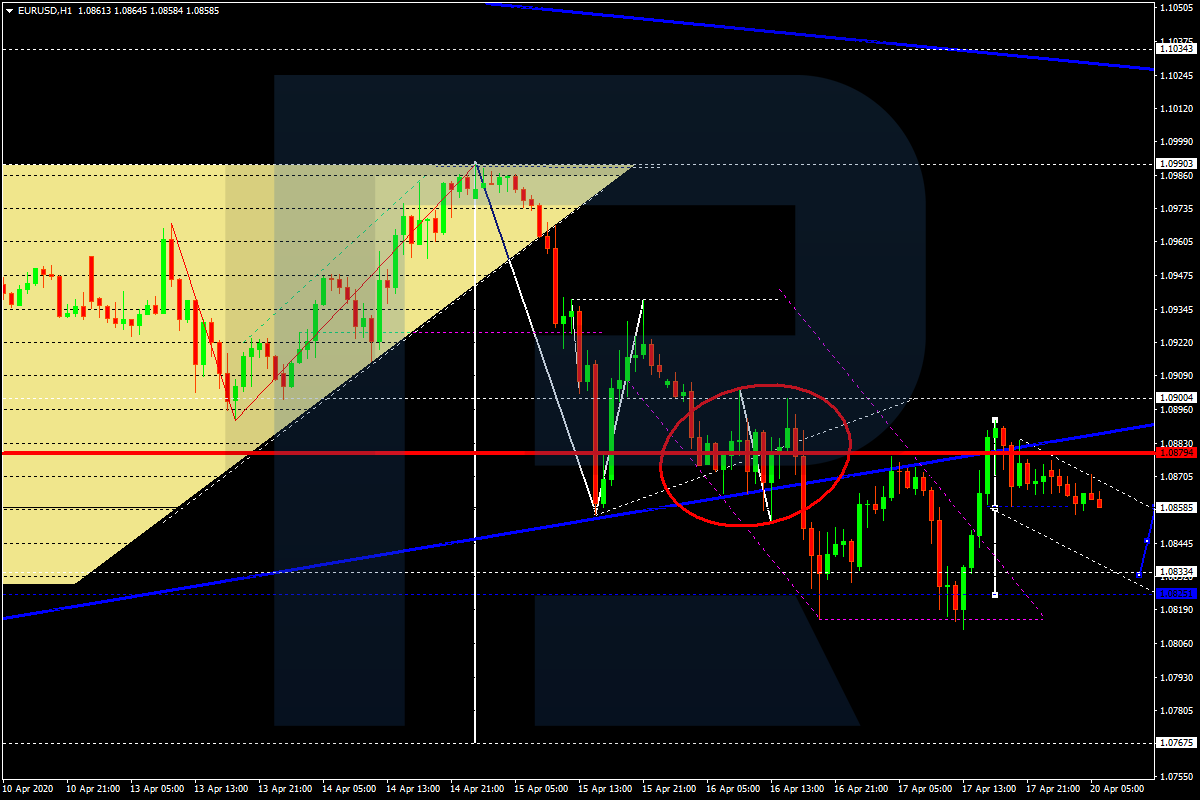
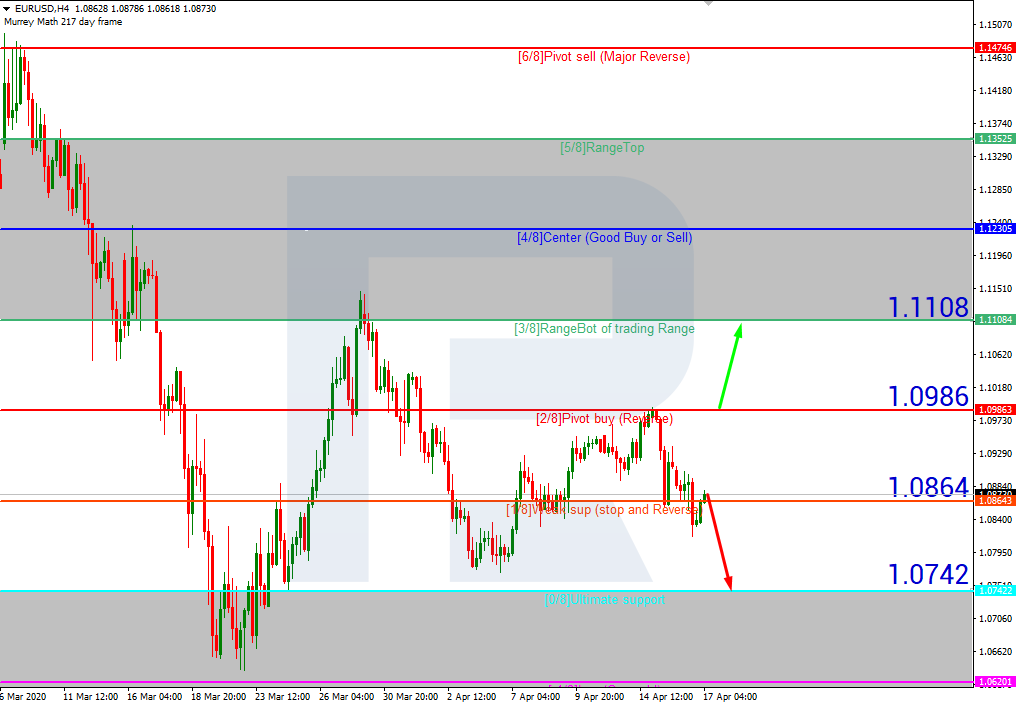
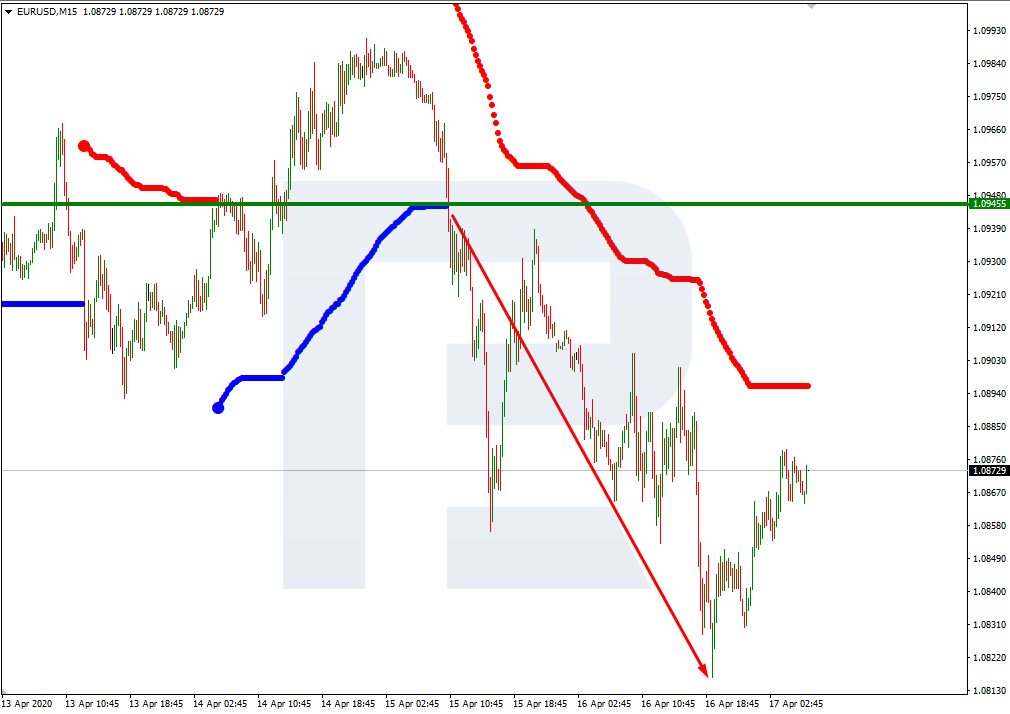
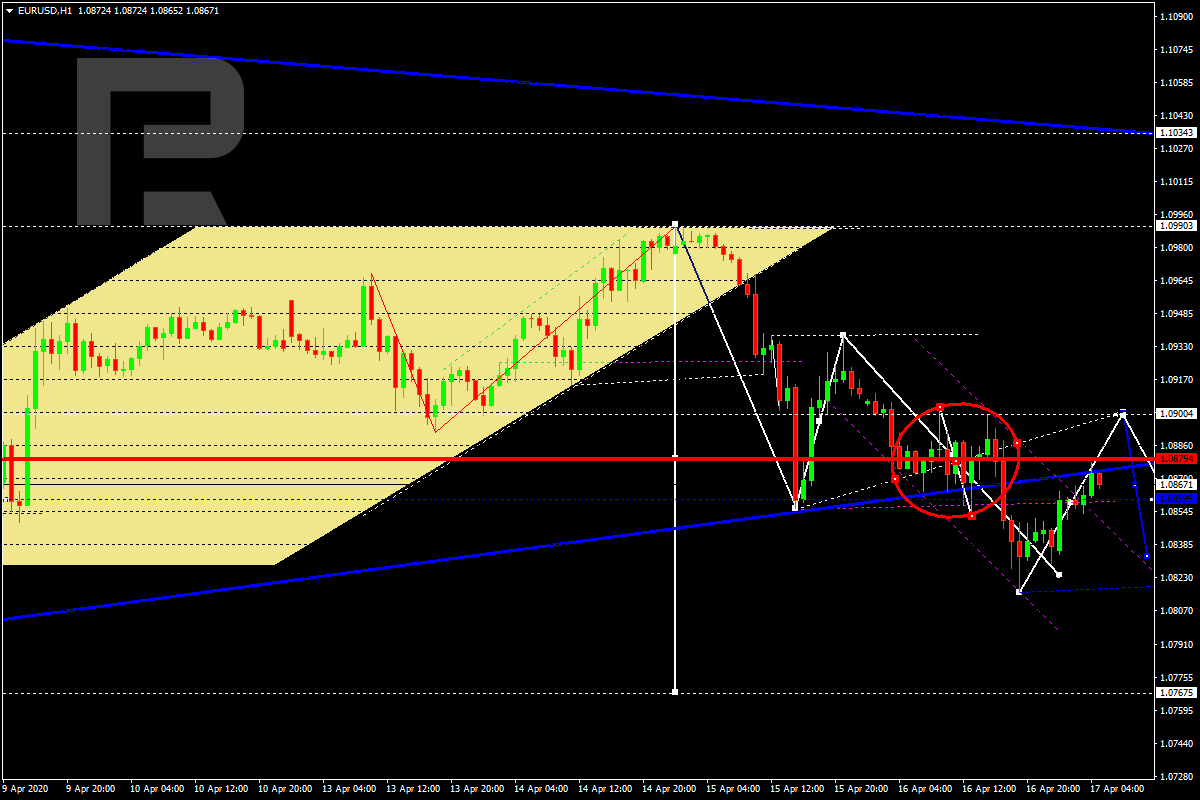
EURUSD, “Euro vs US Dollar”
After finishing another descending impulse at 1.0816, EURUSD is correcting. Possibly, the pair may grow to reach 1.0900 and then move downwards to break 1.0840. Later, the market may continue moving inside the downtrend with the target at 1.0770.

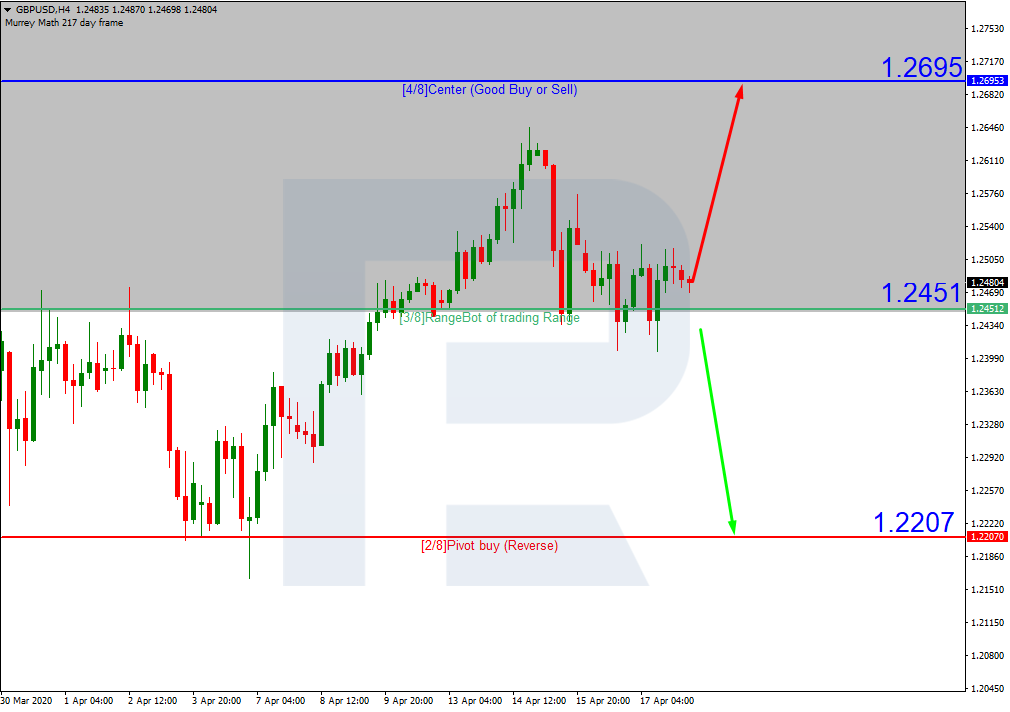
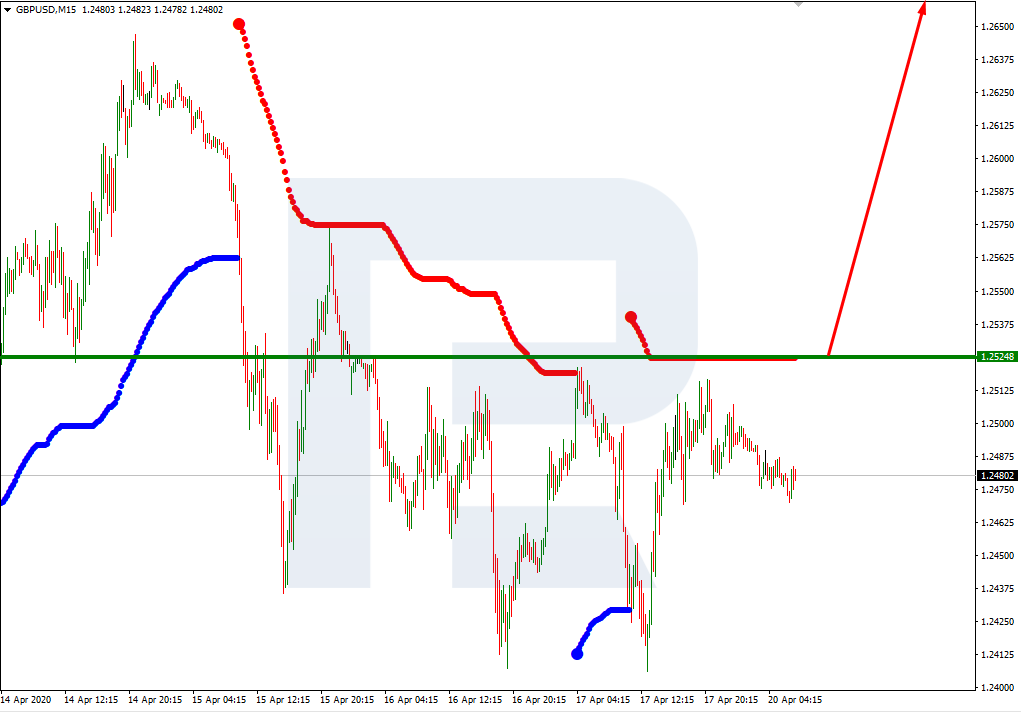
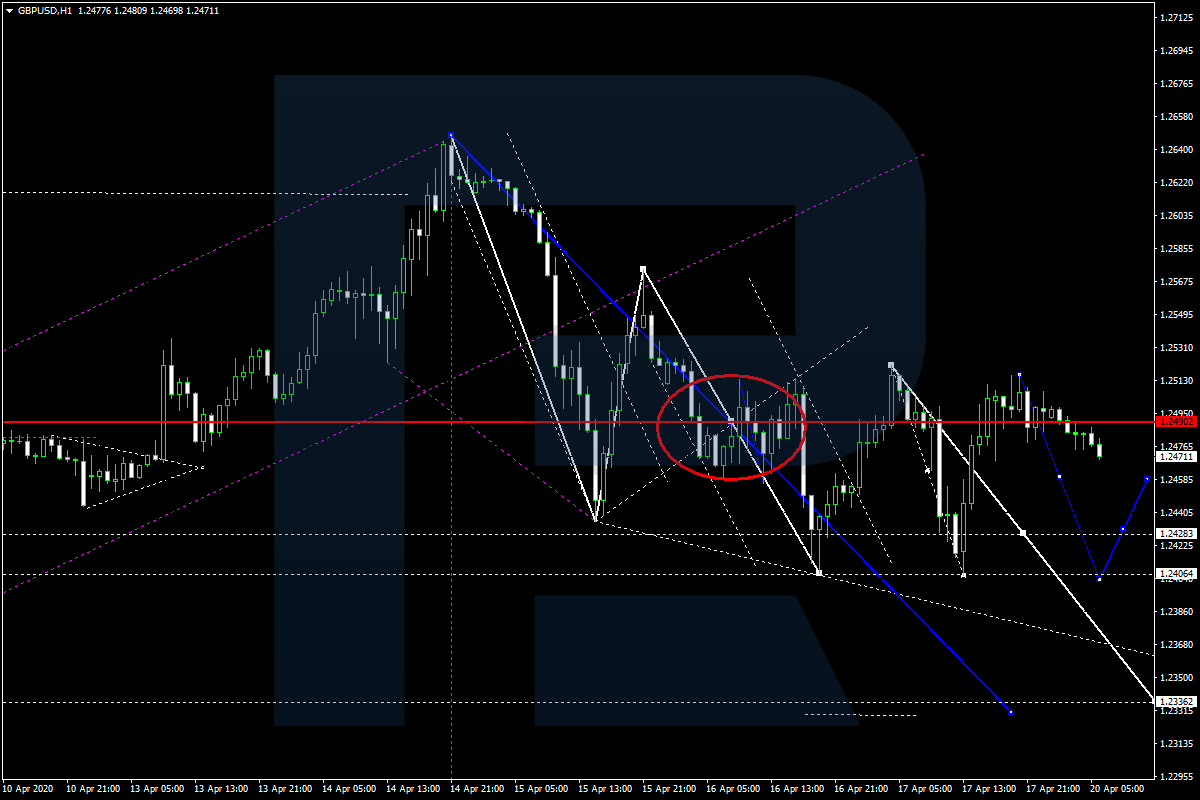
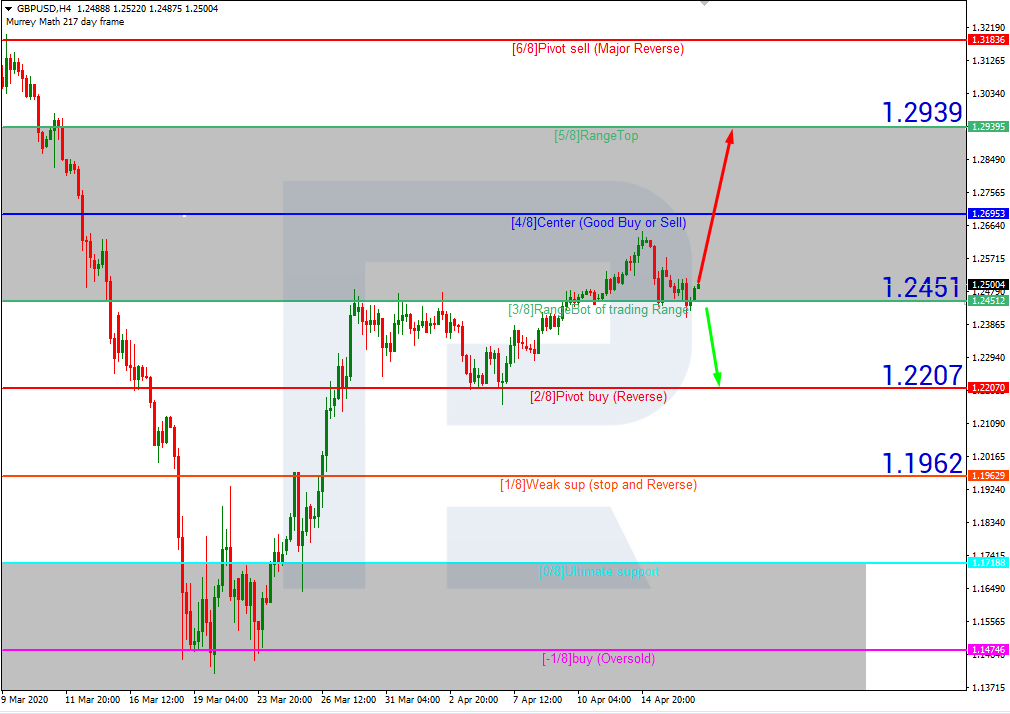
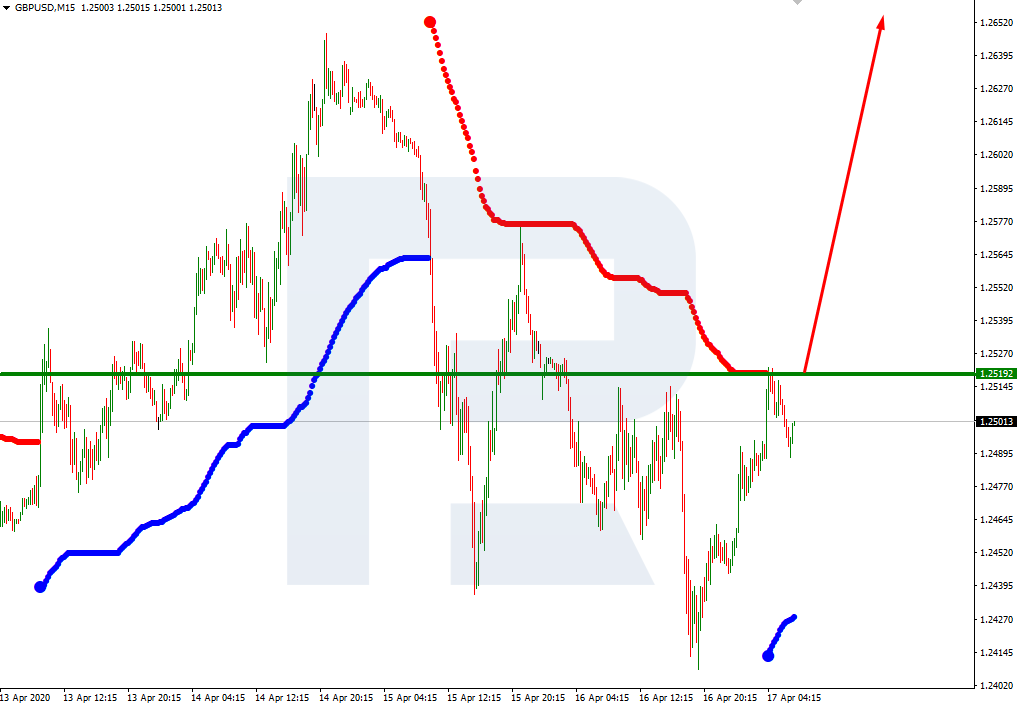
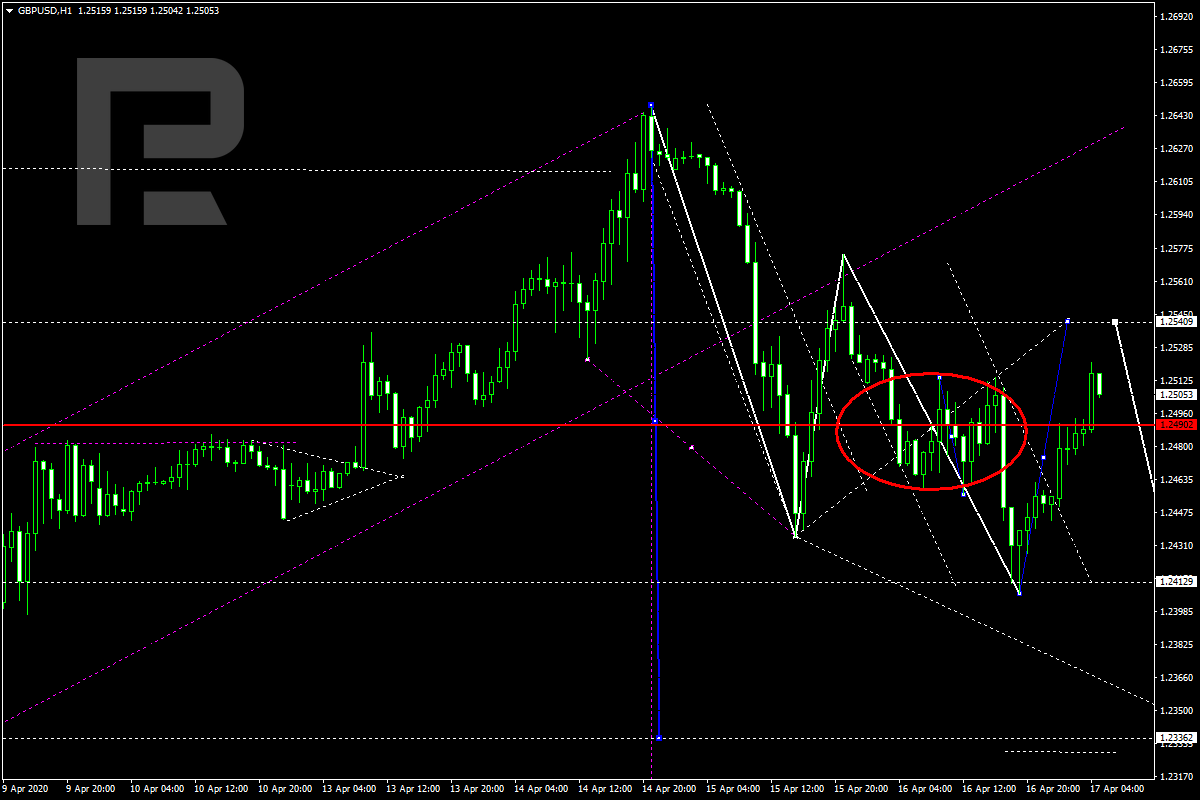
GBPUSD, “Great Britain Pound vs US Dollar”
After completing one more descending impulse at 1.2408, GBPUSD is correcting to reach 1.2540. After that, the instrument may start a new decline to break 1.2440 and then continue trading downwards with the target at 1.2340.
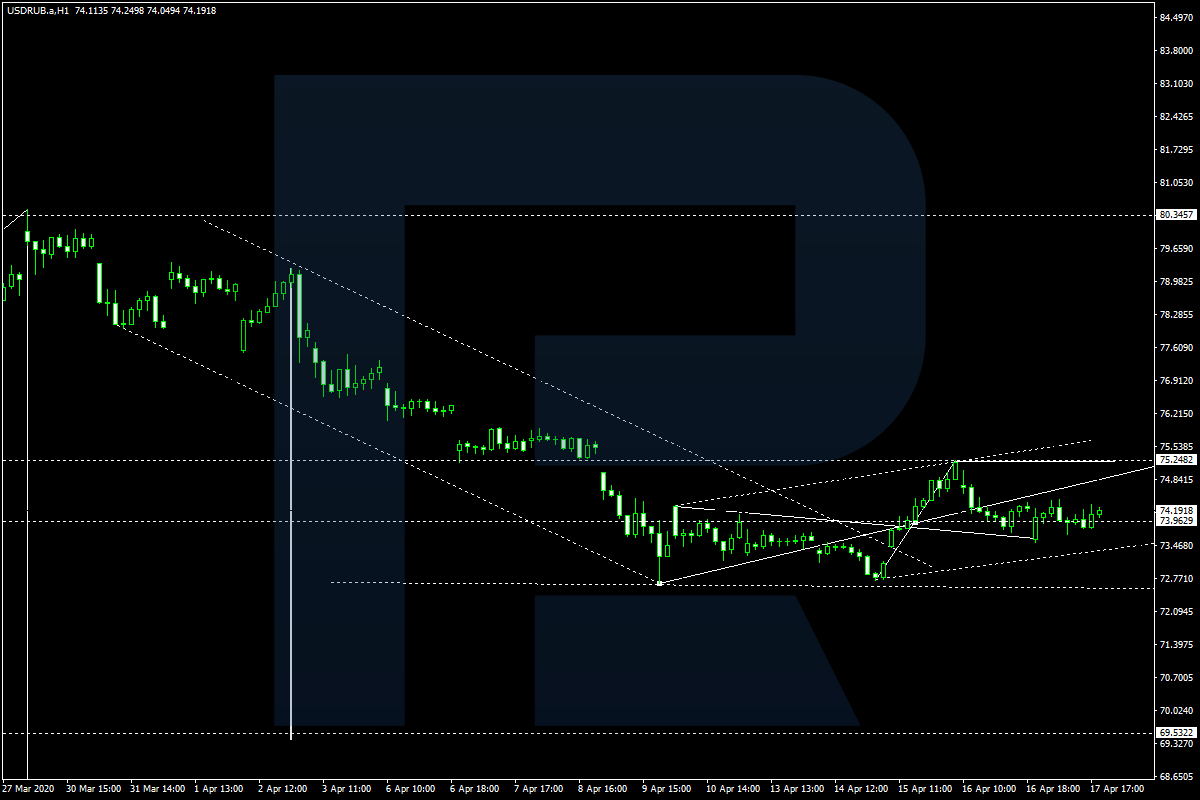
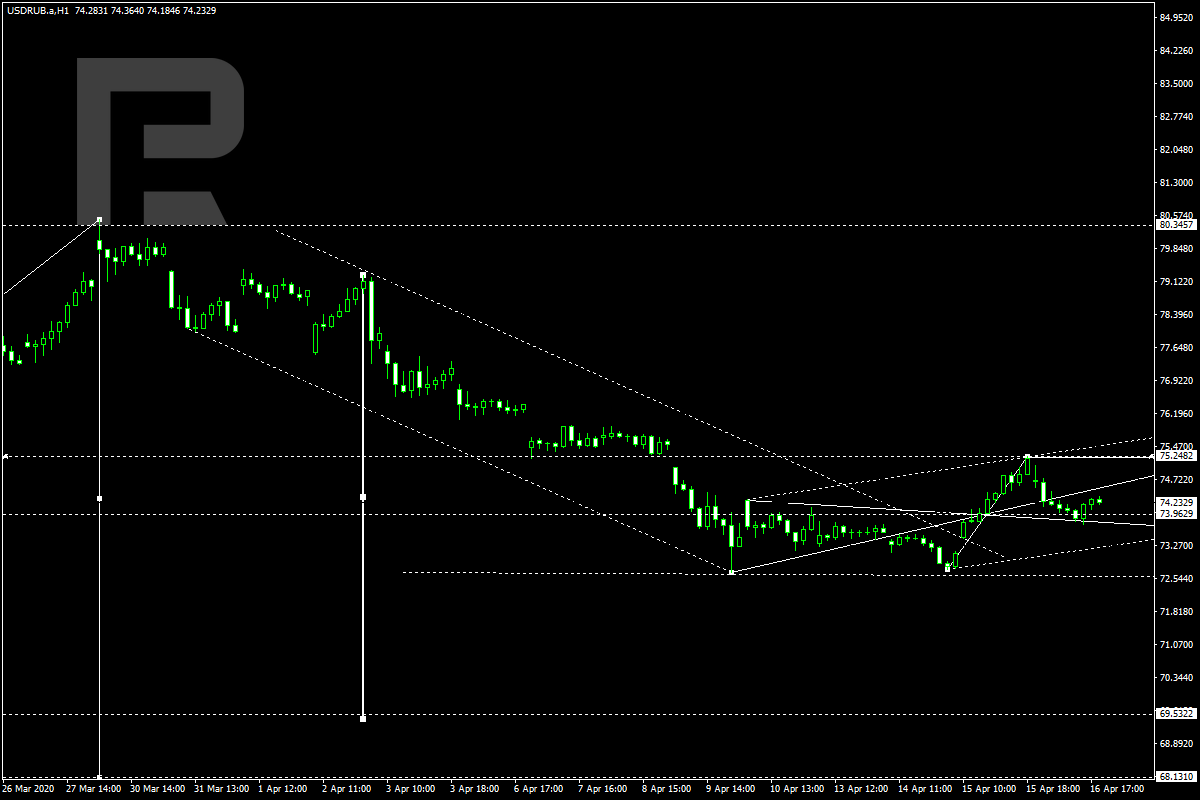
USDRUB, “US Dollar vs Russian Ruble”
USDRUB is still consolidating around 73.90. According to the main scenario, the price is expected to grow towards 75.25 and then resume trading downwards to break 73.15. Later, the market may continue falling with the short-term target at 70.50.
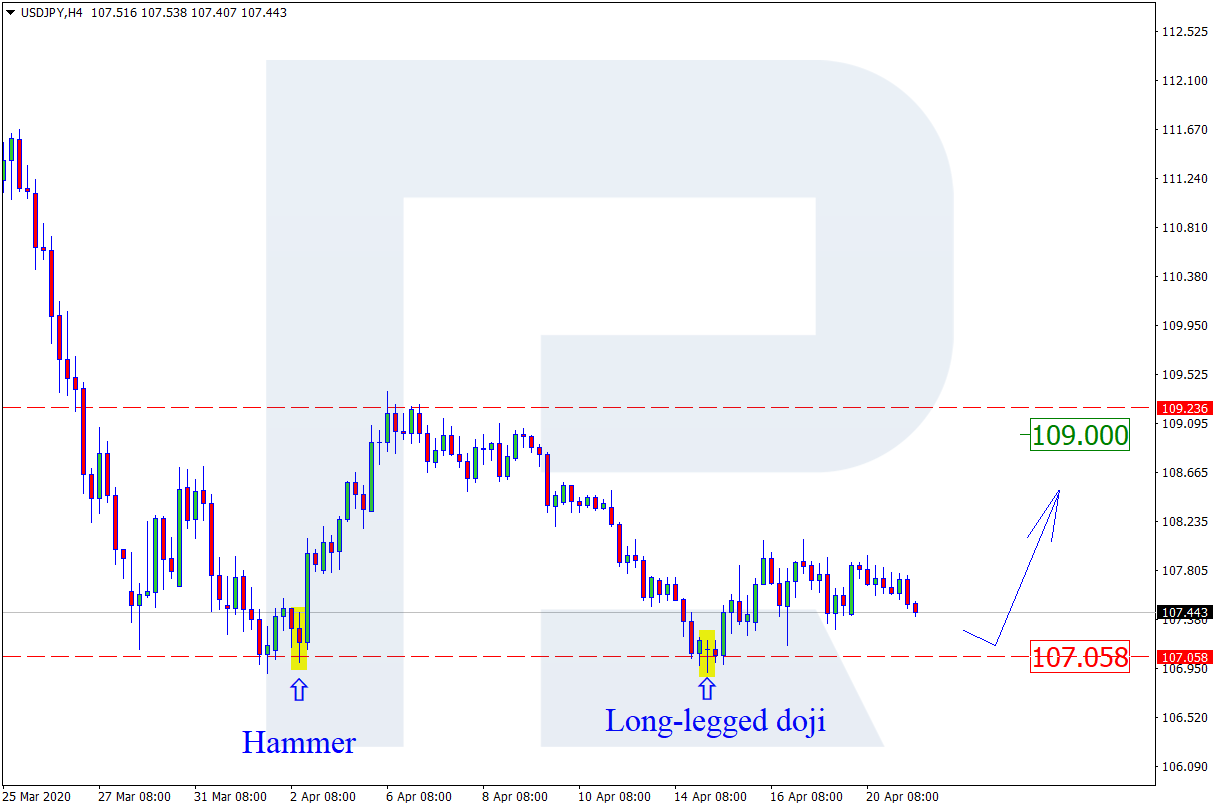
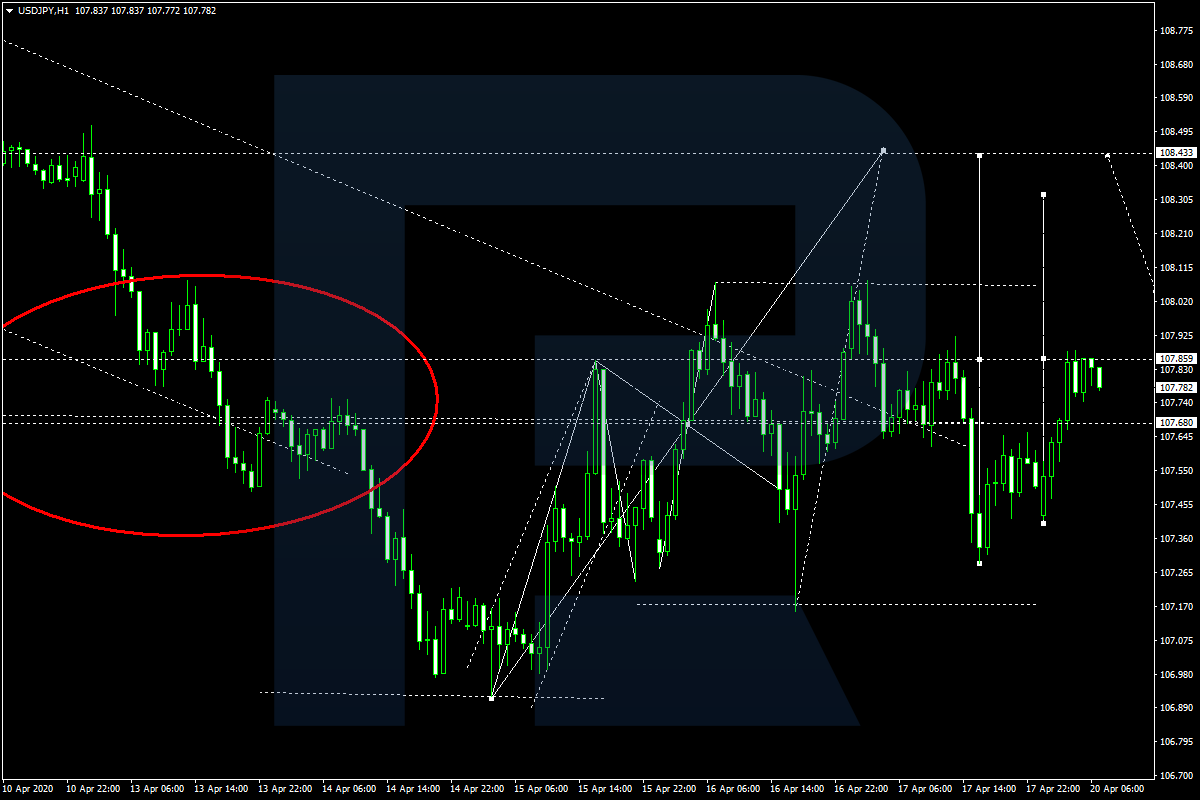
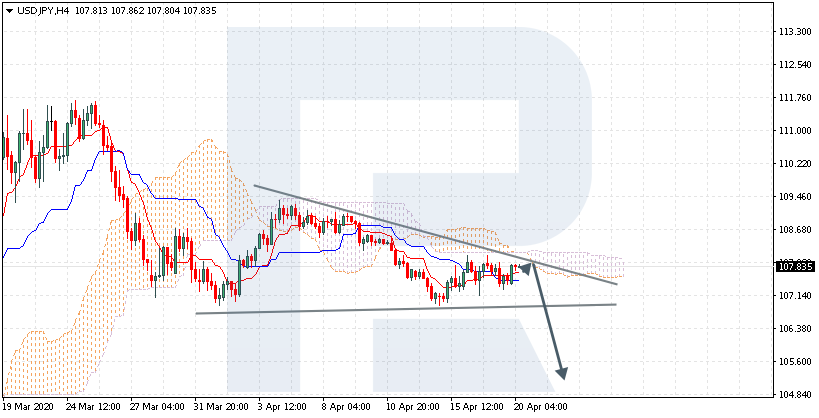
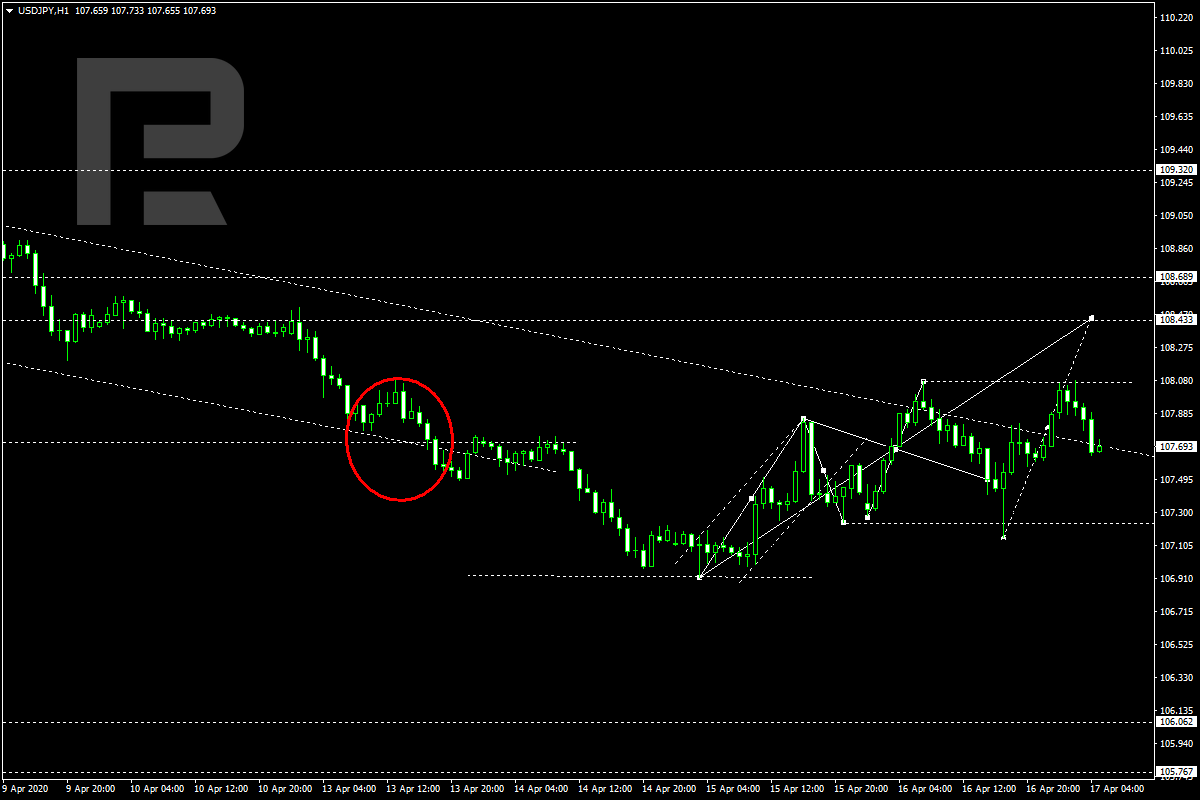
USDJPY, “US Dollar vs Japanese Yen”
USDJPY is consolidating around 107.70. Possibly, the pair may fall to reach 107.20 and then form one more ascending structure with the target at 108.43. After that, the instrument may start another decline to return to 107.70.
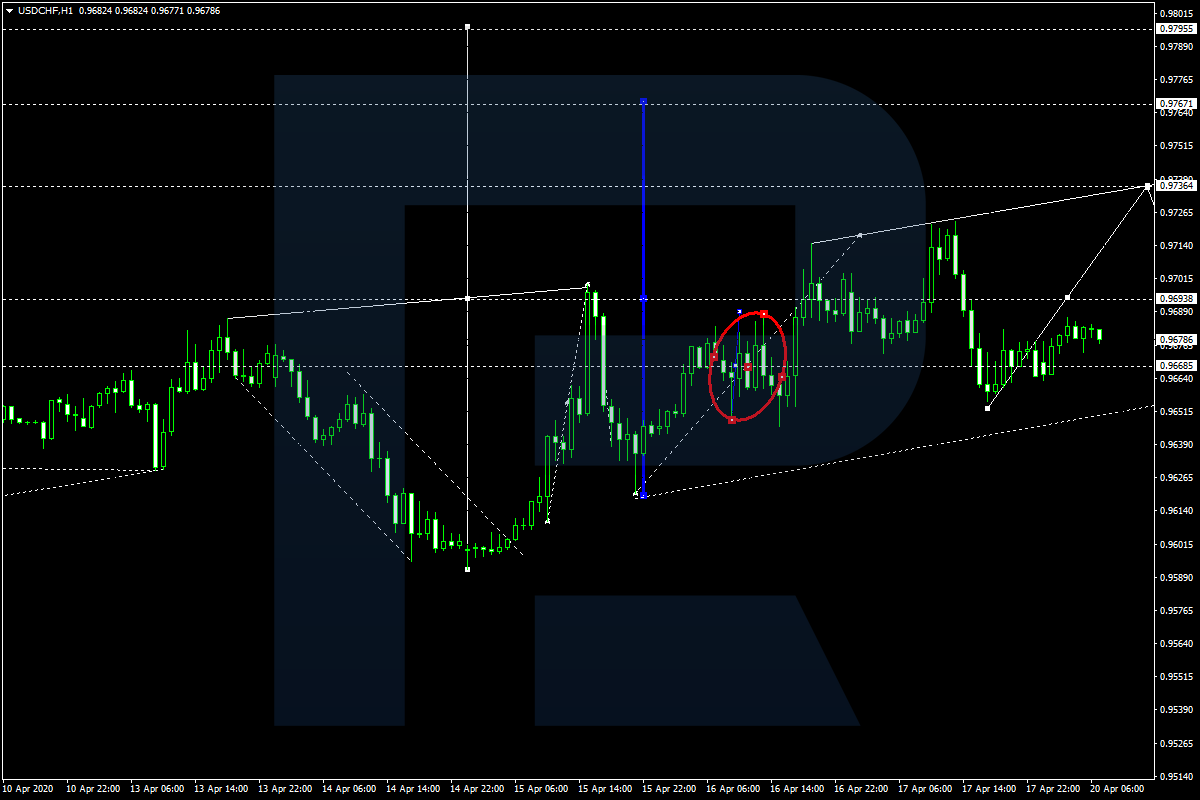
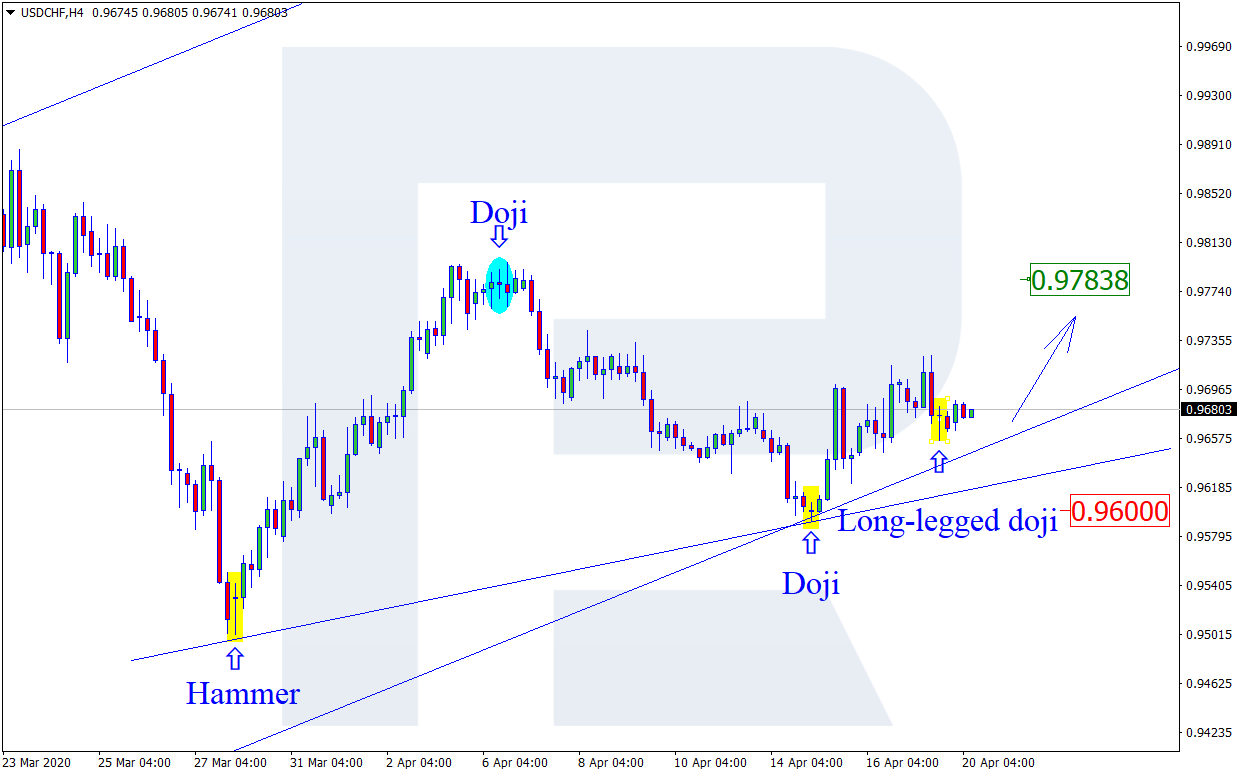
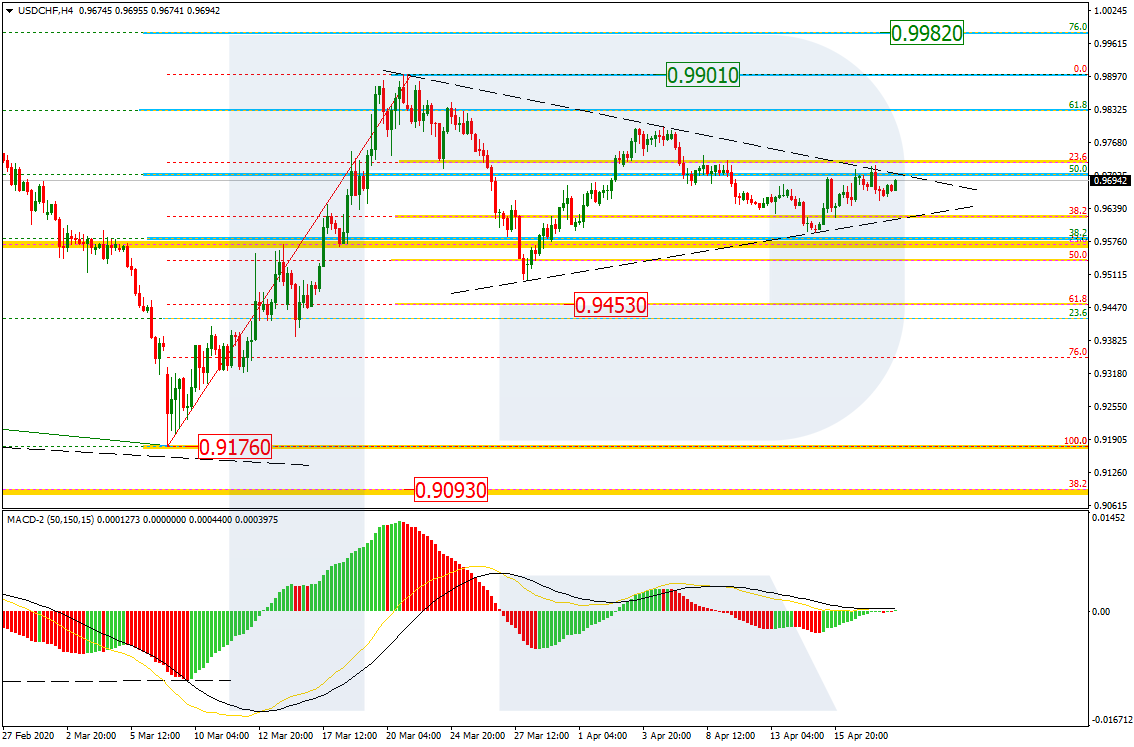
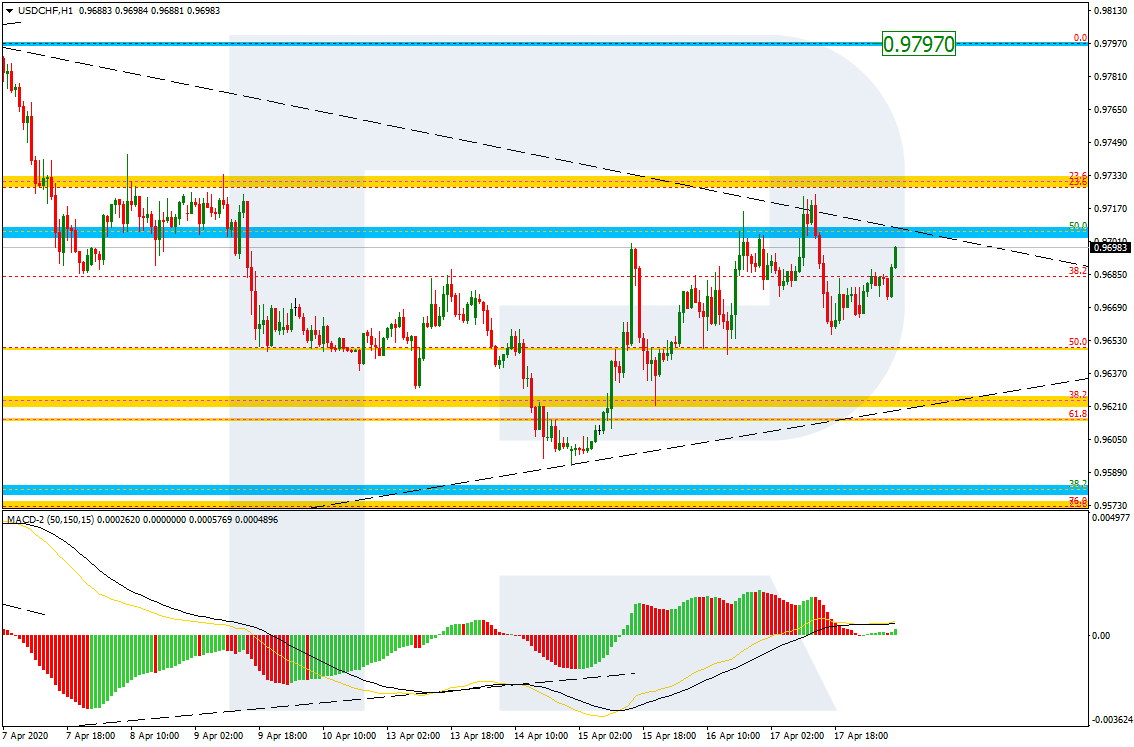
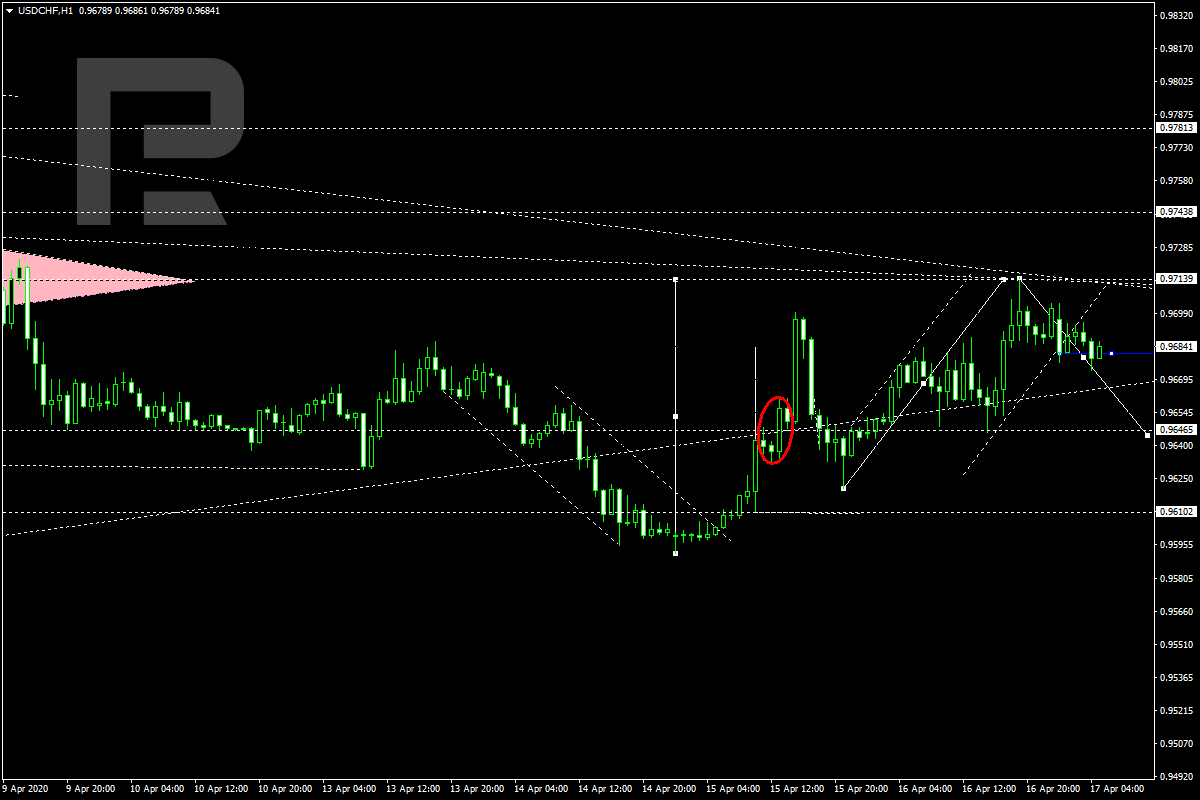
USDCHF, “US Dollar vs Swiss Franc”
USDCHF has completed the ascending wave at 0.9714. Today, the pair may correct towards 0.9646 ad then grow to reach 0.9694. Later, the market may break this level to the upside and resume trading upwards with the target at 0.9740.
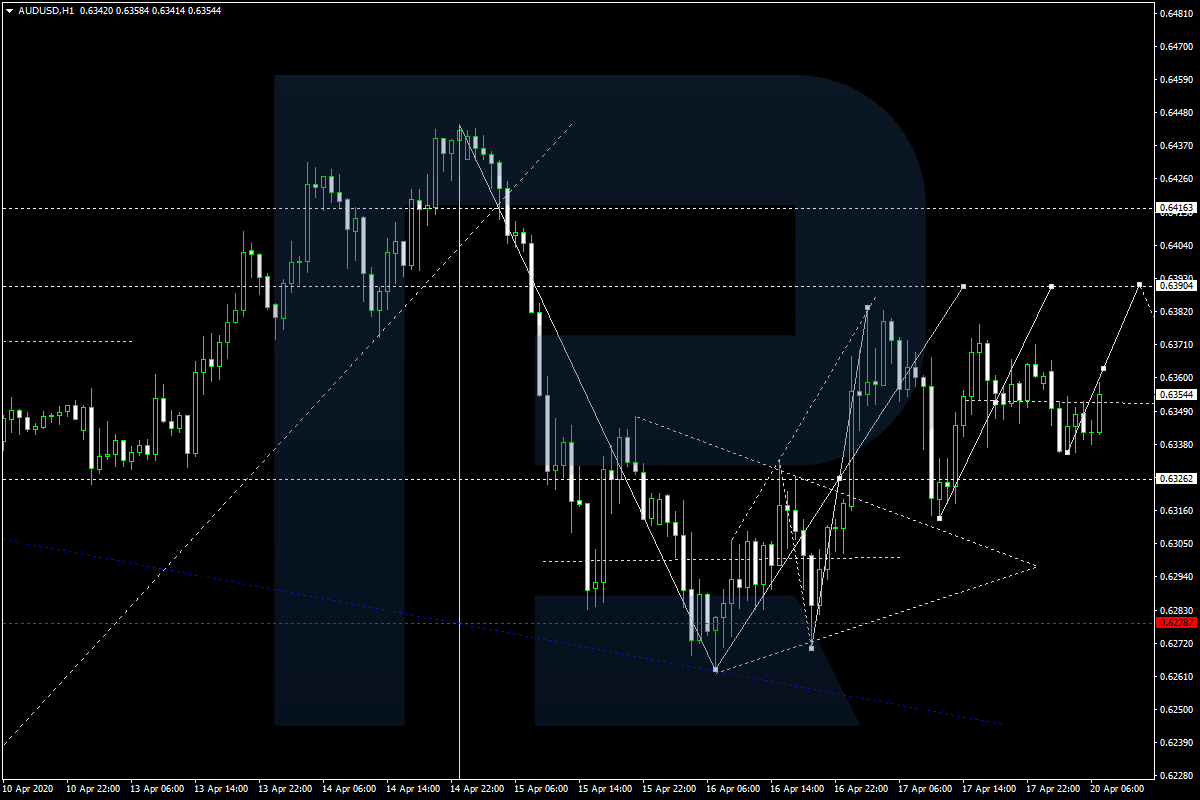
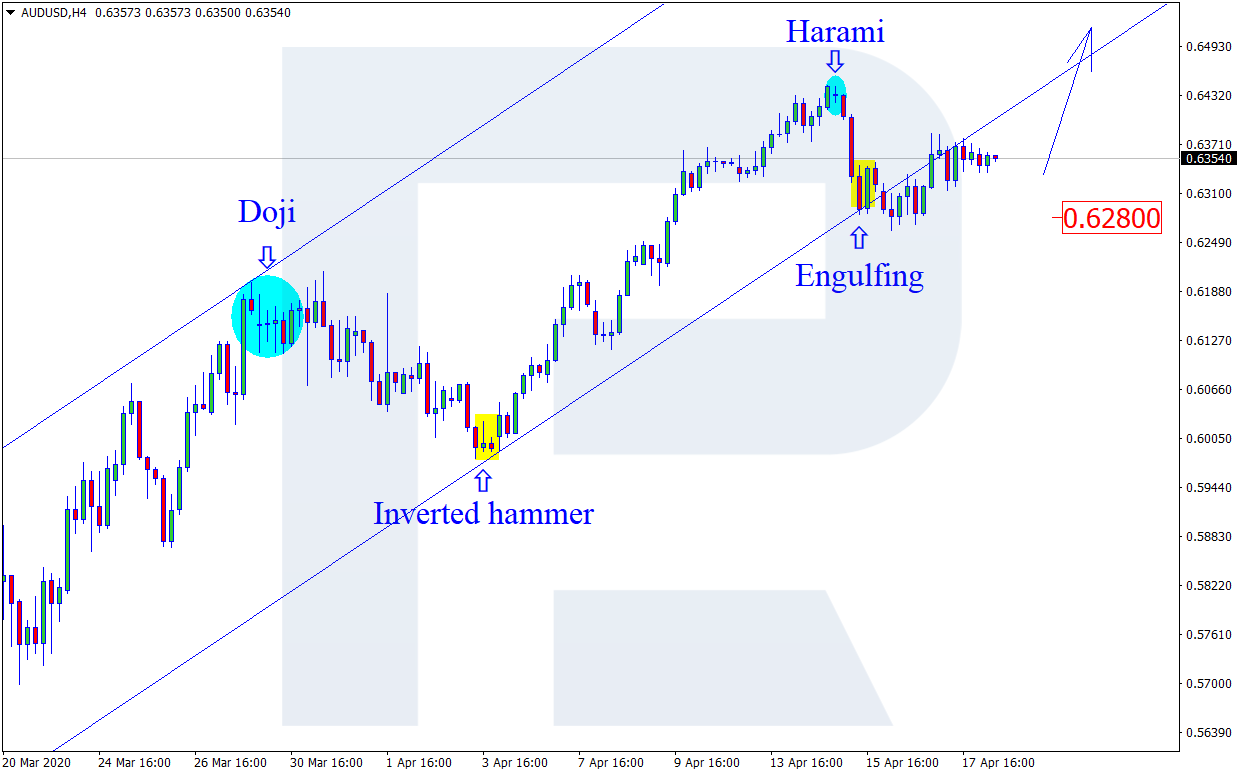
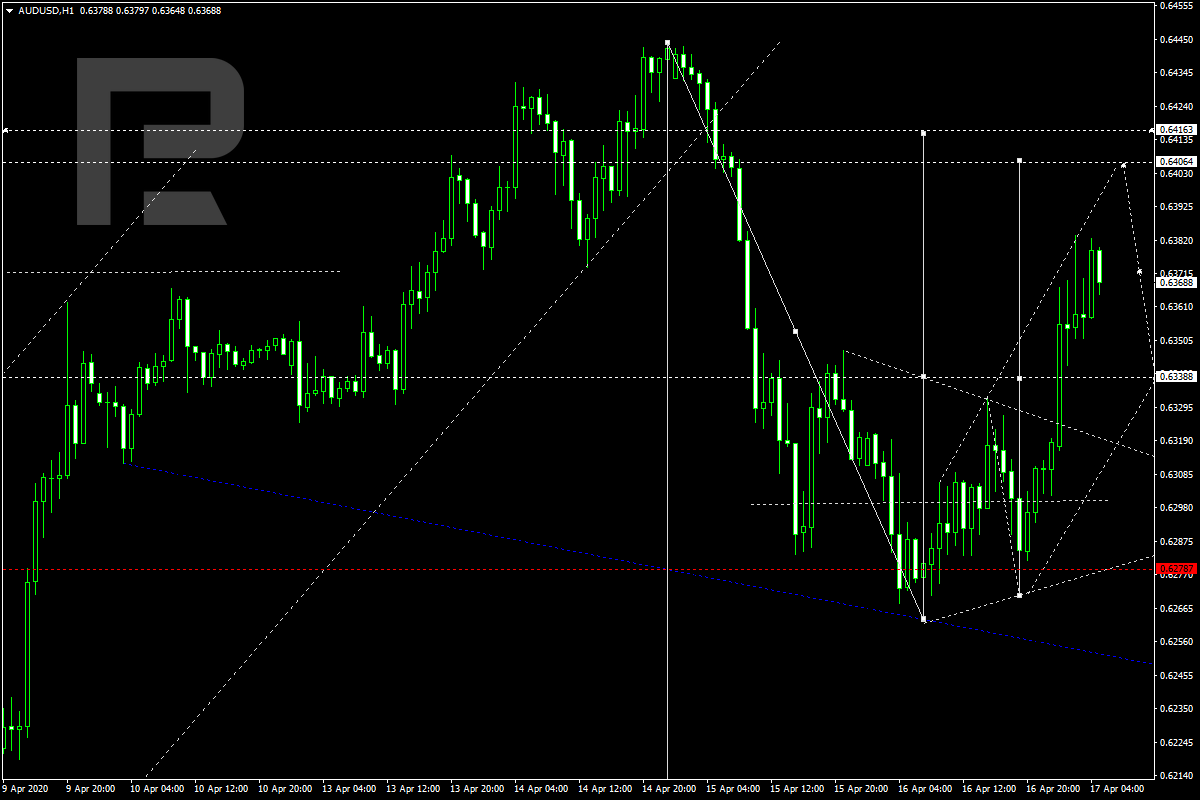
AUDUSD, “Australian Dollar vs US Dollar”
After forming the consolidation range below 0.6330 and breaking this level to the upside, AUDUSD is expected to form one more ascending structure towards 0.6400. After that, the instrument may resume falling to return to 0.6330 and then start another growth to reach 0.6416. Later, the market may resume trading downwards with the target at 0.6344.
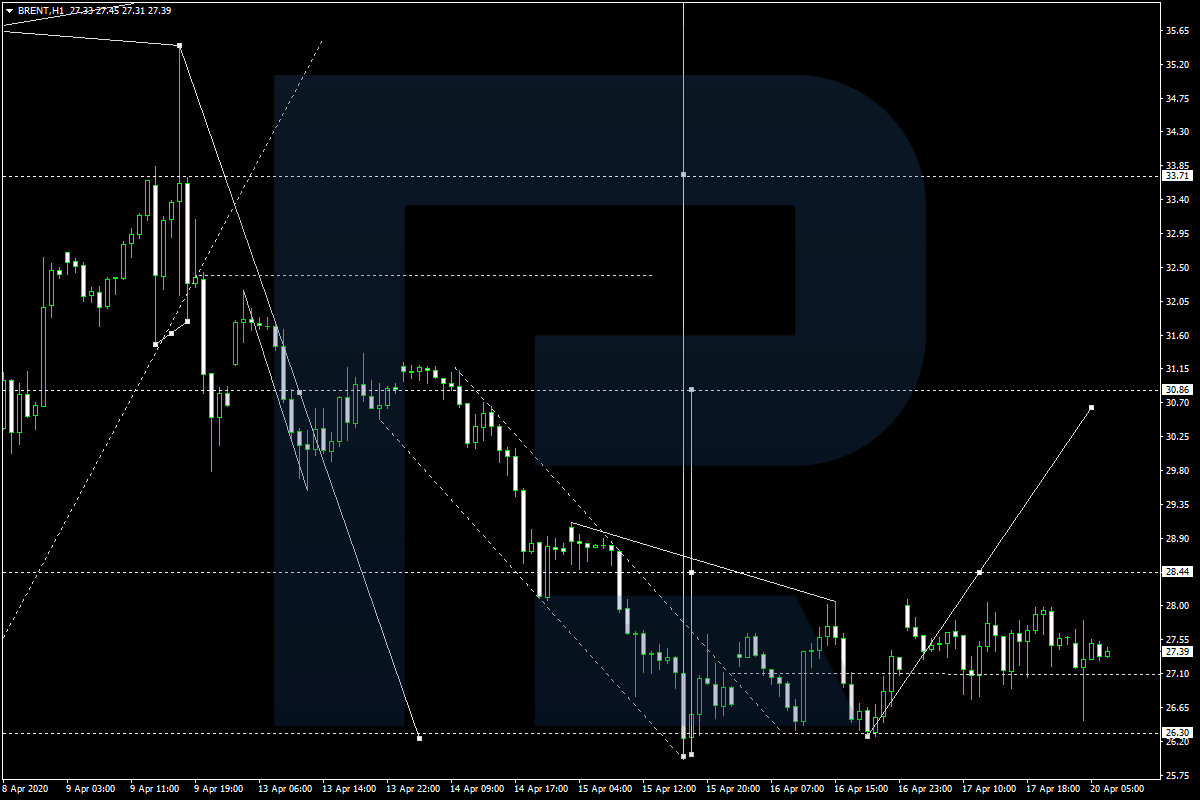
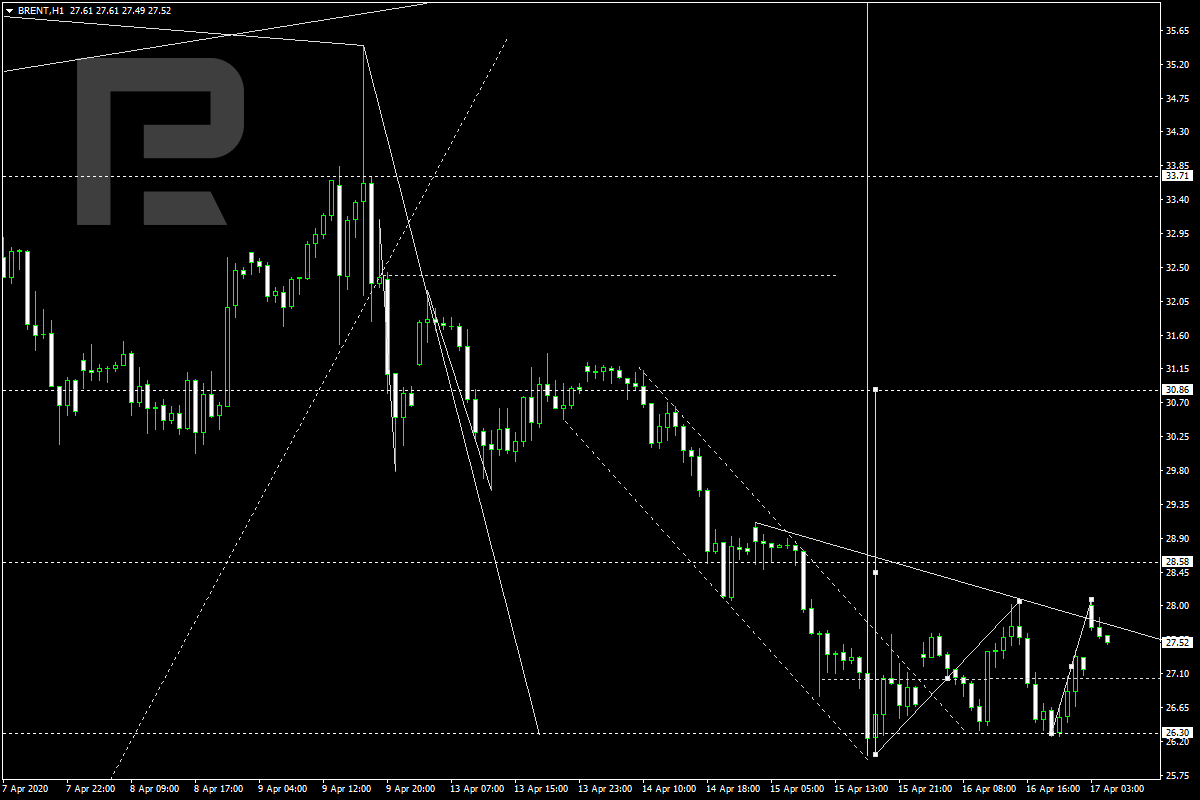
BRENT
Brent is consolidating around 27.00; after attempting to break the upside border, it is expected to fall and test 27.00 from above. If the price forms one more ascending structure towards 38.10 and breaks it to the upside, the market may continue to grow with the first target at 30.86
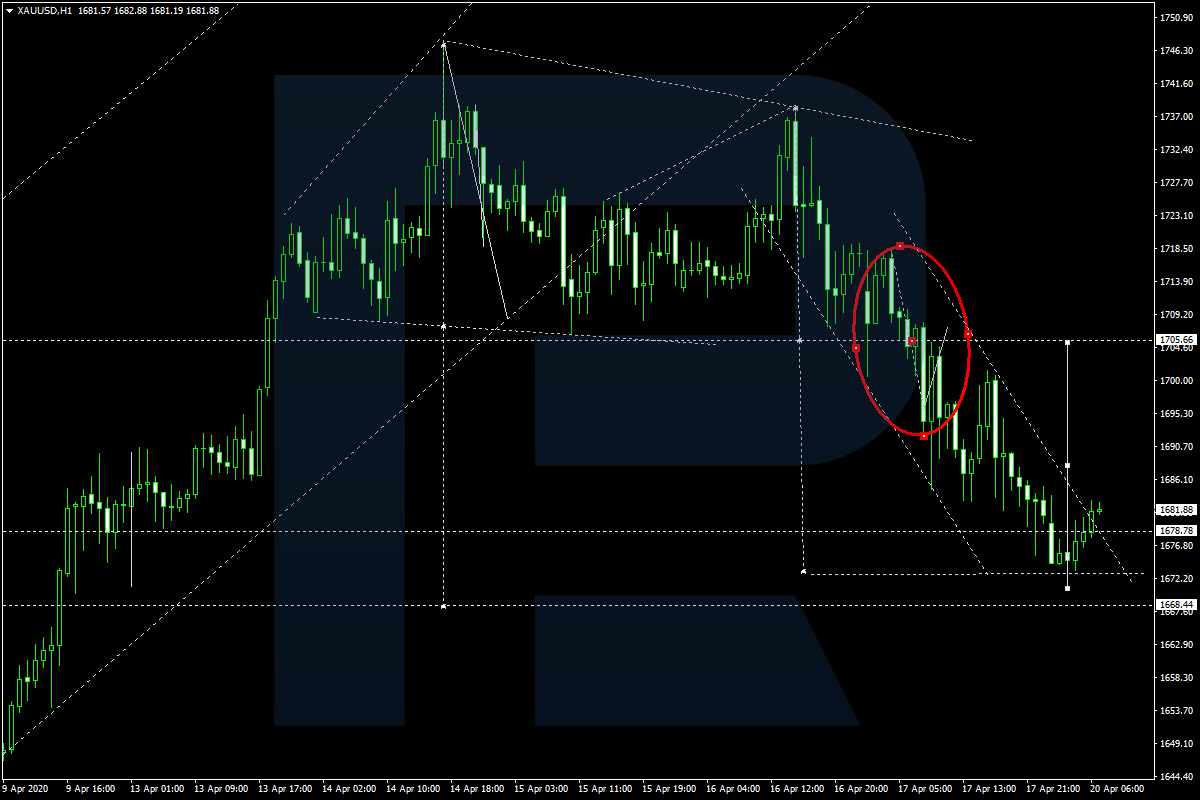
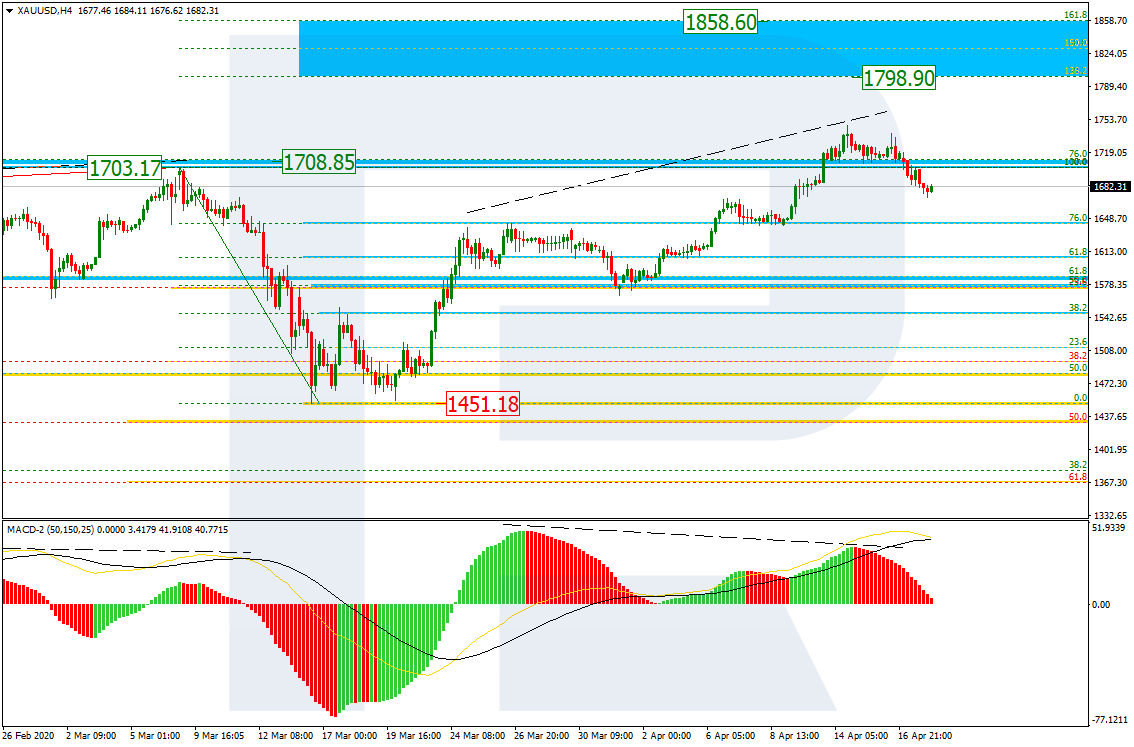
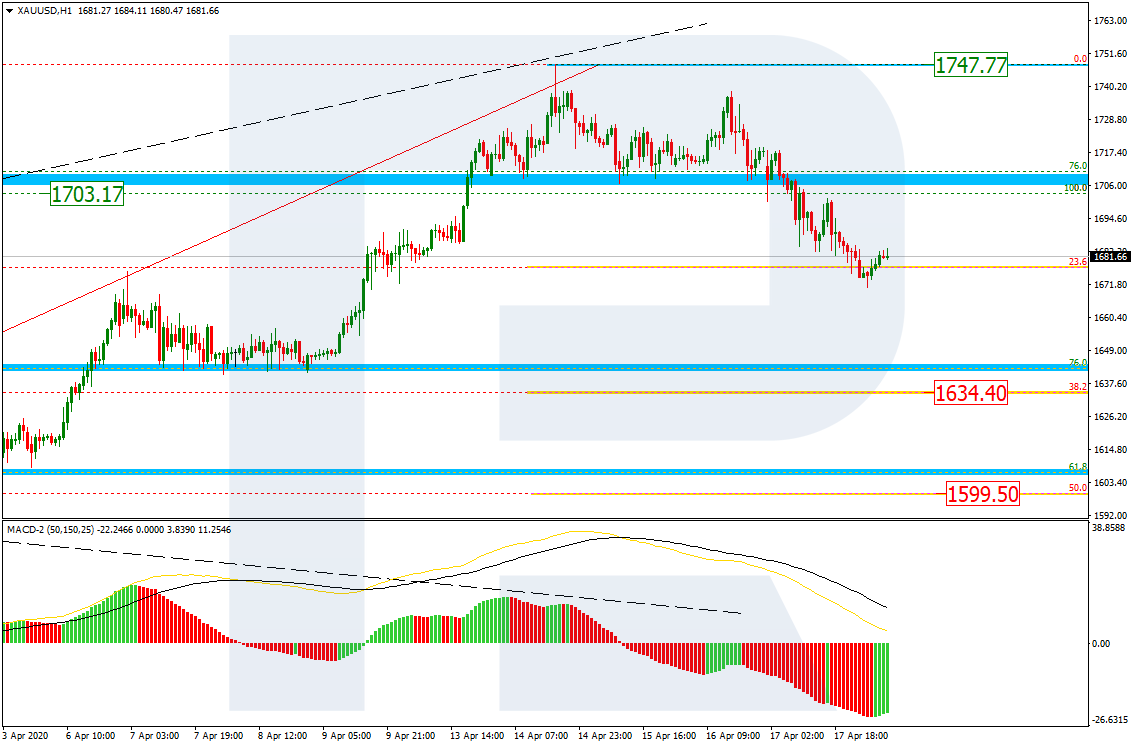
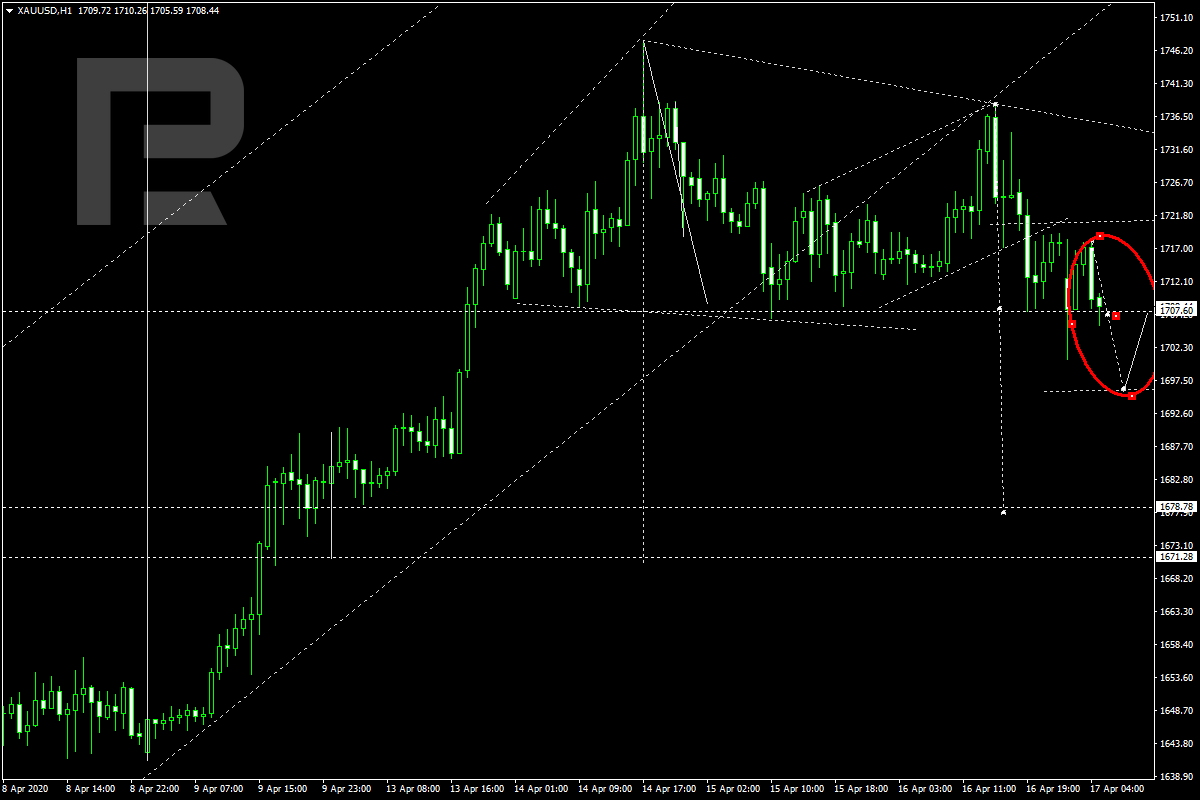
XAUUSD, “Gold vs US Dollar”
Gold has completed another descending wave at 1707.60; right now, it is consolidating below this level. Possibly, today the pair may break 1707.60 to the downside and resume falling towards 1678.78. After that, the instrument may resume trading inside the uptrend to test 1707.00 from below.
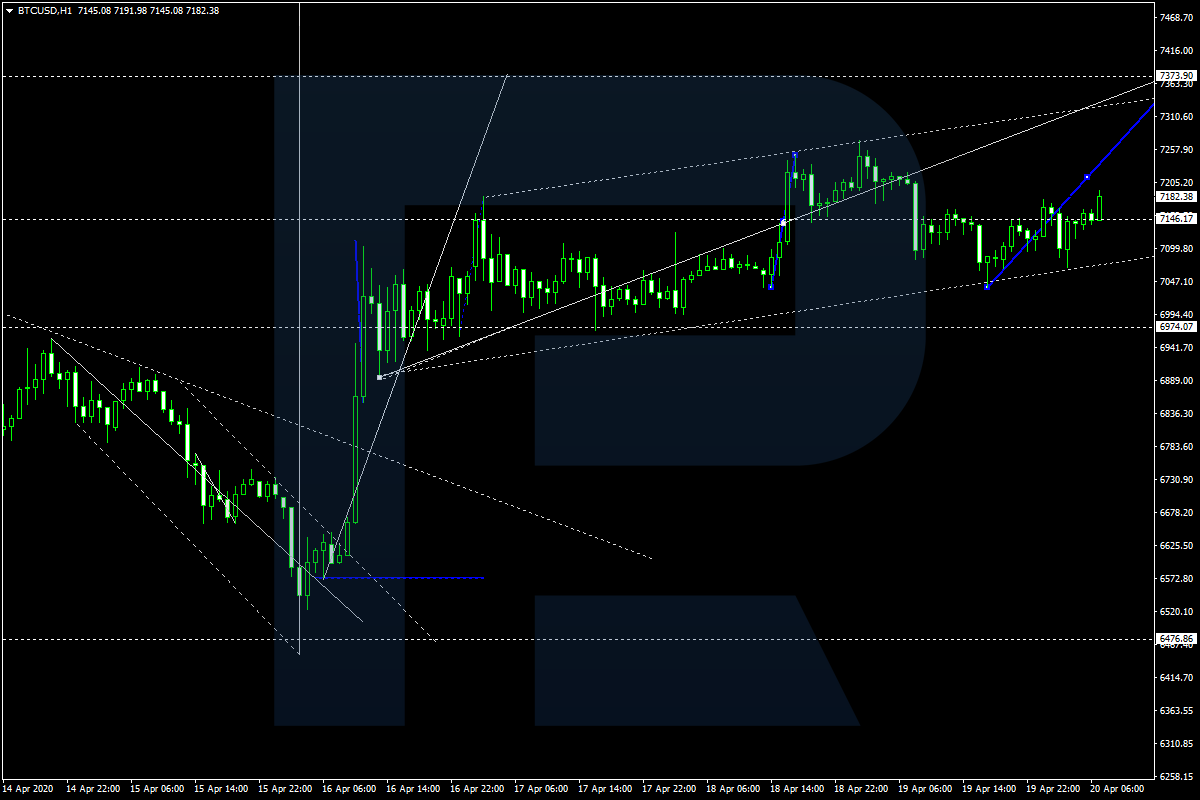
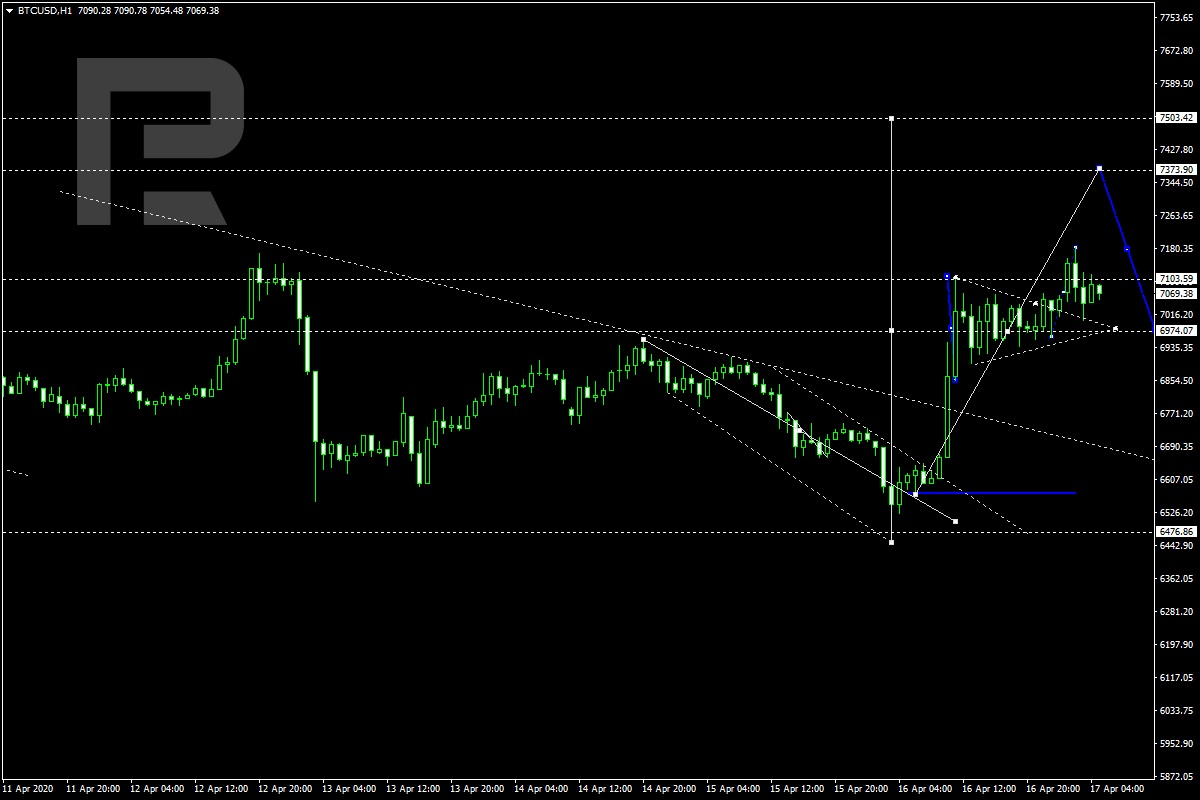
BTCUSD, “Bitcoin vs US Dollar”
After completing the ascending impulse at 7000.00, BTCUSD is forming another consolidation range. Possibly, the pair may break the range to the upside and form one more ascending structure with the target at 7500.00. Later, the market may start a new correction to test 7000.00 from above.
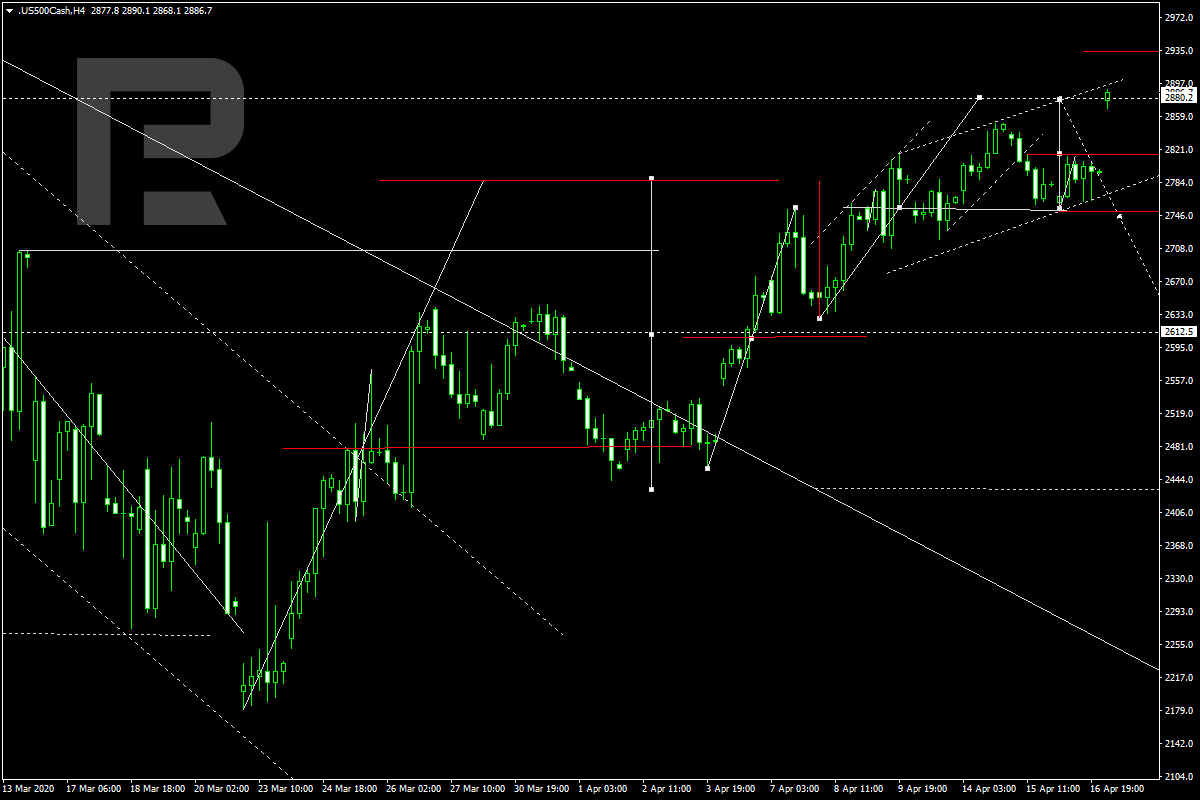
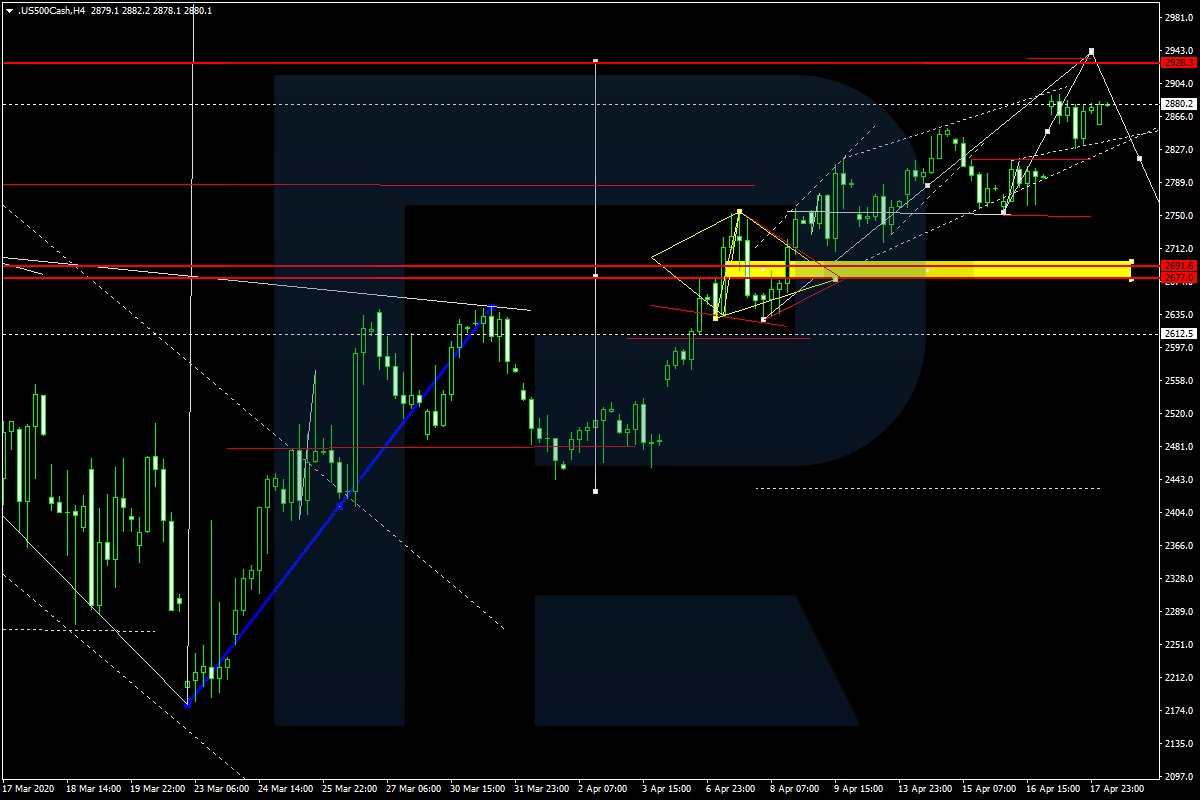
S&P 500
There was a gap to the upside this morning, which helped S&P 500 to reach 2901.0; right now, it is trying to keep the positive momentum. Possibly, the instrument may reach 2917.5 and then resume falling to break 2810.2. Later, the market may continue trading downwards to reach 2675.5. After that, we may evaluate this descending wave. There might be a possibility of a new wave to the upside towards 3160.5, which should be considered as an ascending correction.