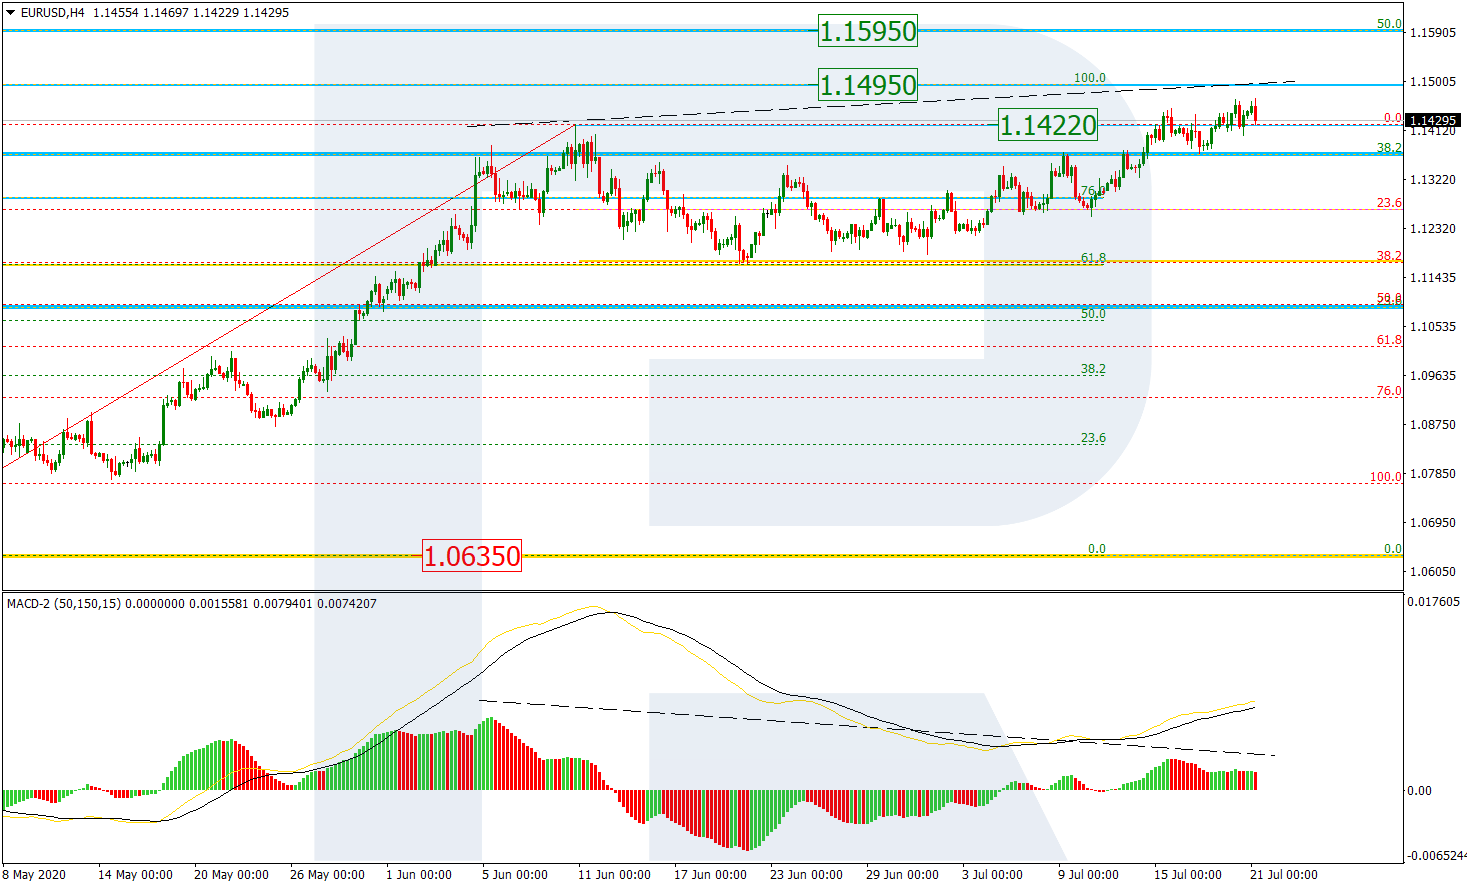
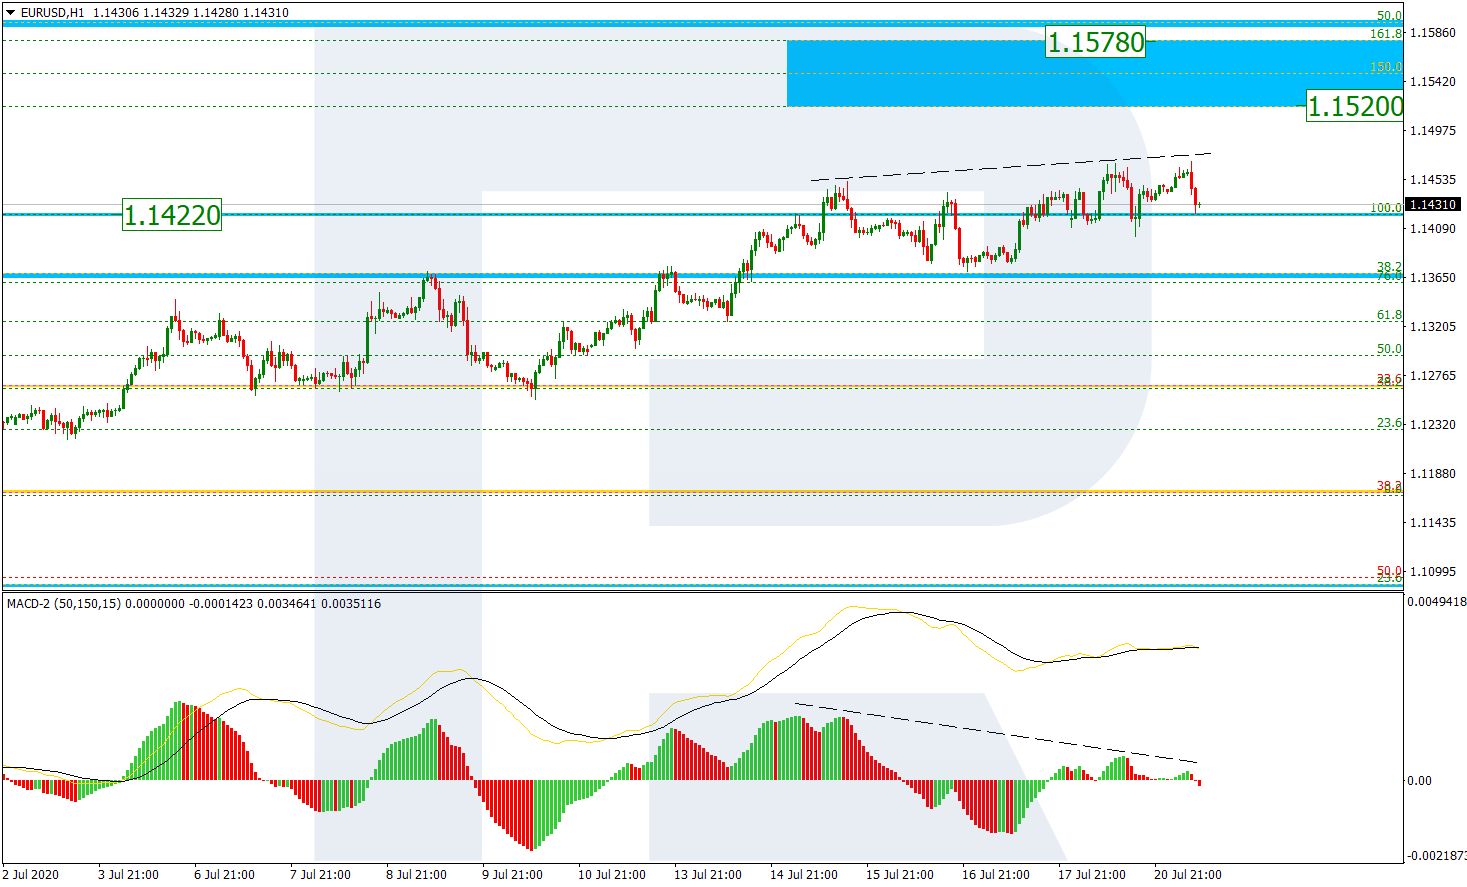
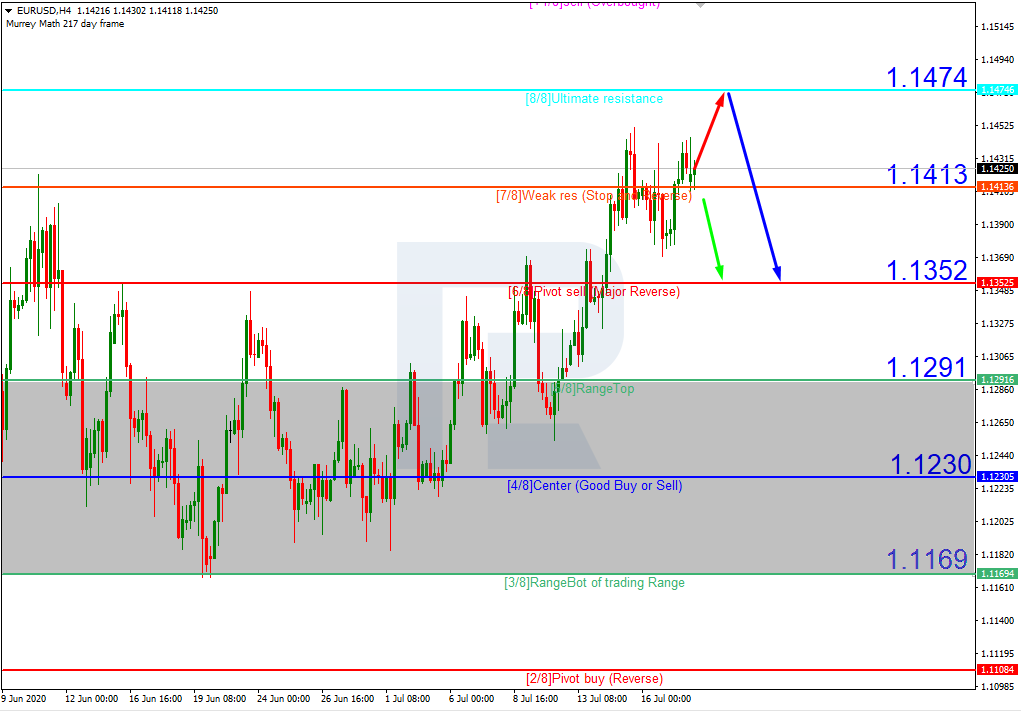
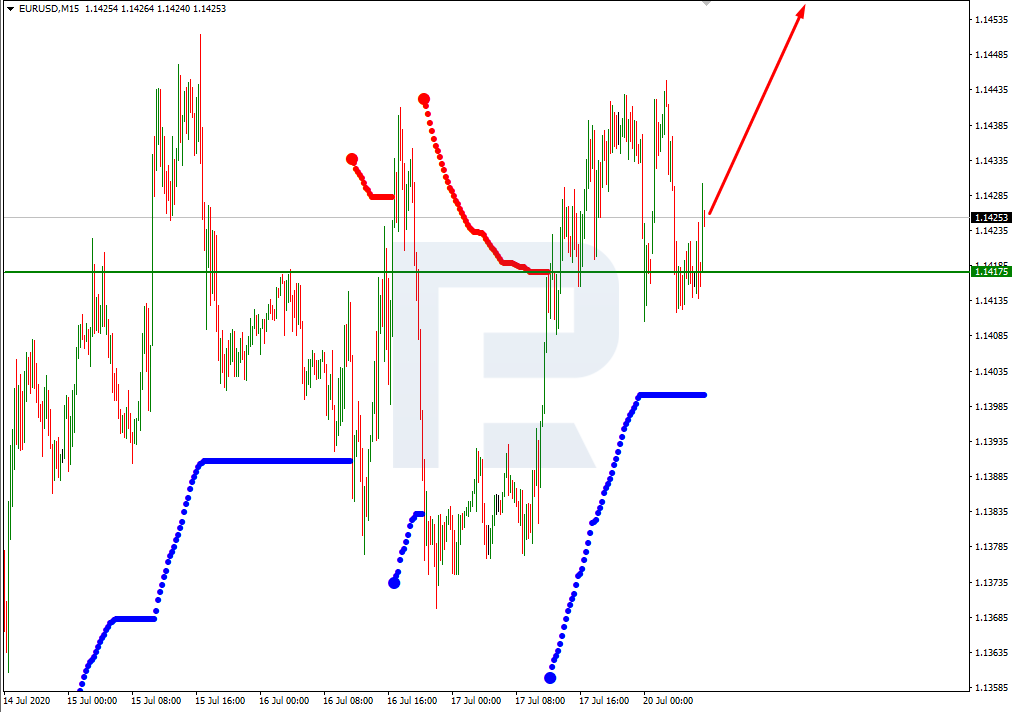
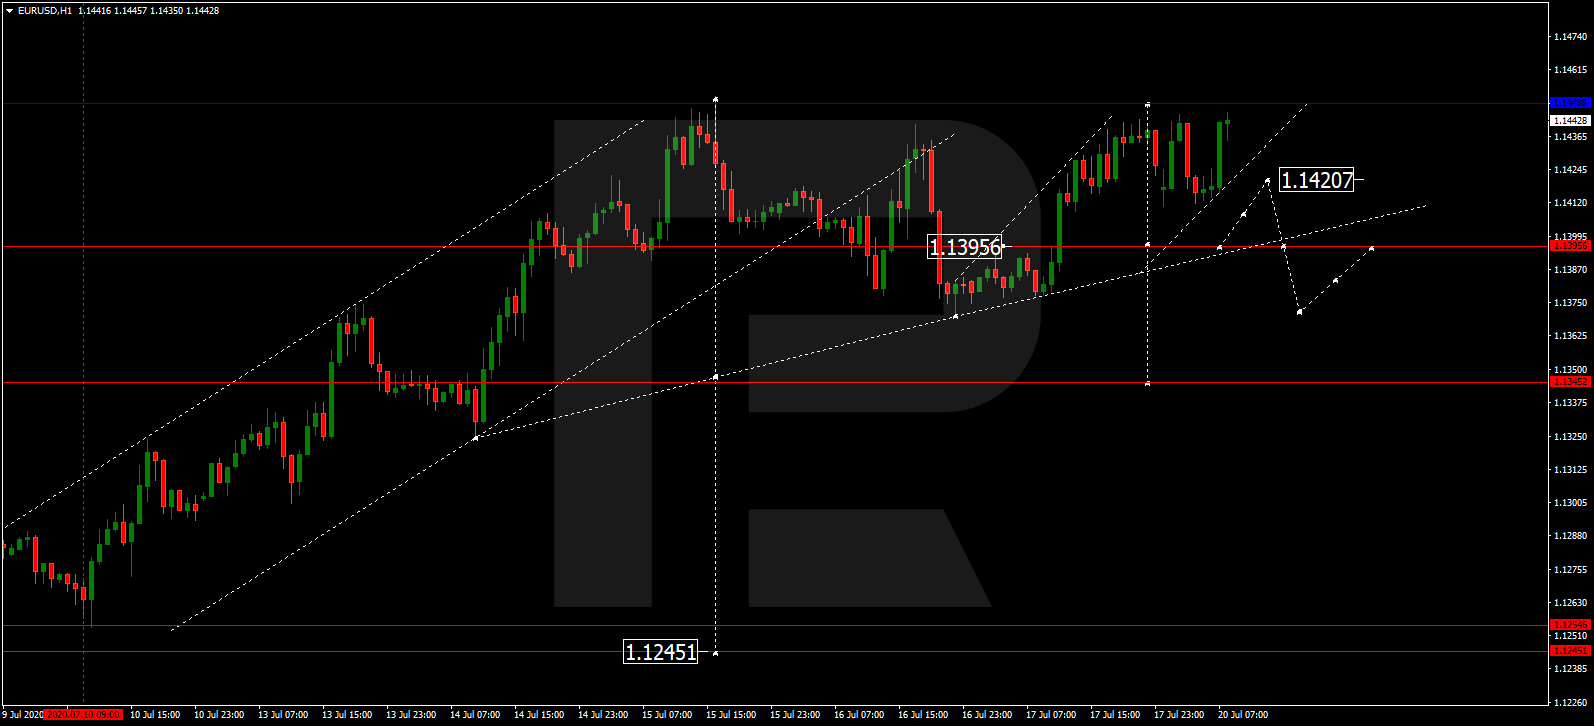
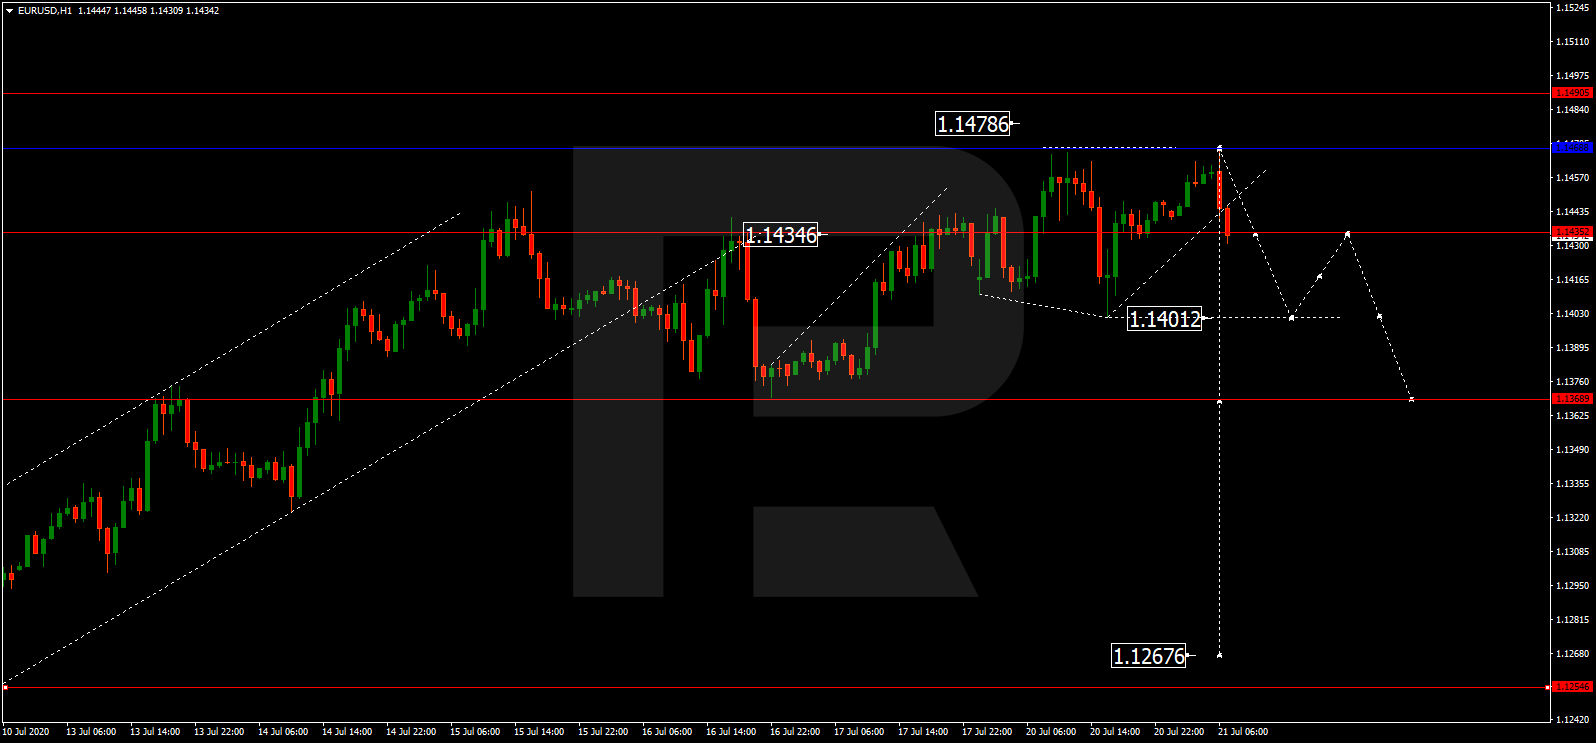
EURUSD, “Euro vs US Dollar”
After completing the ascending structure at 1.1469, EURUSD is moving downwards to reach 1.1402. After that, the instrument may grow towards 1.1435, thus forming a new consolidation range between these two levels. If later the price breaks this range to the upside, the market may resume trading upwards to reach 1.1500; if to the downside – start a new decline with the target at 1.1333.

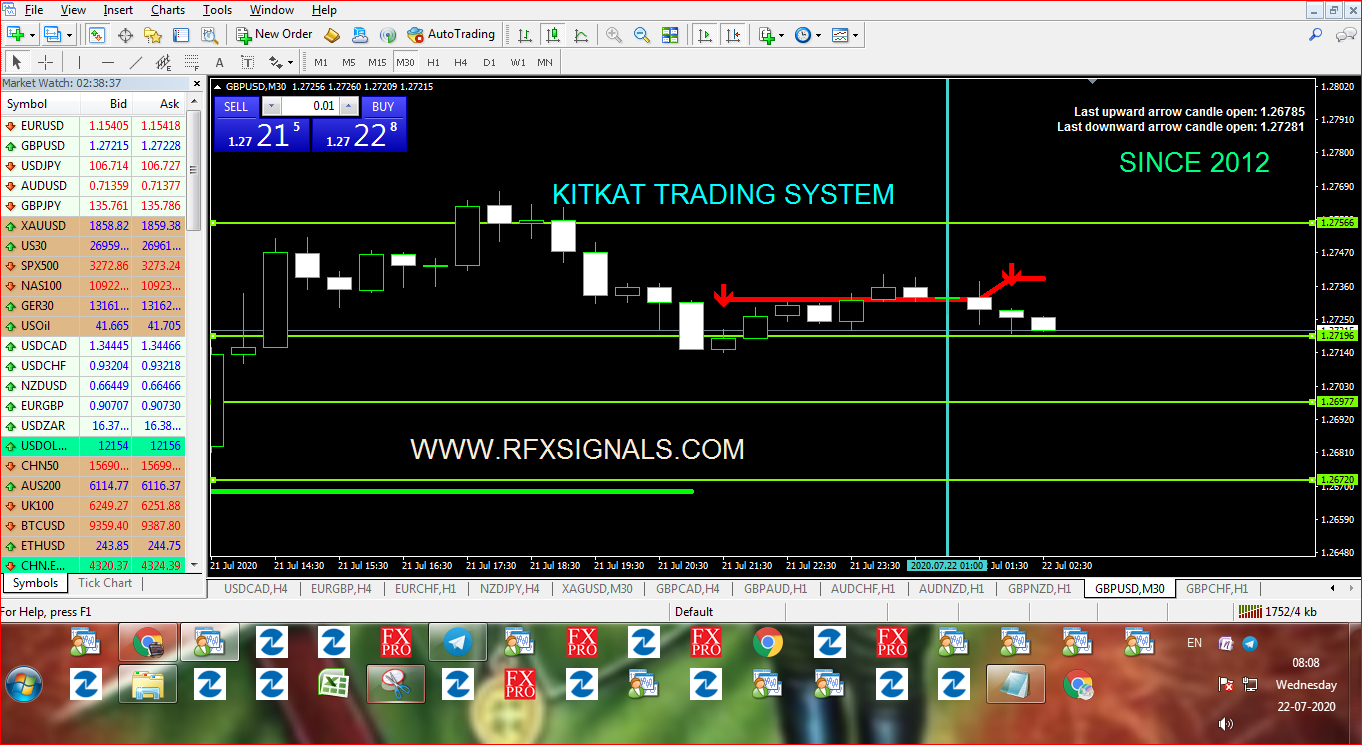
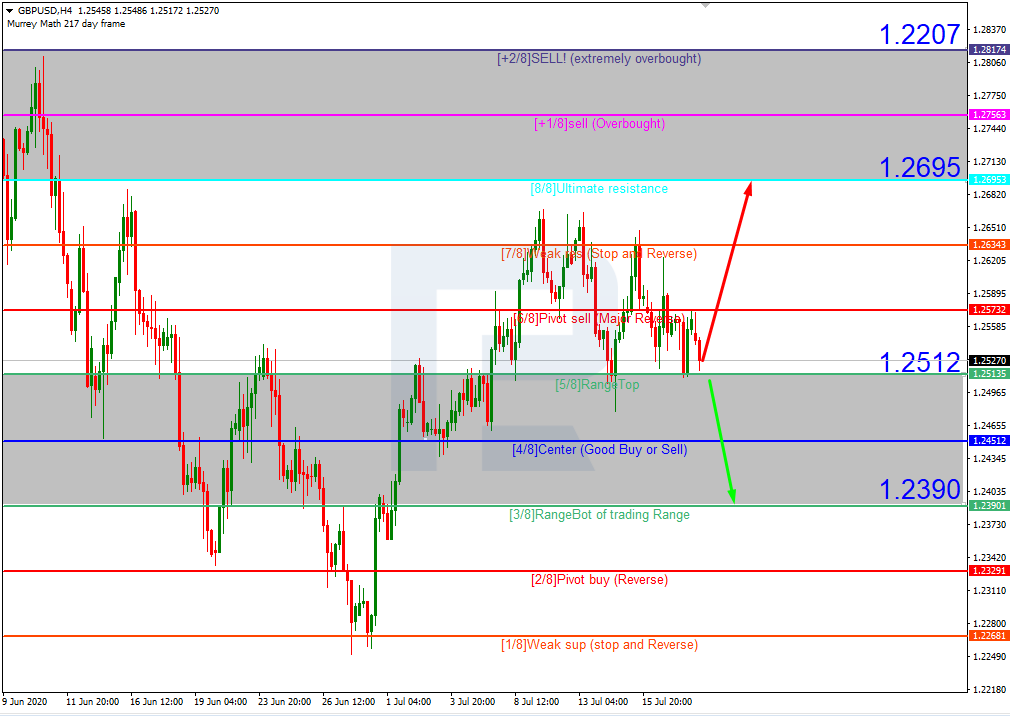
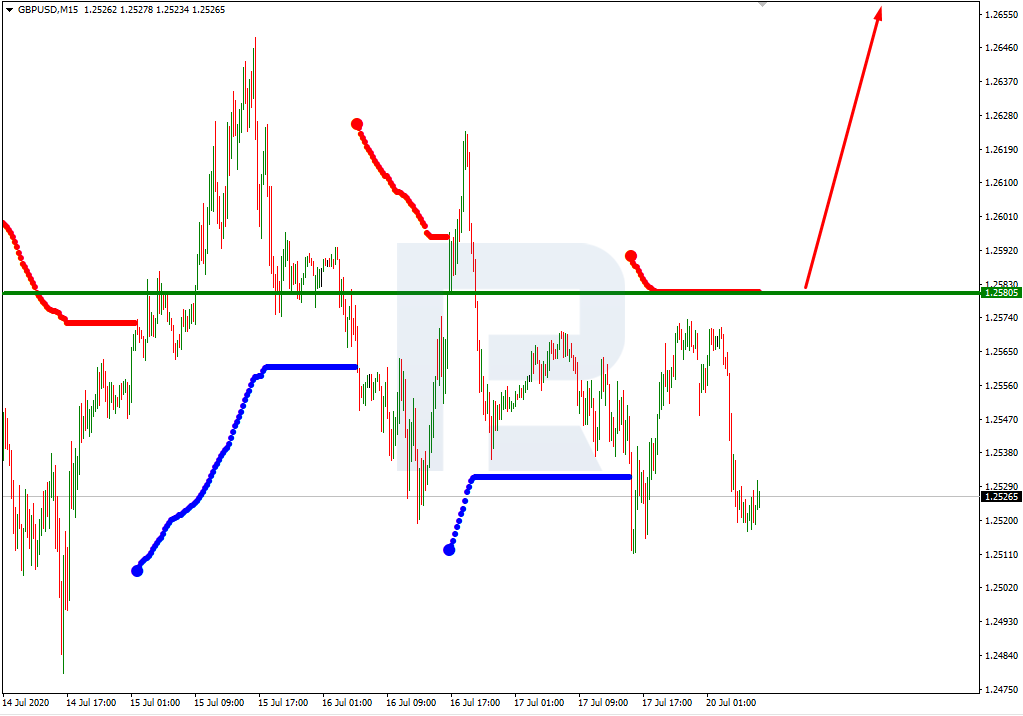
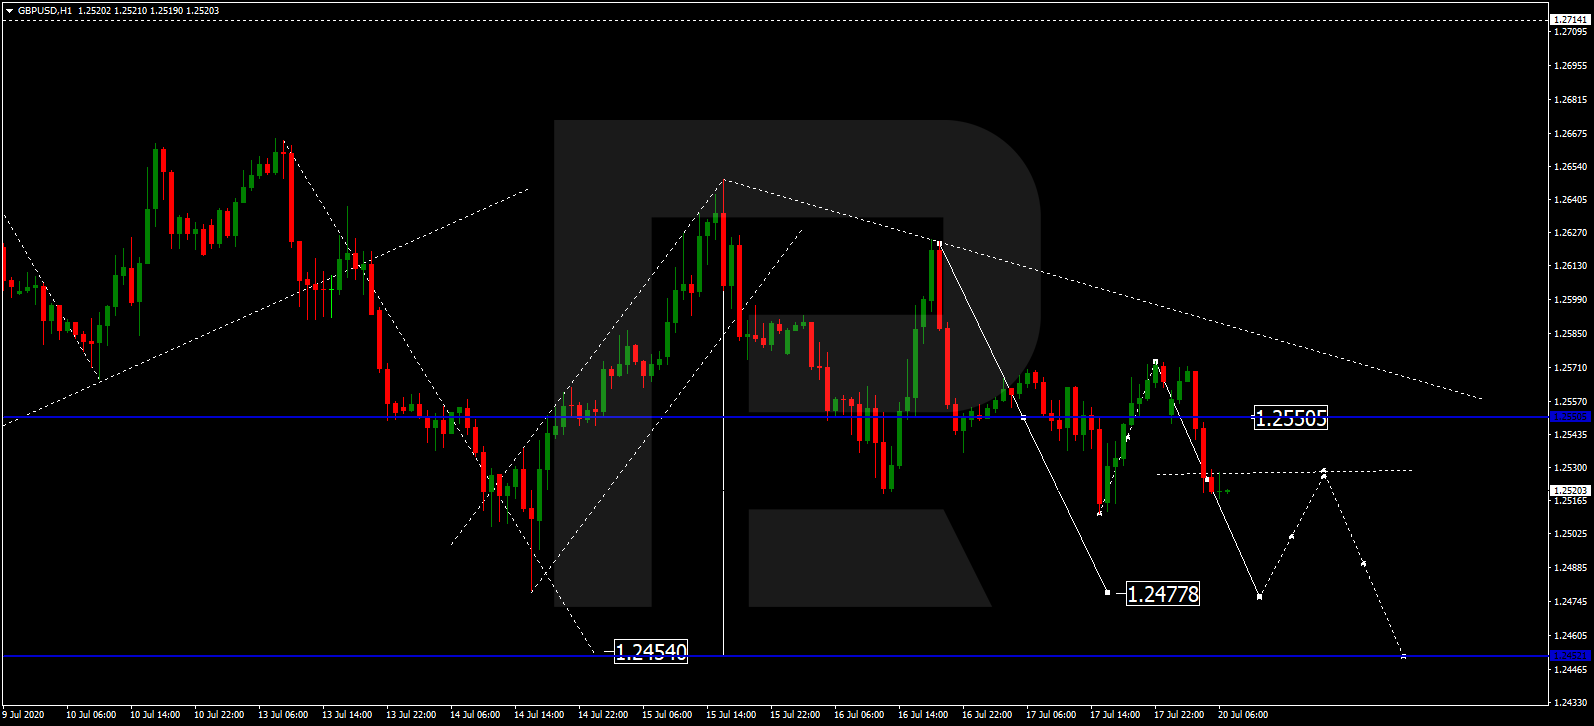
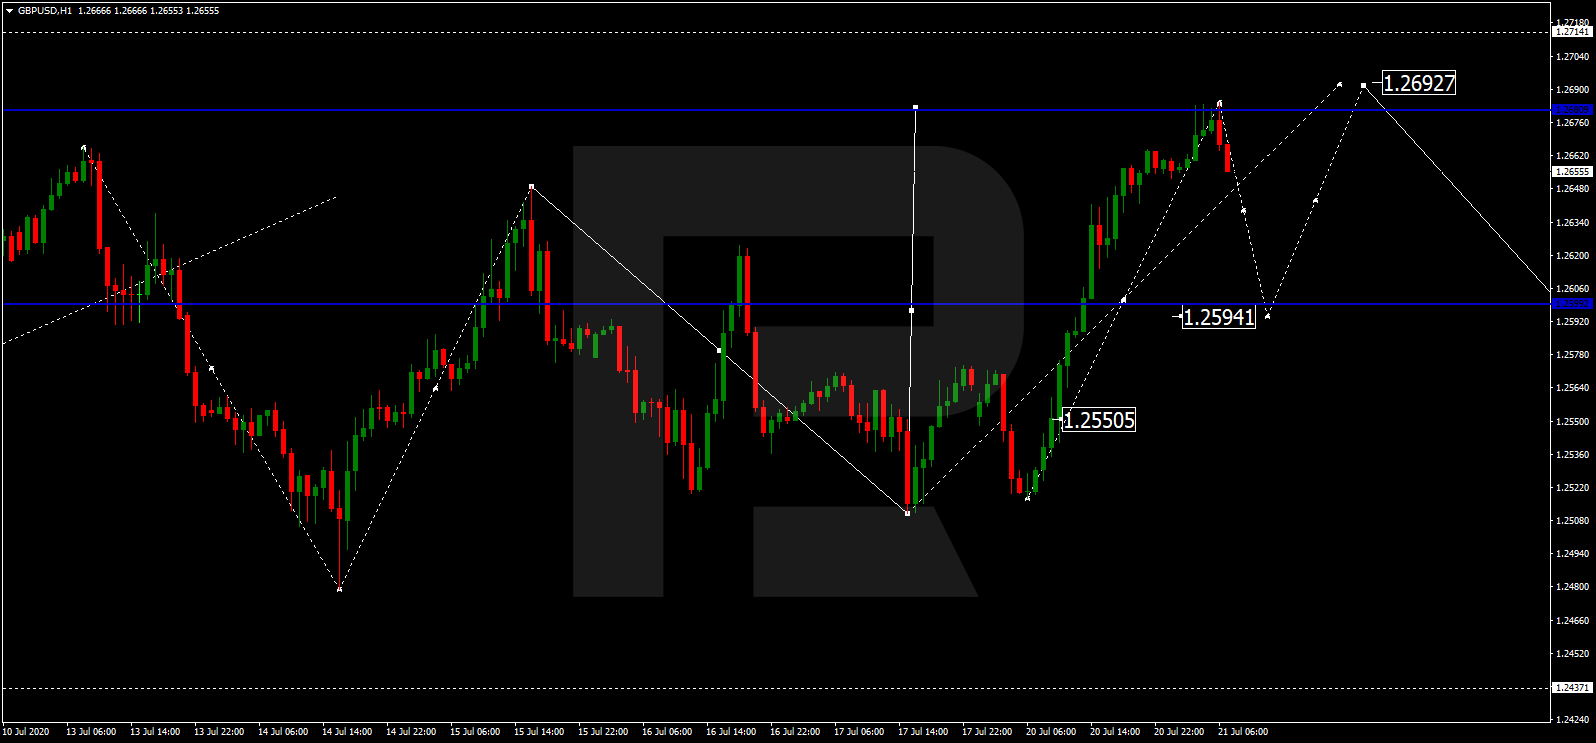
GBPUSD, “Great Britain Pound vs US Dollar”
GBPUSD has finished the ascending structure at 1.2684; right now, it is falling to reach 1.2594. After that, the instrument may form one more ascending structure to reach 1.2635, thus forming a new consolidation range between these two levels. If later the price breaks this range to the upside, the market may resume growing towards 1.2700; if to the downside – start a new decline with the target at 1.2500.
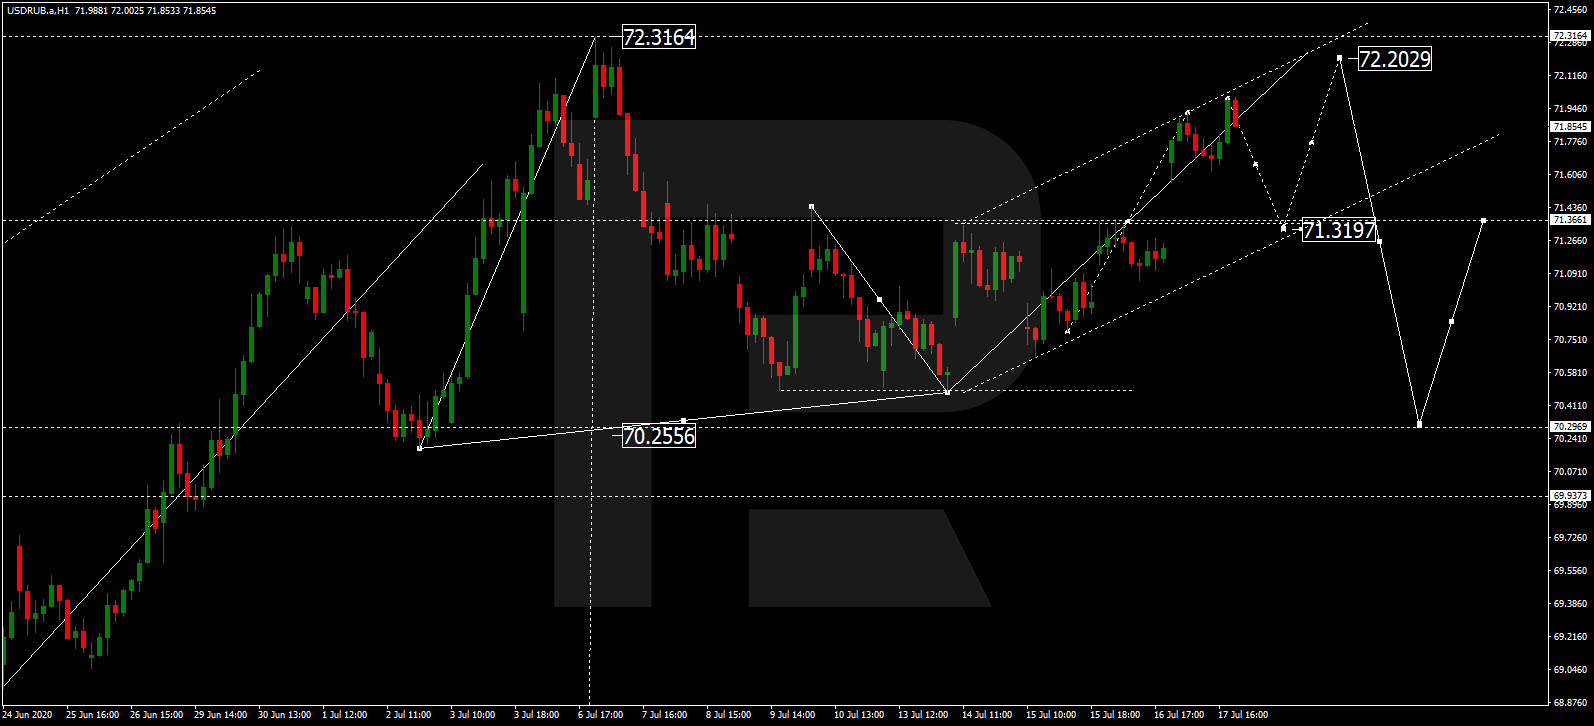
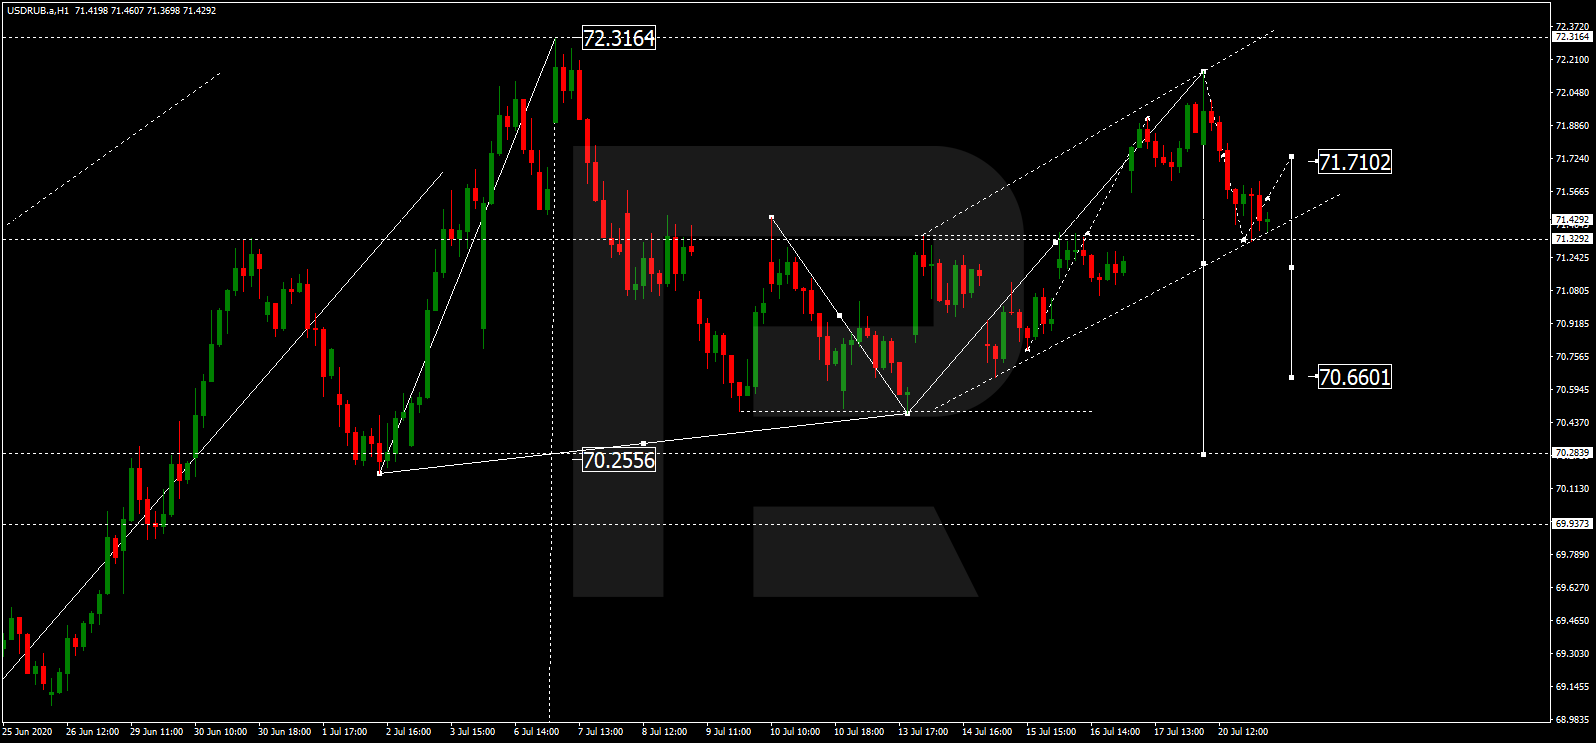
USDRUB, “US Dollar vs Russian Ruble”
After finishing the ascending wave at 72.00, USDRUB is trading downwards to reach 71.33. After that, the instrument may grow towards 71.71, thus forming a new consolidation range between these two levels. If later the price breaks this range to the upside, the market may update 72.20 and then resume falling to reach 70.00; if to the downside – form a new descending structure with the target at 70.66.
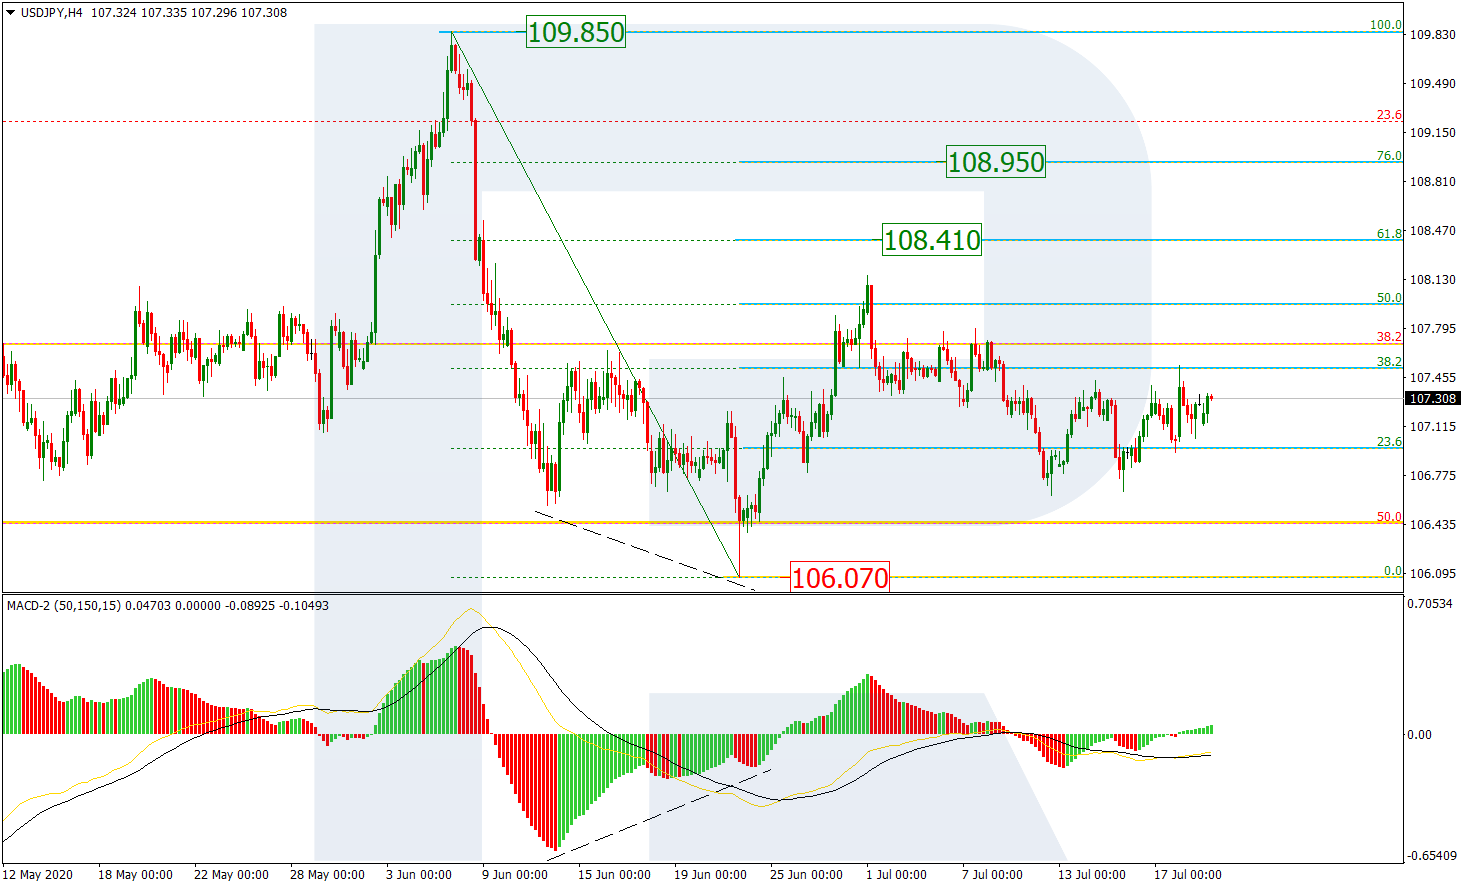
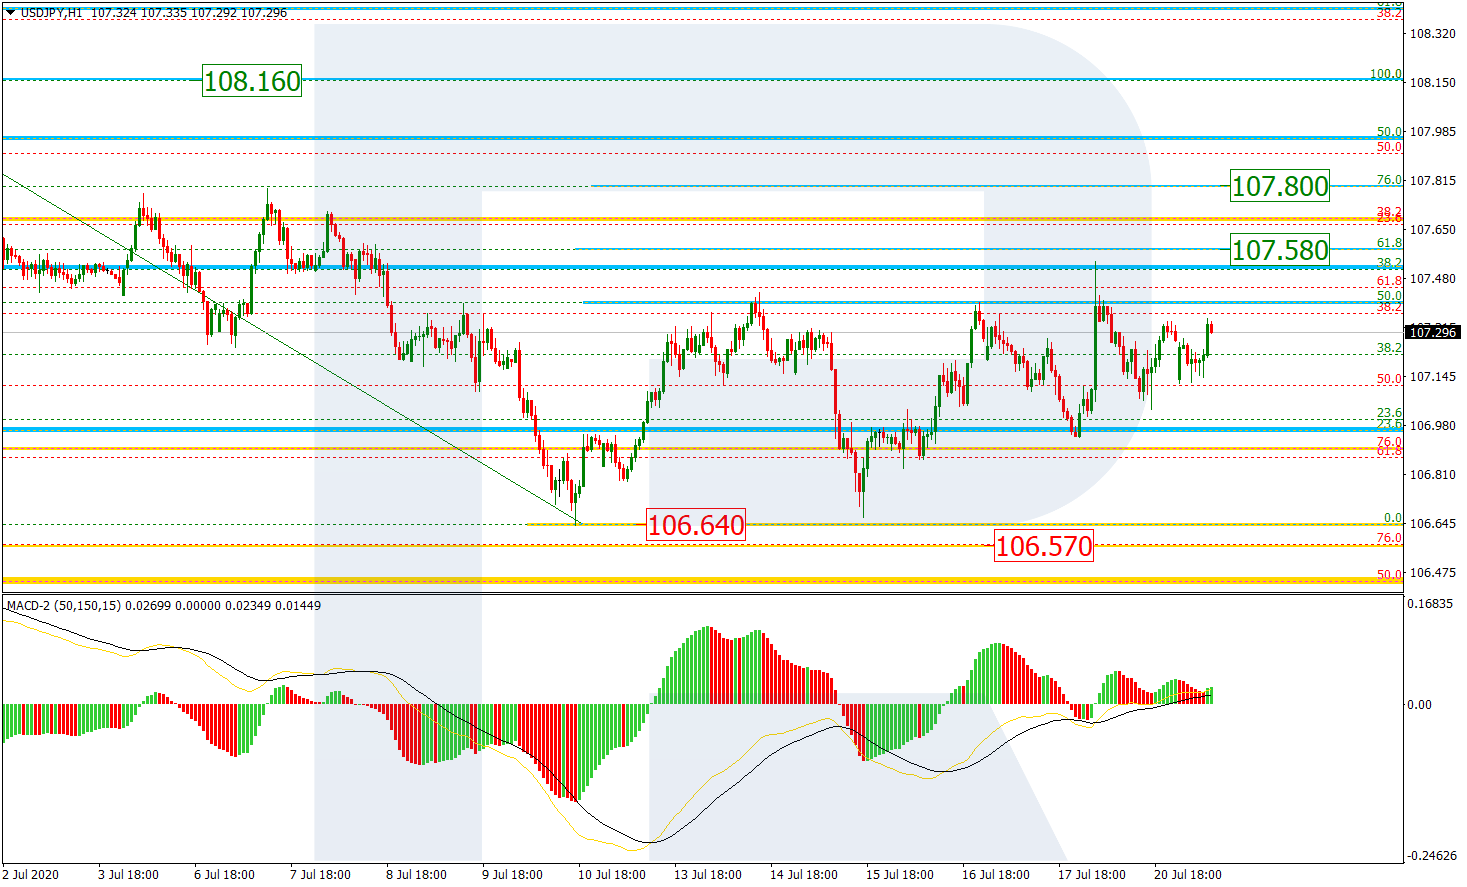
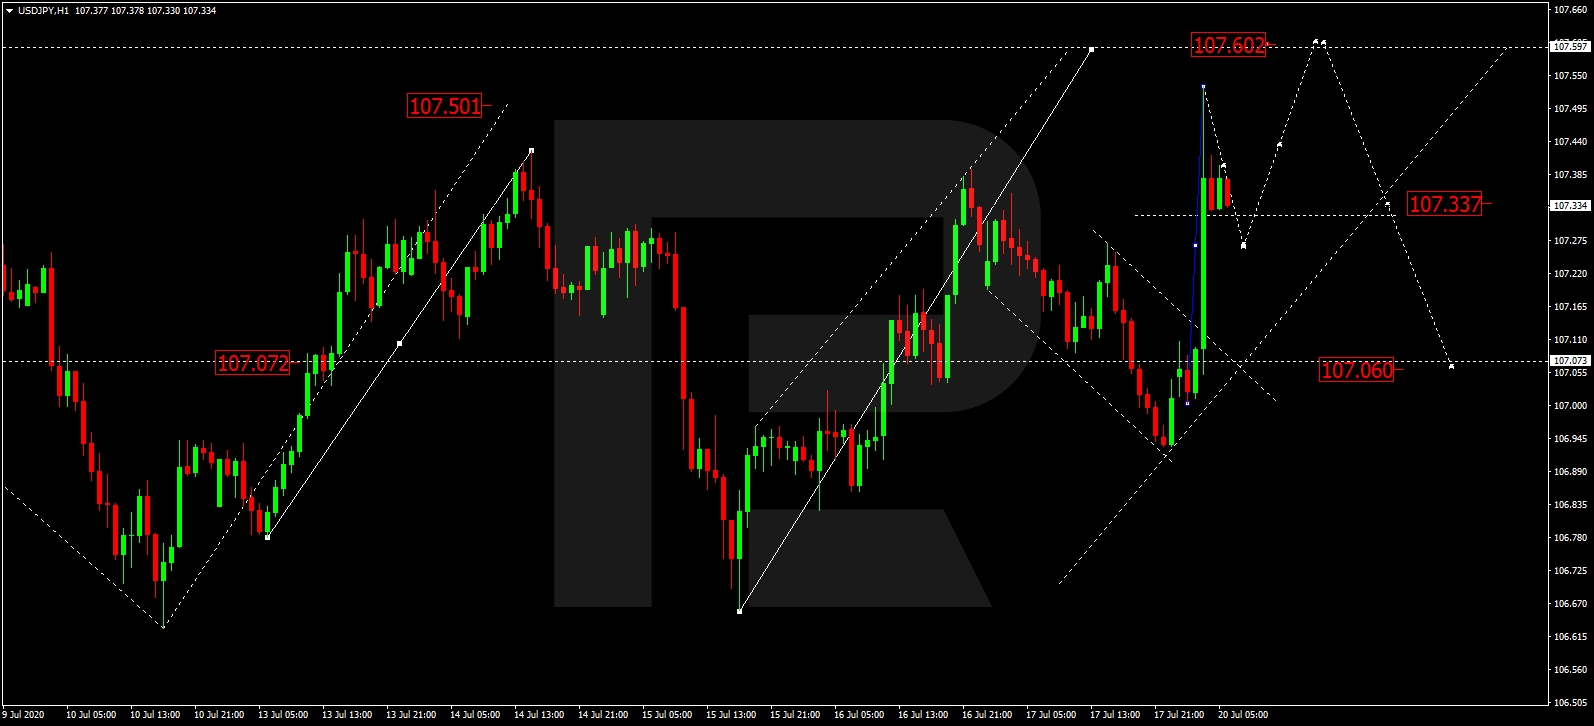
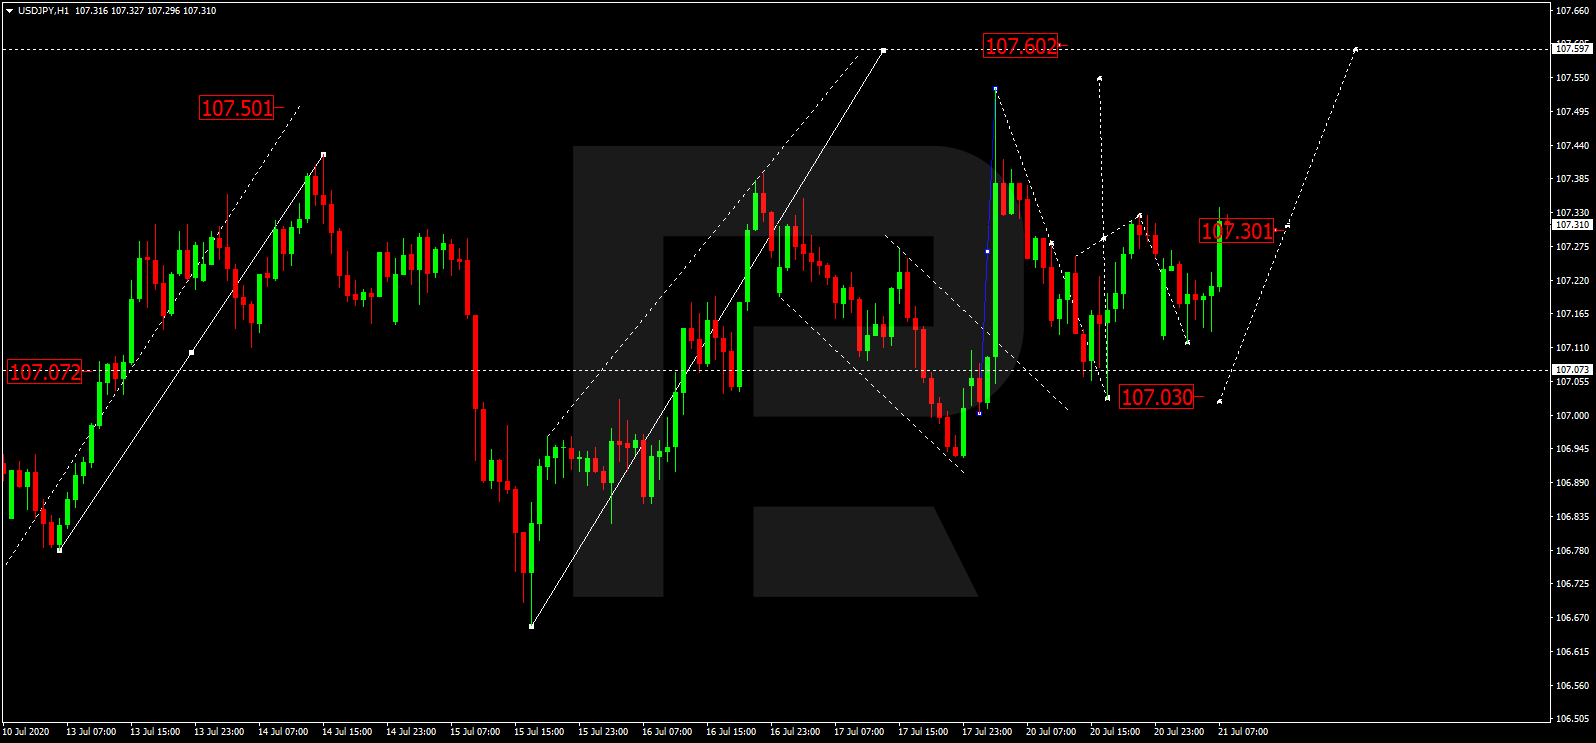
USDJPY, “US Dollar vs Japanese Yen”
After finishing the descending wave and reaching the target at 107.03, USDJPY is expected to resume growing towards 107.50. Later, the market may form a new descending structure to reach 107.30 and then start another growth with the target at 107.60.
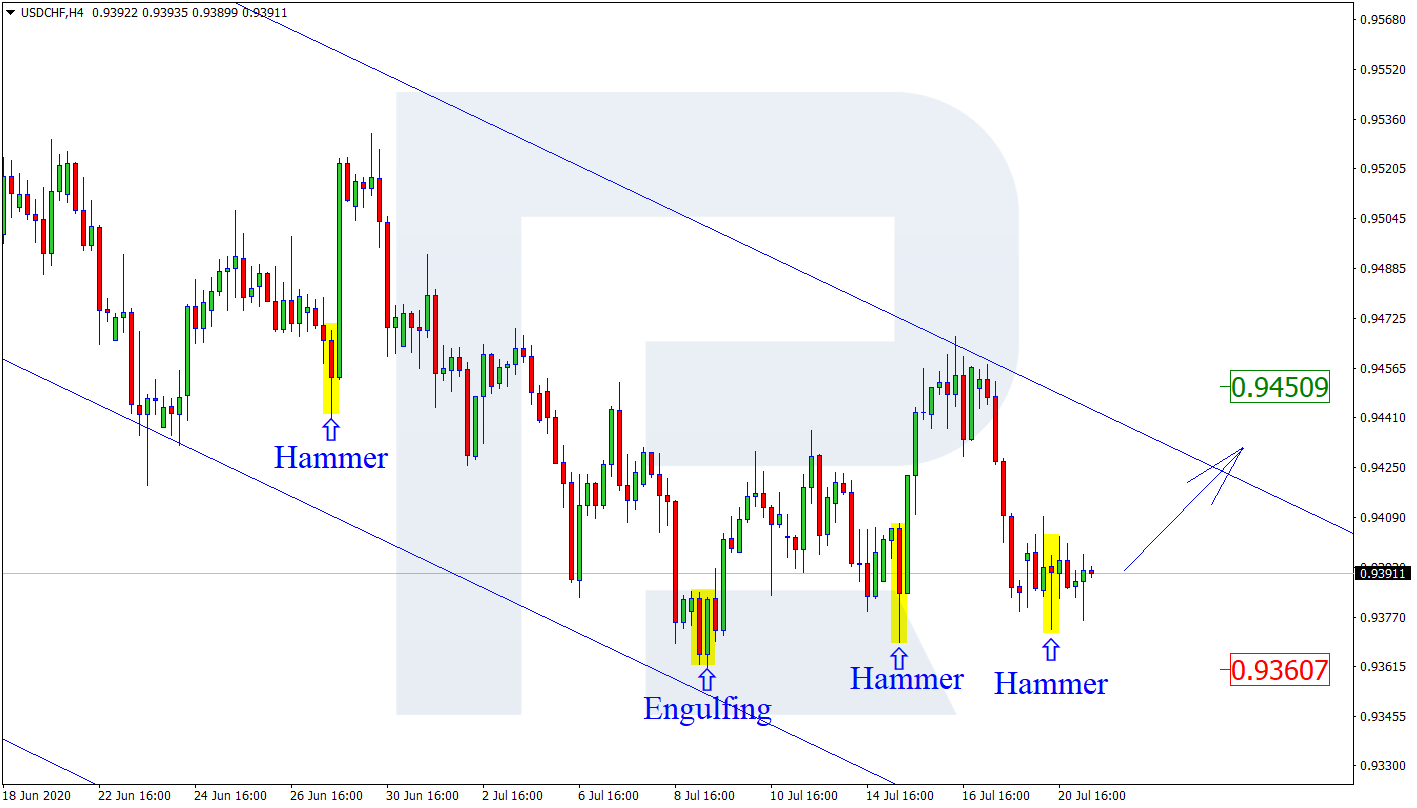
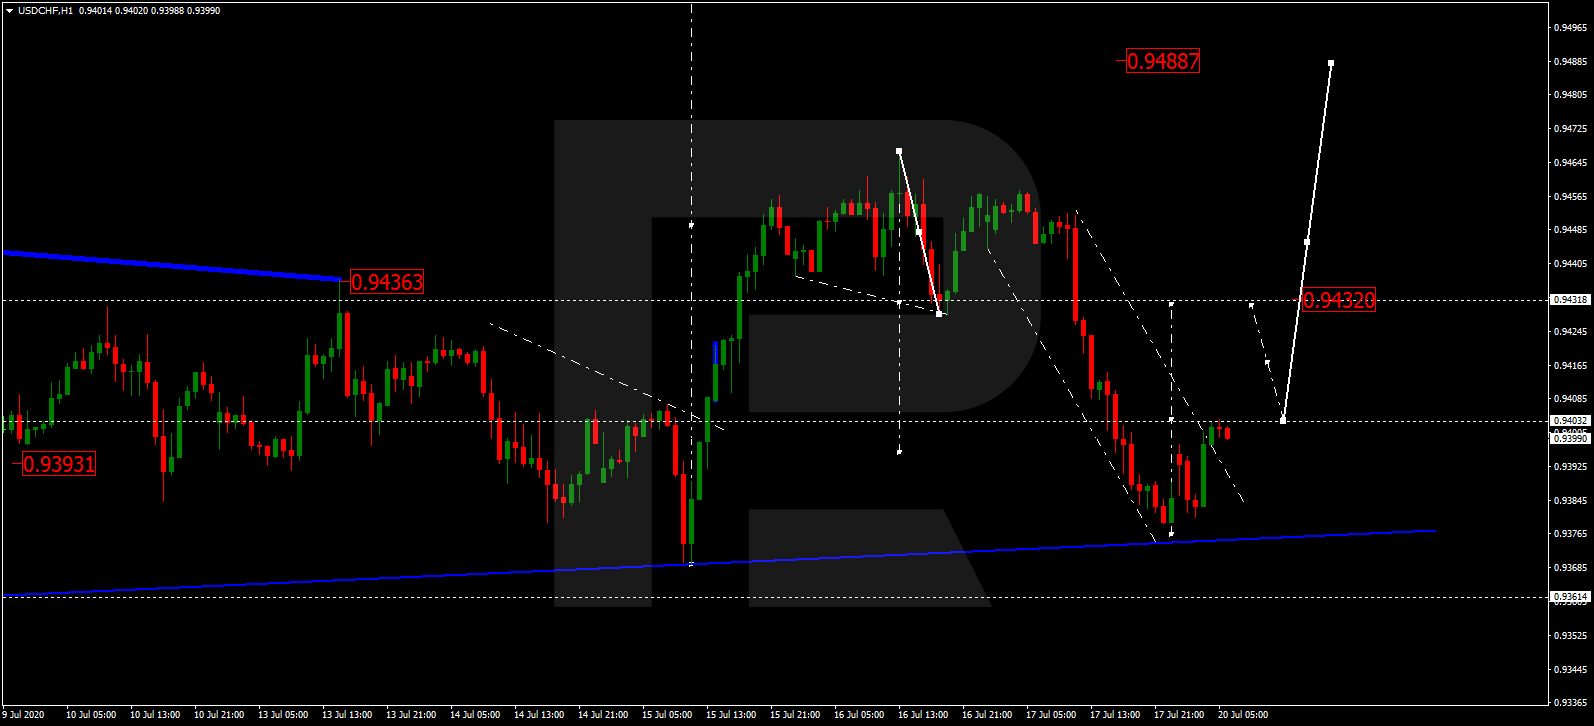
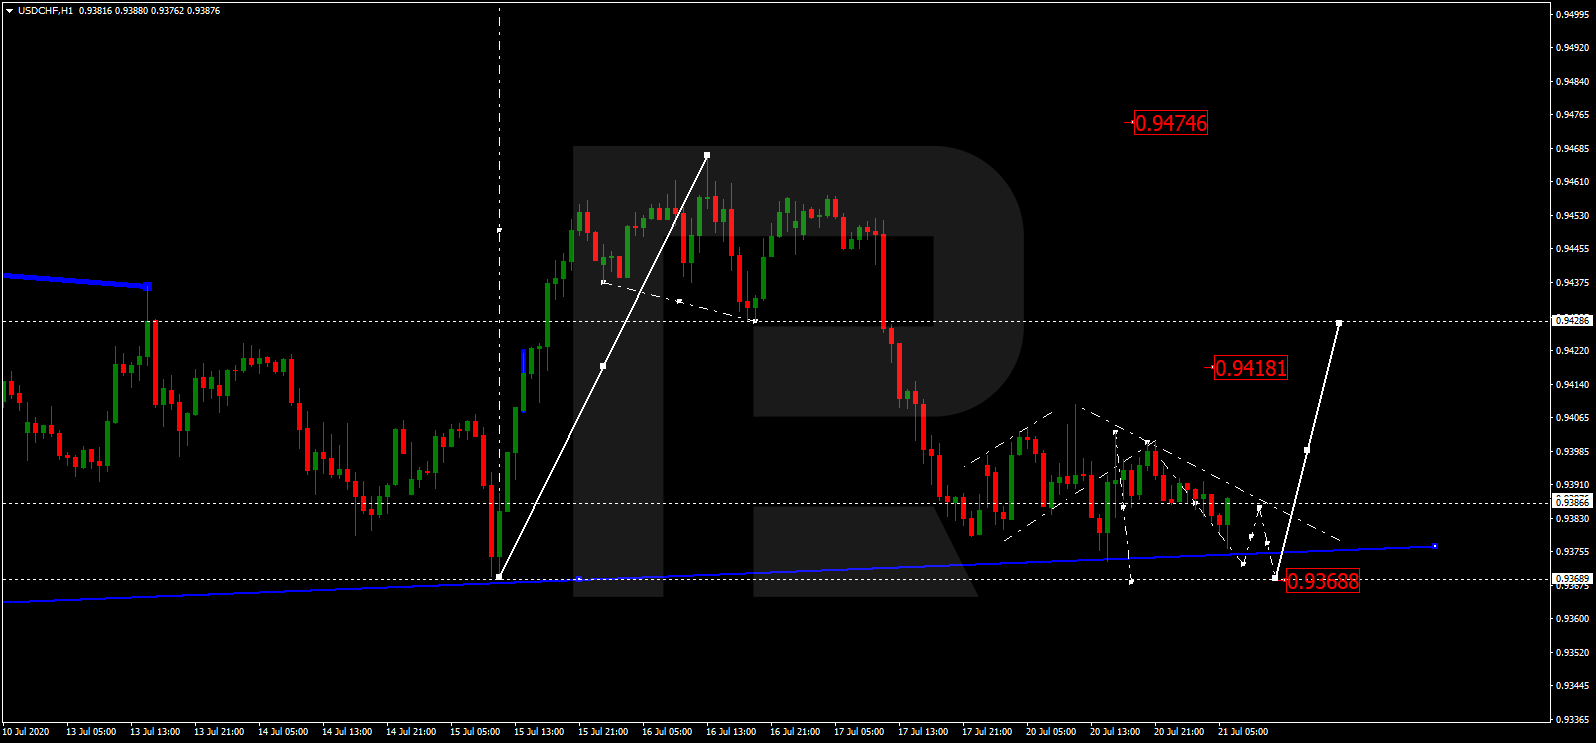
USDCHF, “US Dollar vs Swiss Franc”
USDCHF is still consolidating around 0.9390. Possibly, today the pair may fall to reach 0.9370 and then grow to break 0.9400. Later, the market may continue trading upwards with the target at 0.9430.
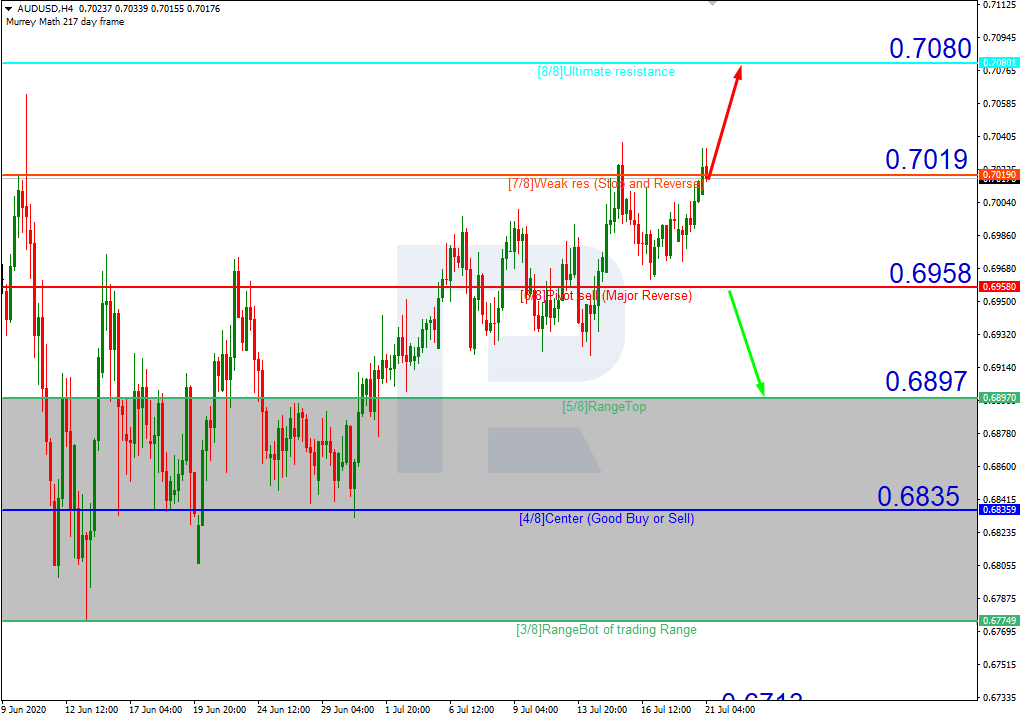
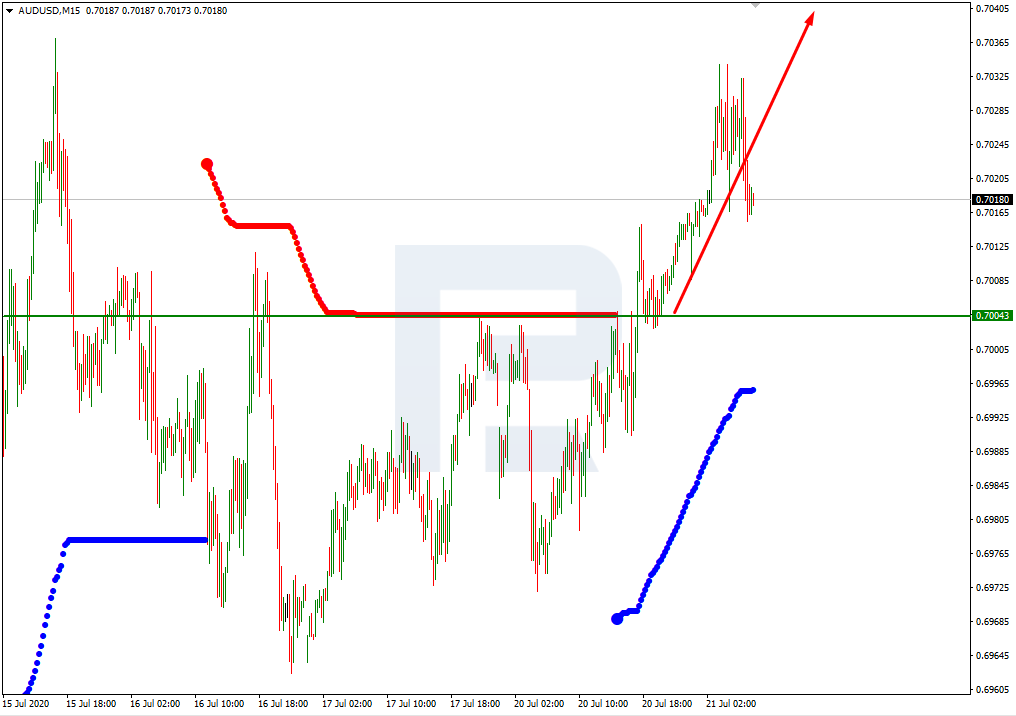
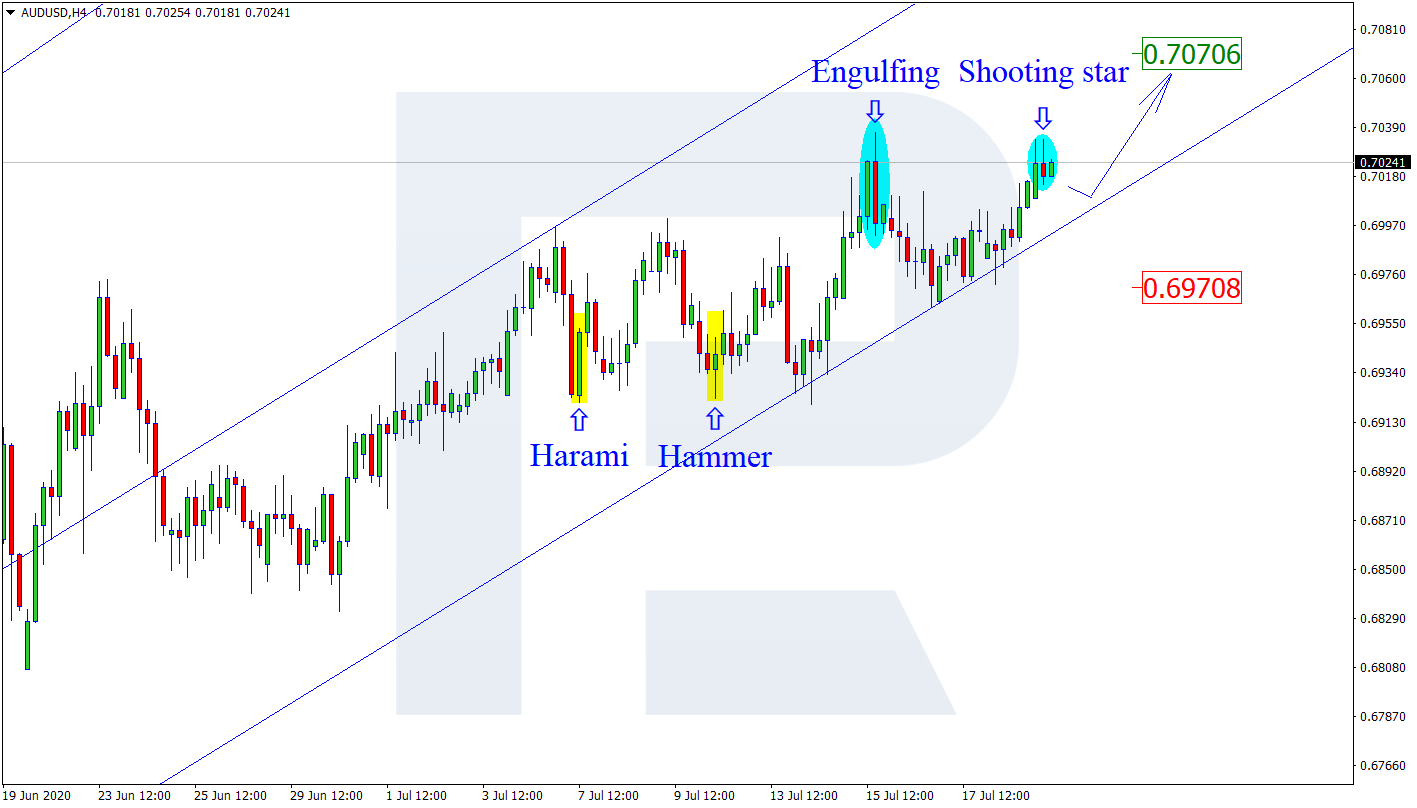
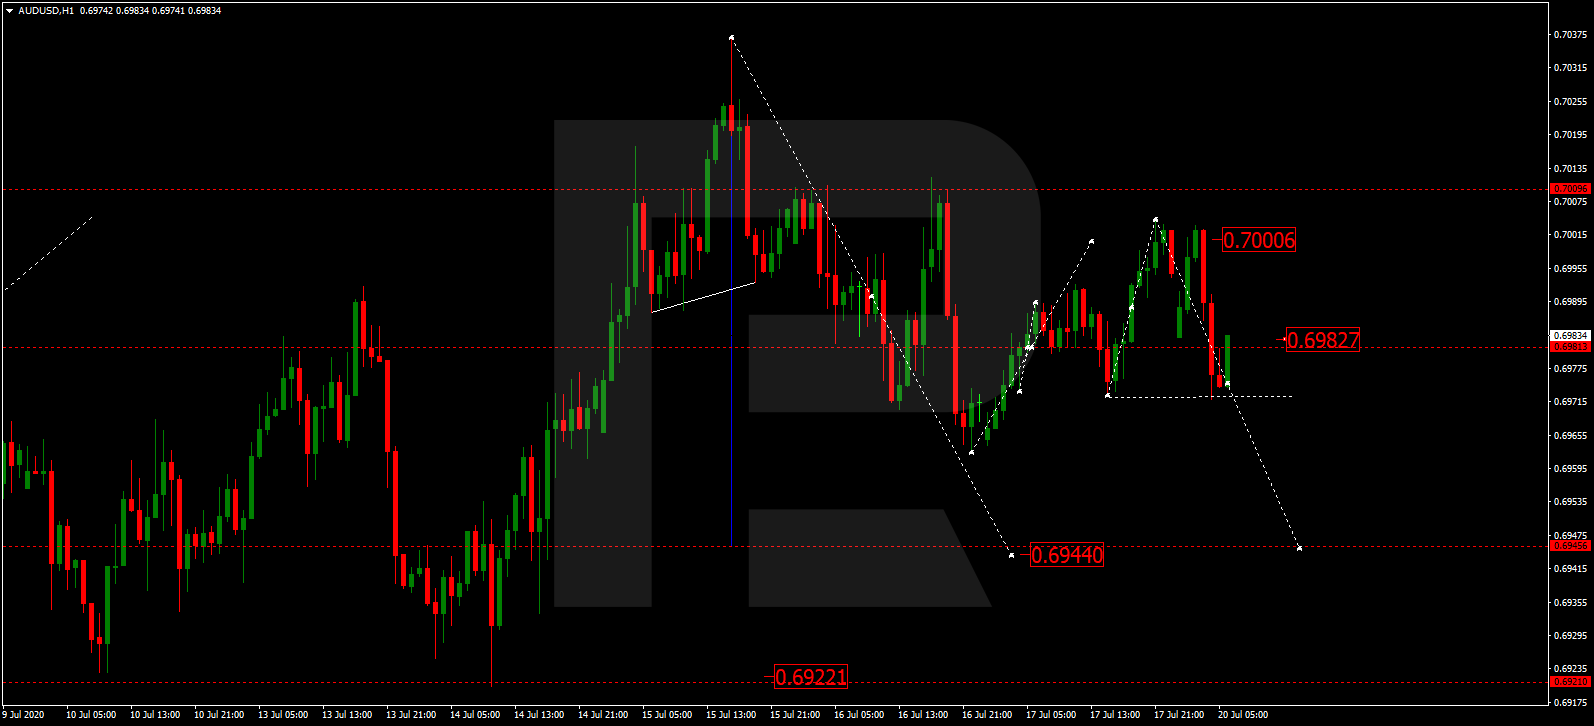
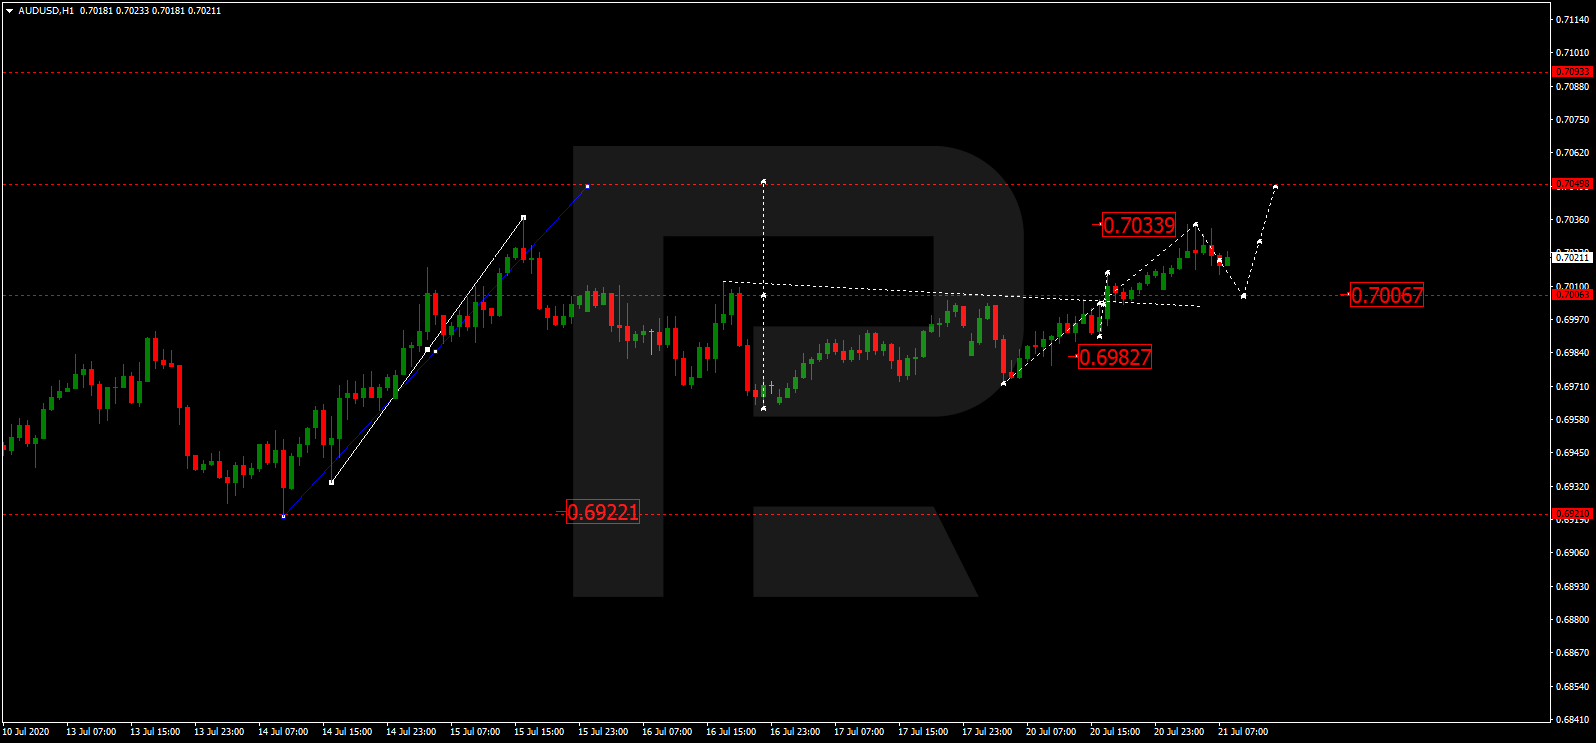
AUDUSD, “Australian Dollar vs US Dollar”
AUDUSD has finished the ascending wave at 0.7033. Today, the pair may fall to test 0.7000 from above and then resume trading upwards with the target at 0.7049.
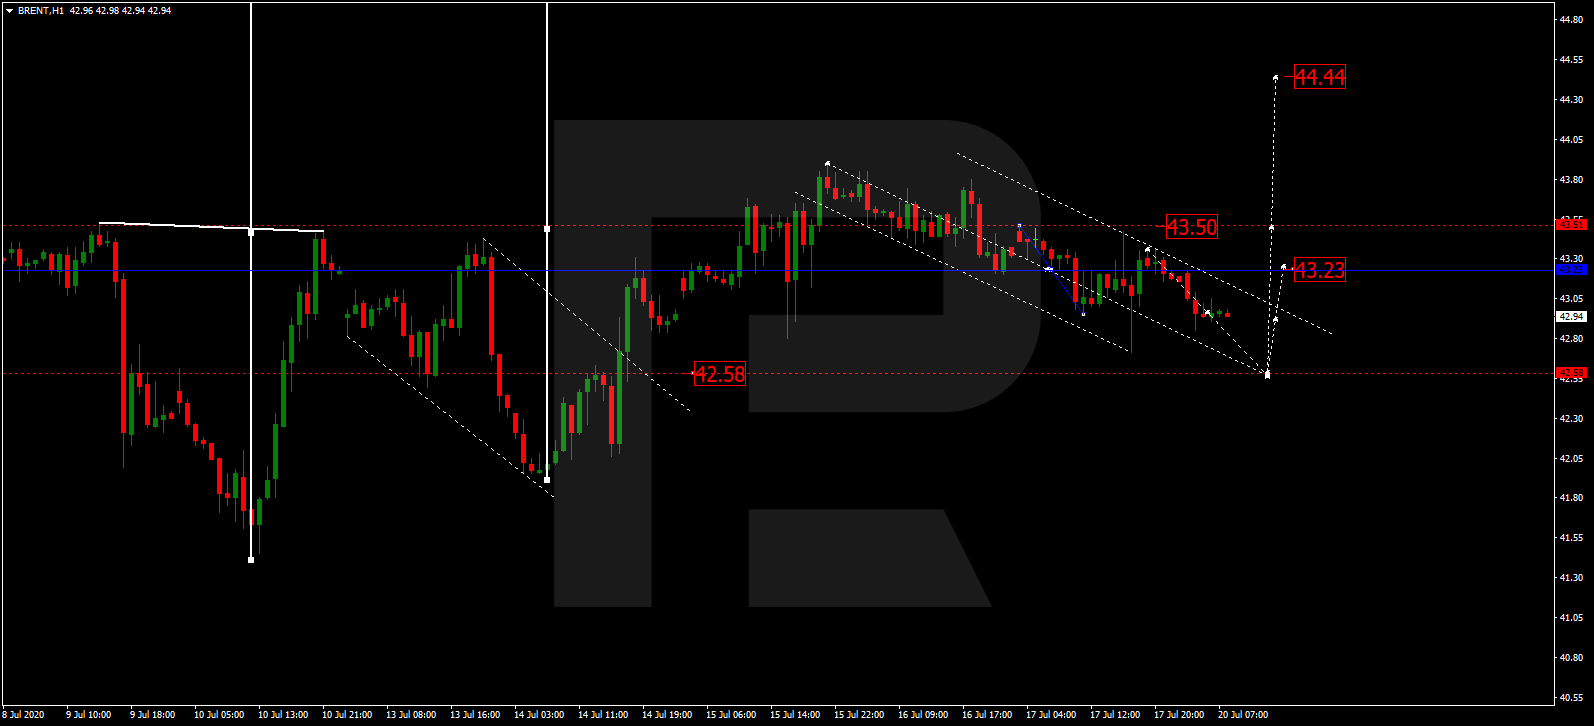
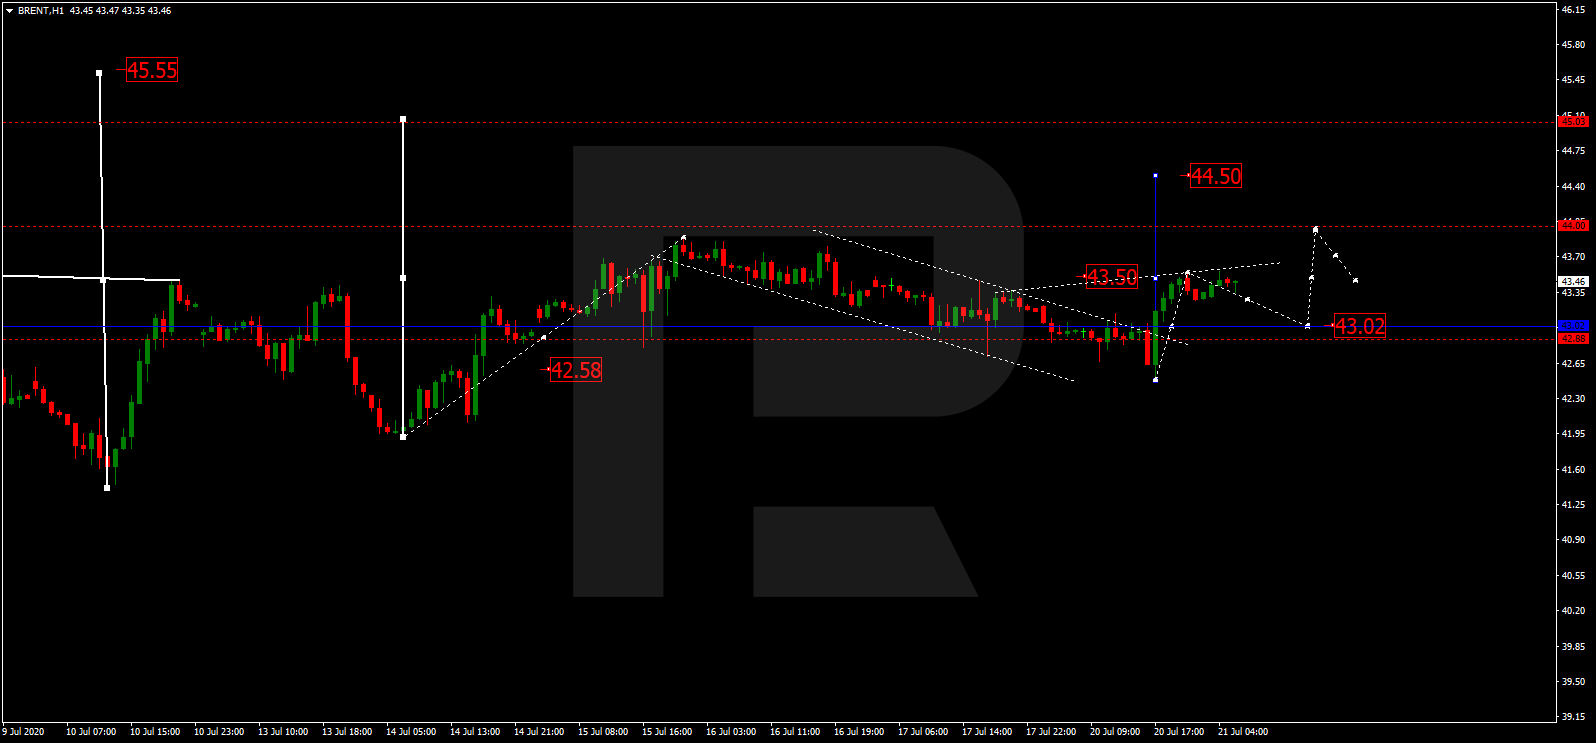
BRENT
After completing the correction at 42.58 along with the ascending impulse towards 43.50, Brent is consolidating around the latter level. If later the price breaks this range to the upside, the market may resume trading upwards with the short-term target at 44.50; if to the downside – start a new correction towards 43.00.
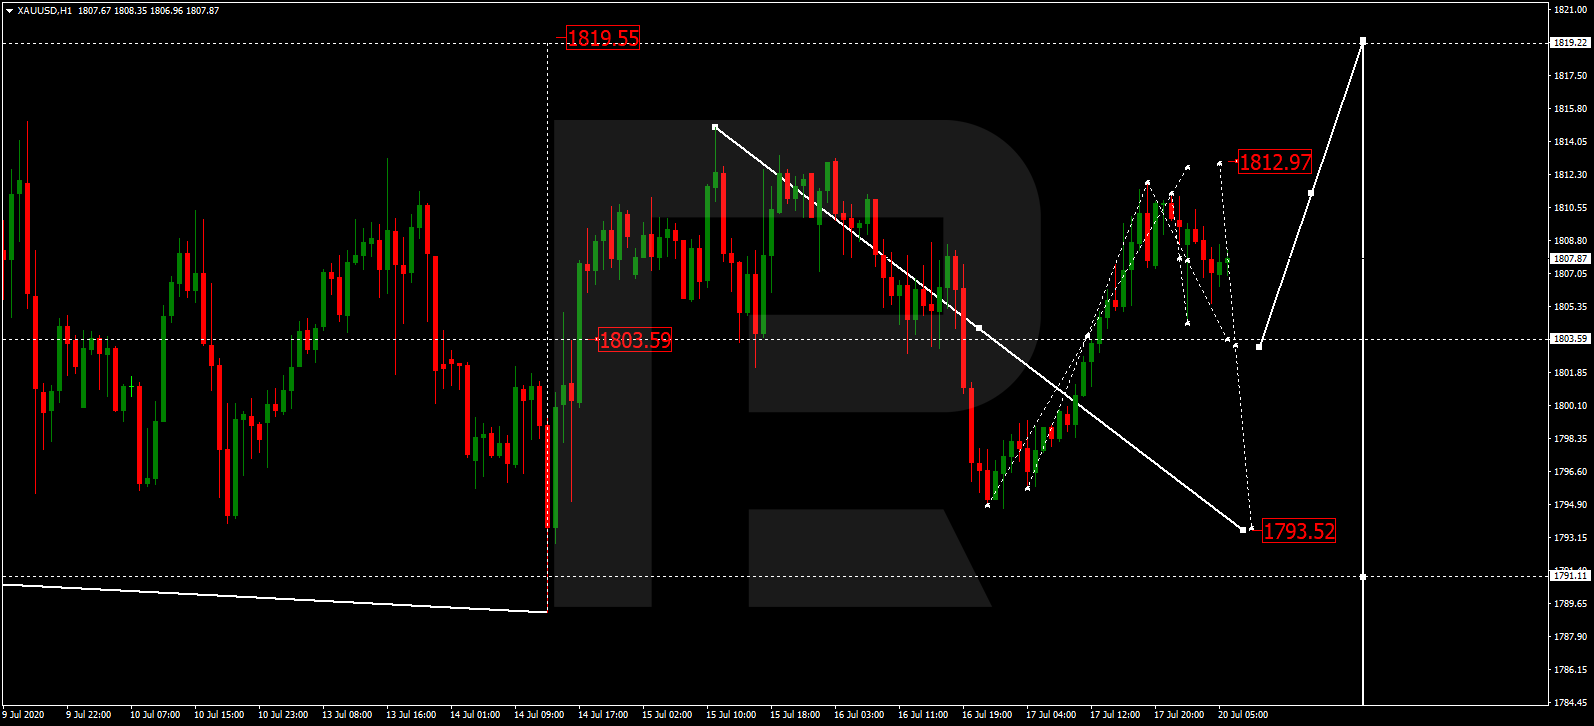
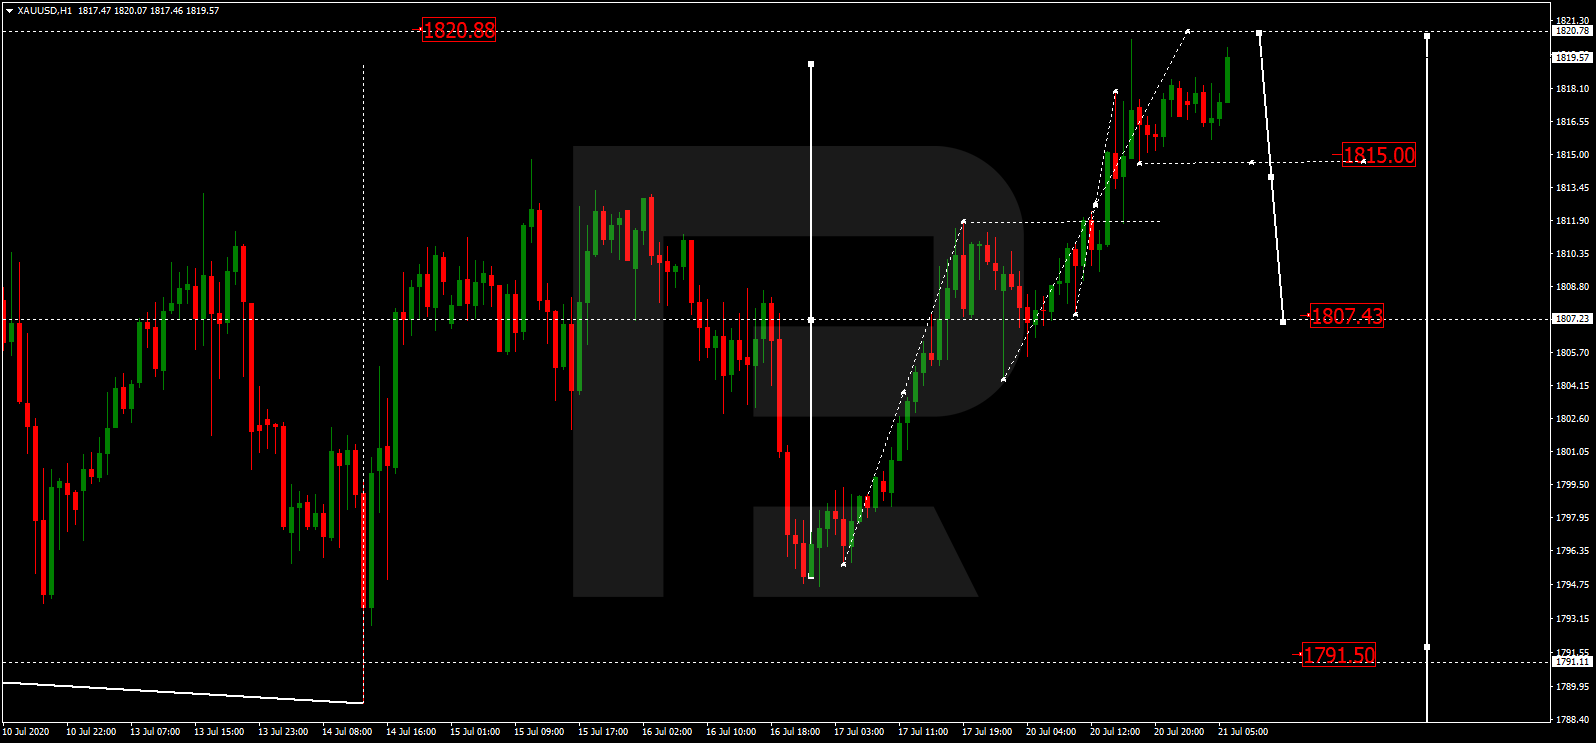
XAUUSD, “Gold vs US Dollar”
Gold is moving upwards. Possibly, today the pair may reach 1820.70 and then fall to break 1815.00. Later, the market may continue trading downwards with the first target at 1807.50.
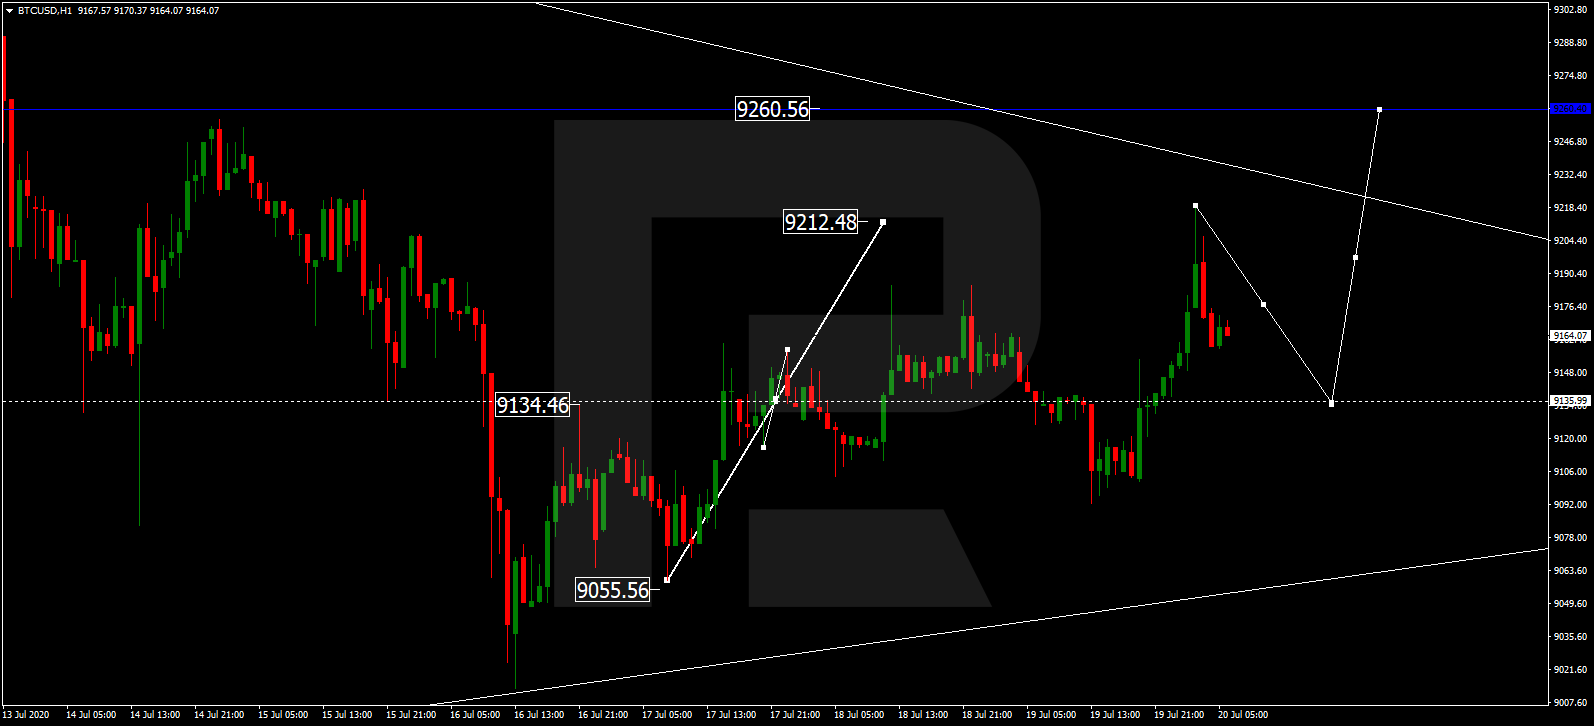
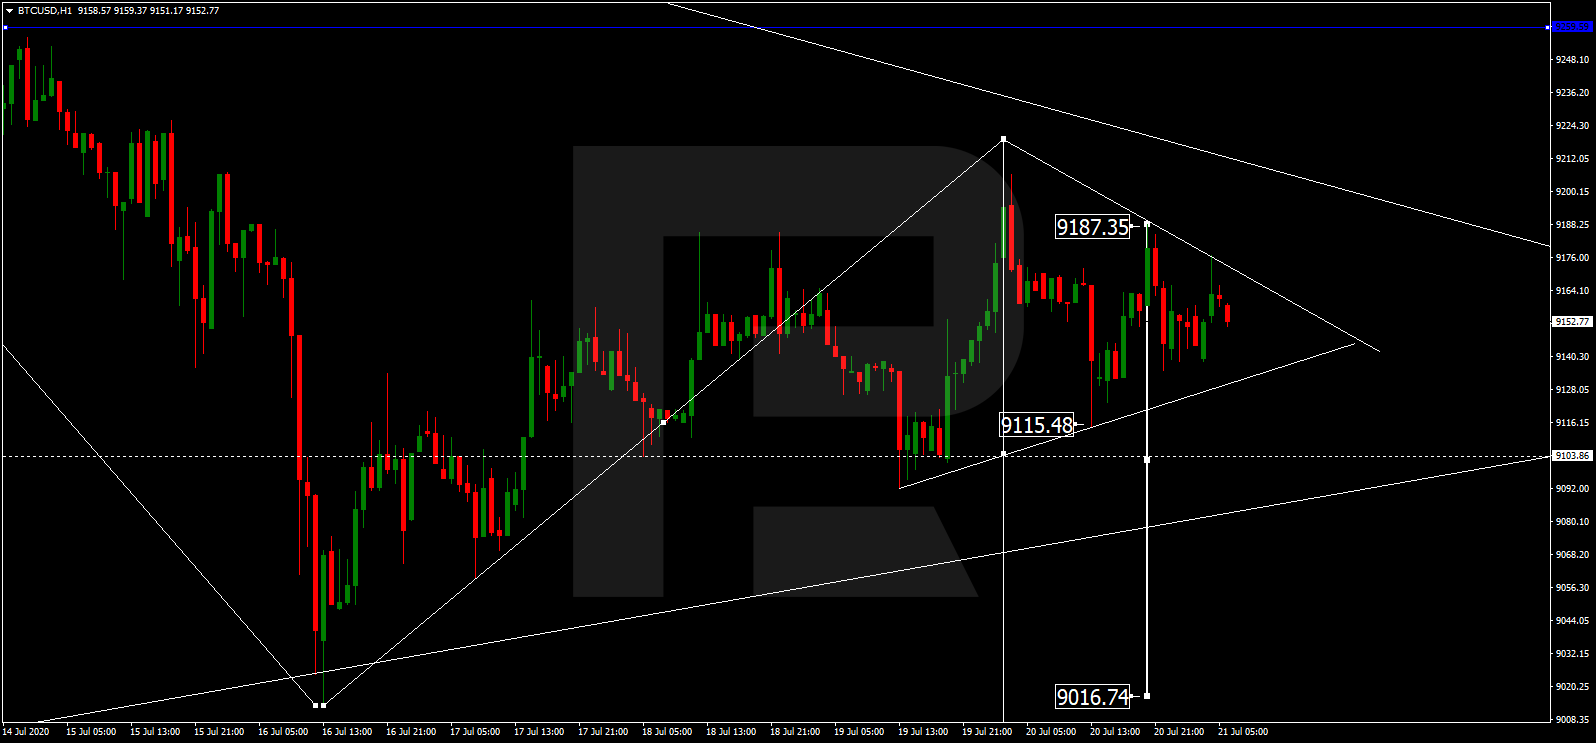
BTCUSD, “Bitcoin vs US Dollar”
After finishing the descending wave at 9115.00, BTCUSD is trying to grow towards to reach 9260.00. After that, the instrument may form a new descending structure to break 9100.00 and then continue moving inside the downtrend with the target at 8700.00.
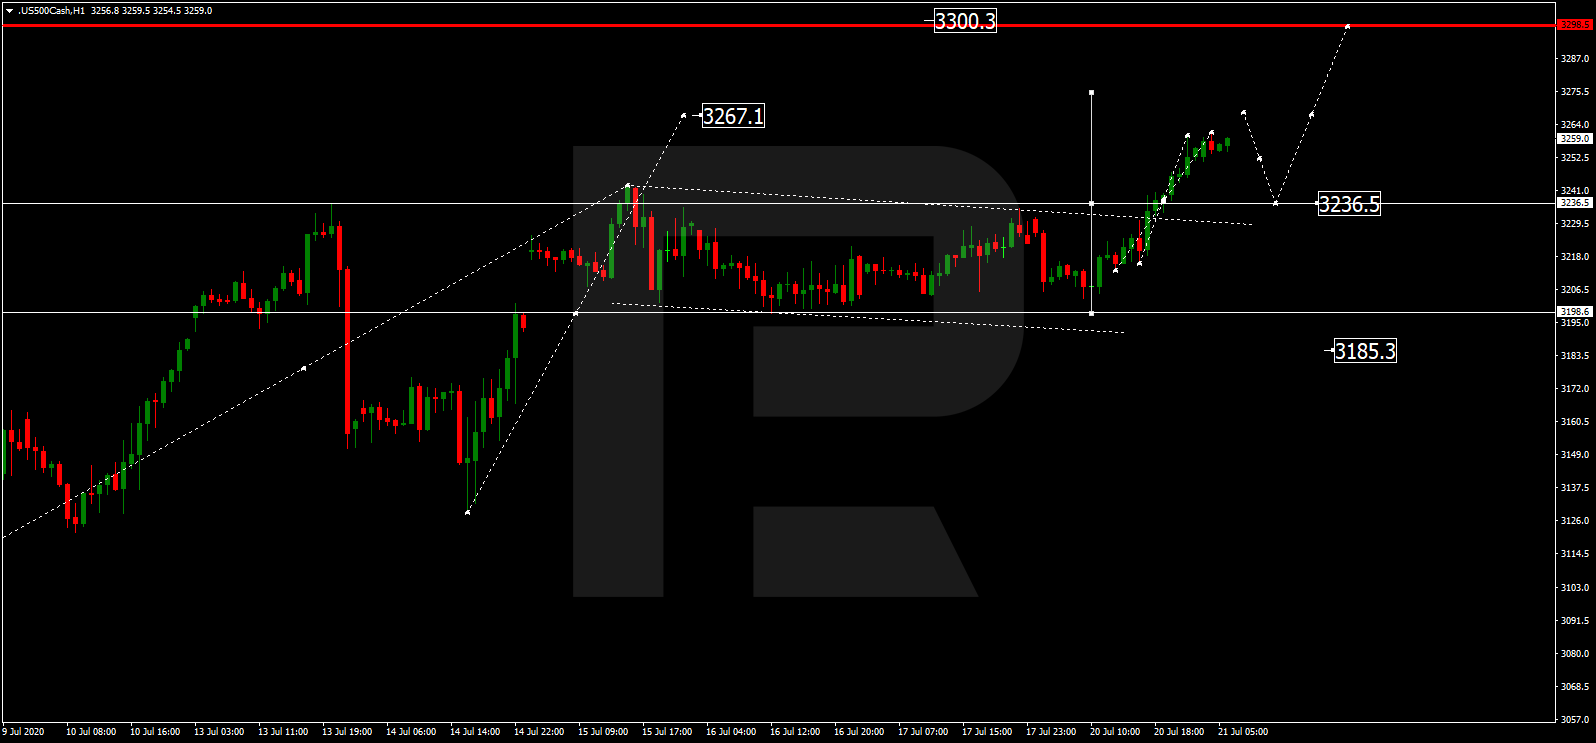
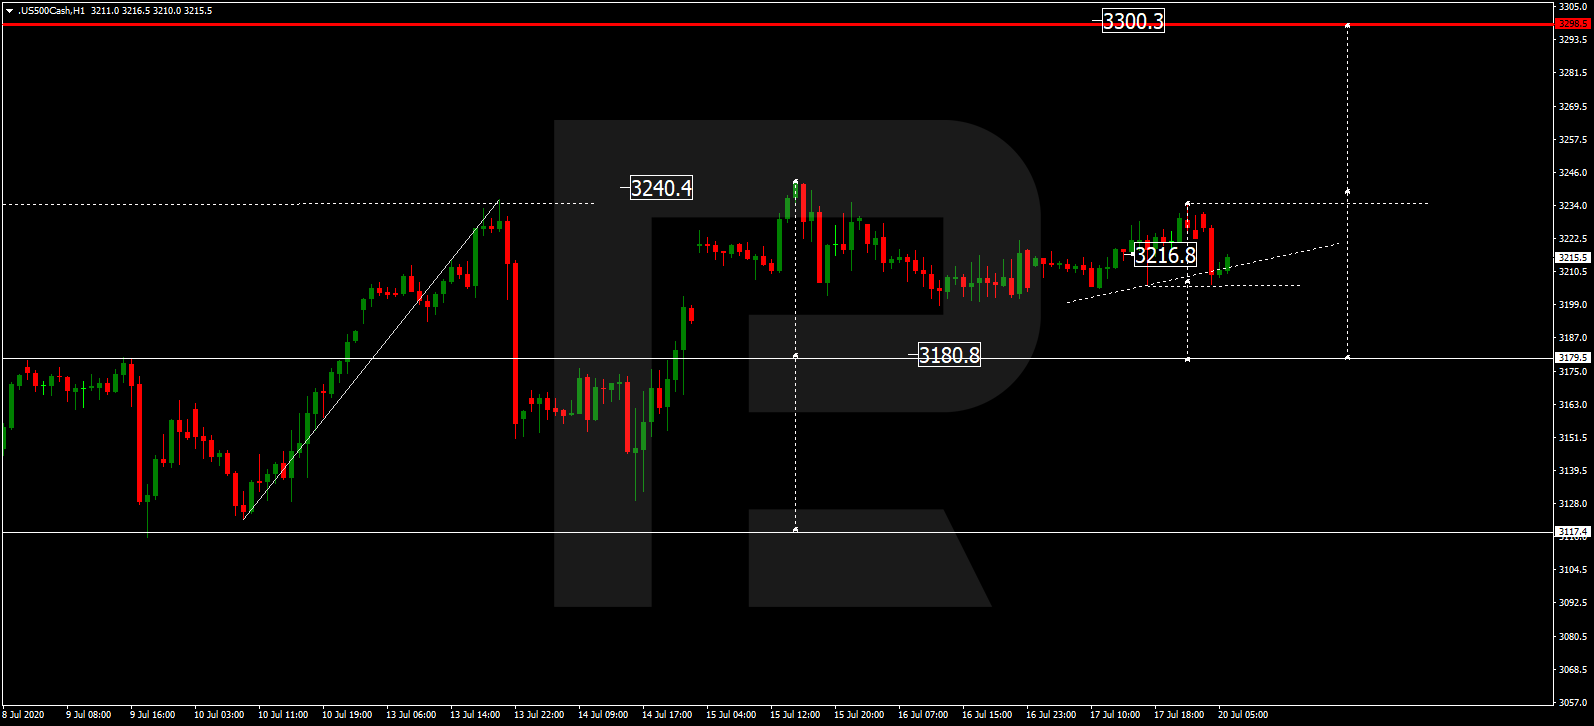
S&P 500
After breaking 3236.5 to the upside, the S&P 500 Index continues growing towards 3267.1. Later, the market may correct to return to 3236.5 and then continue trading upwards to reach 3300.3. After that, the instrument may start a new decline with the target at 3111.1.