Japanese Candlesticks Analysis 20.07.2020 (GOLD, NZDUSD, GBPUSD)
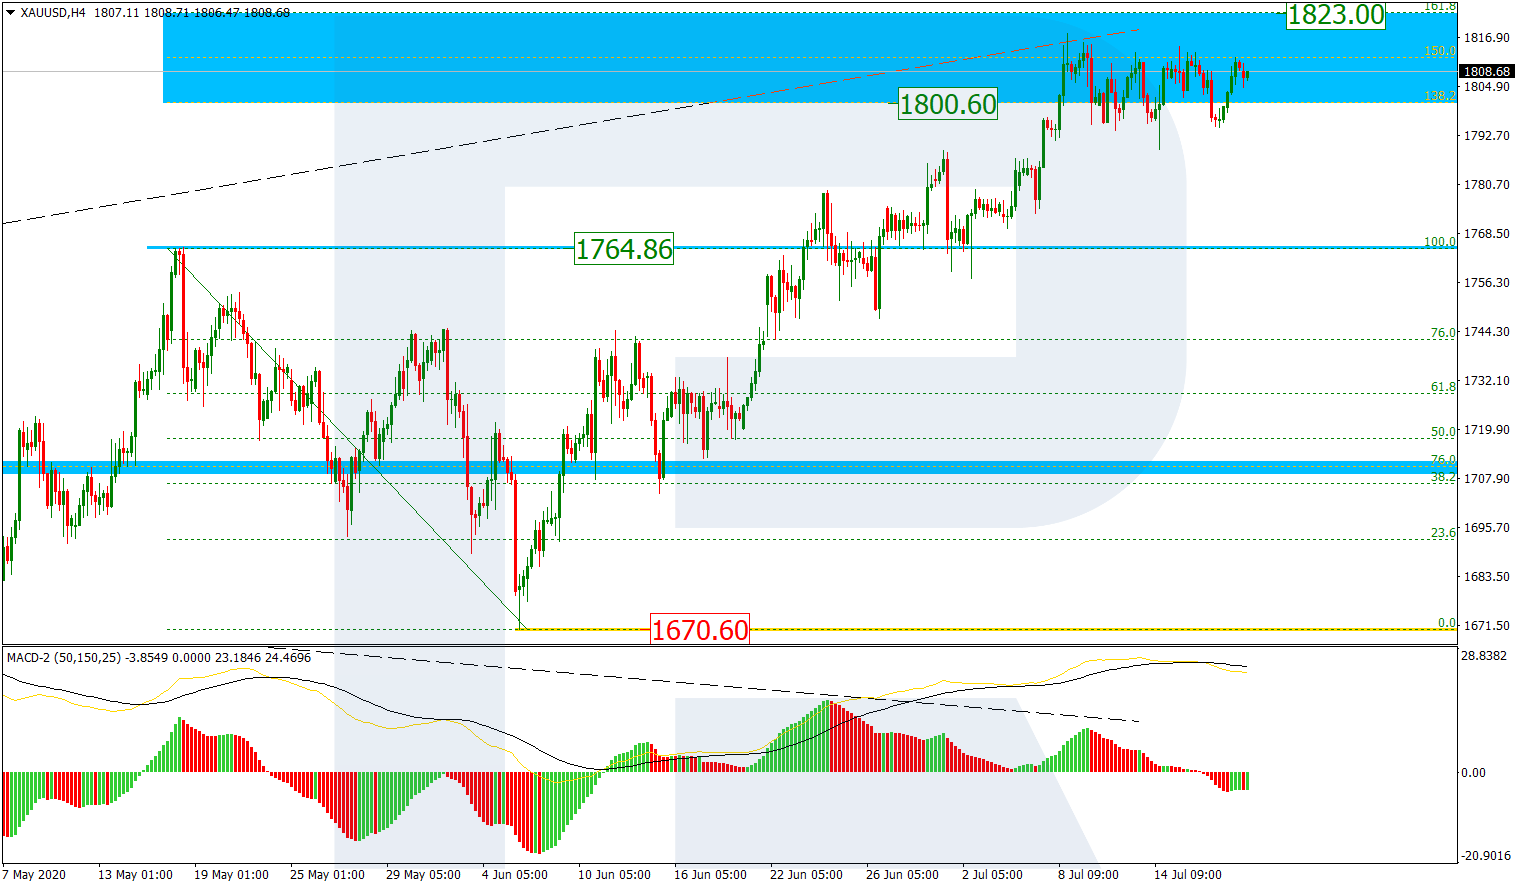
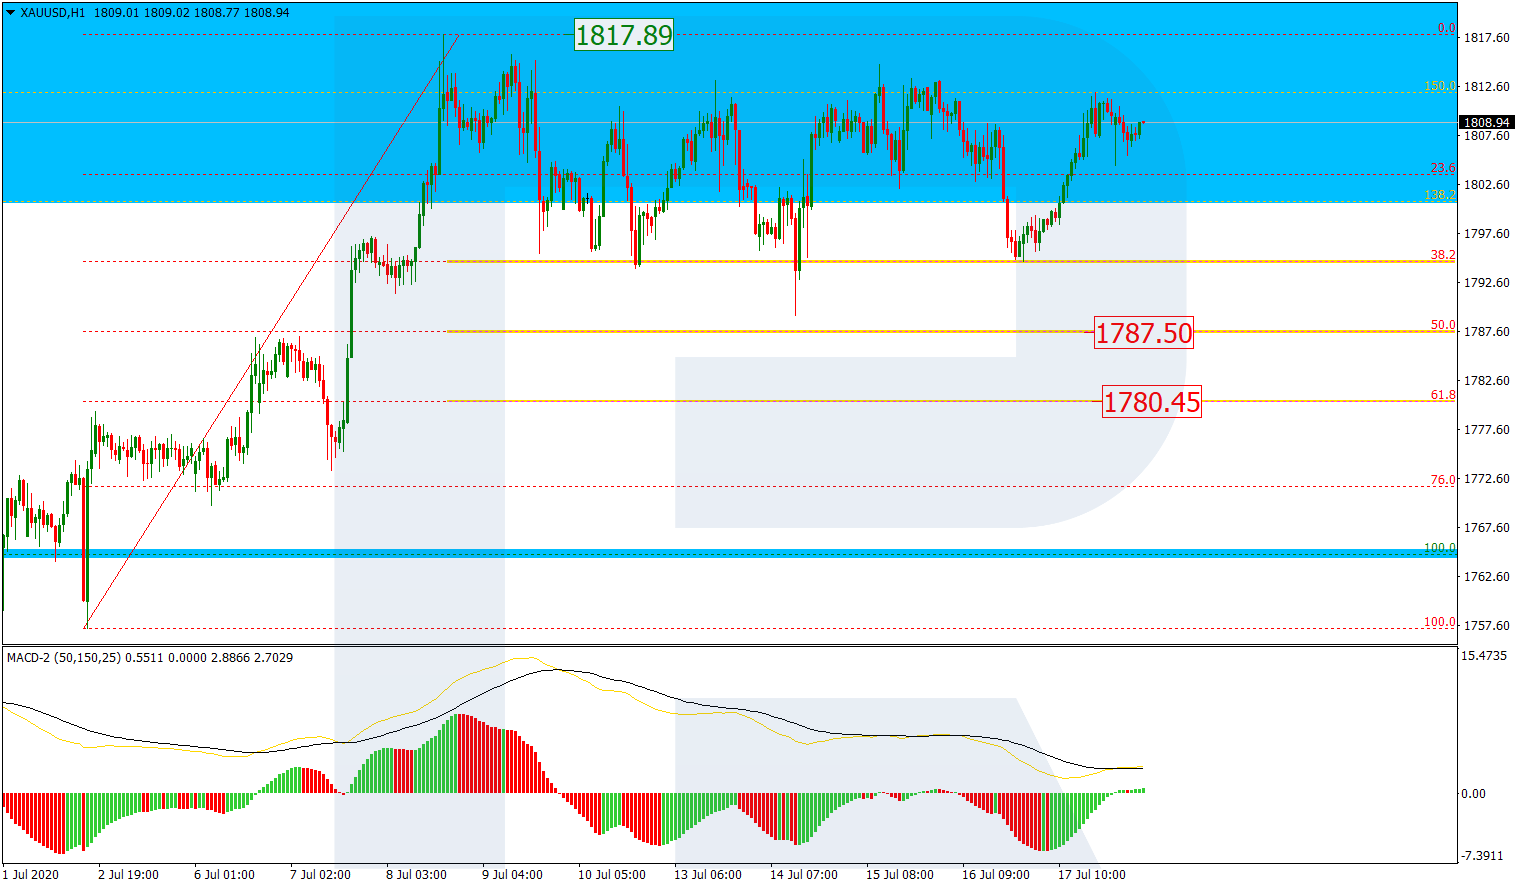
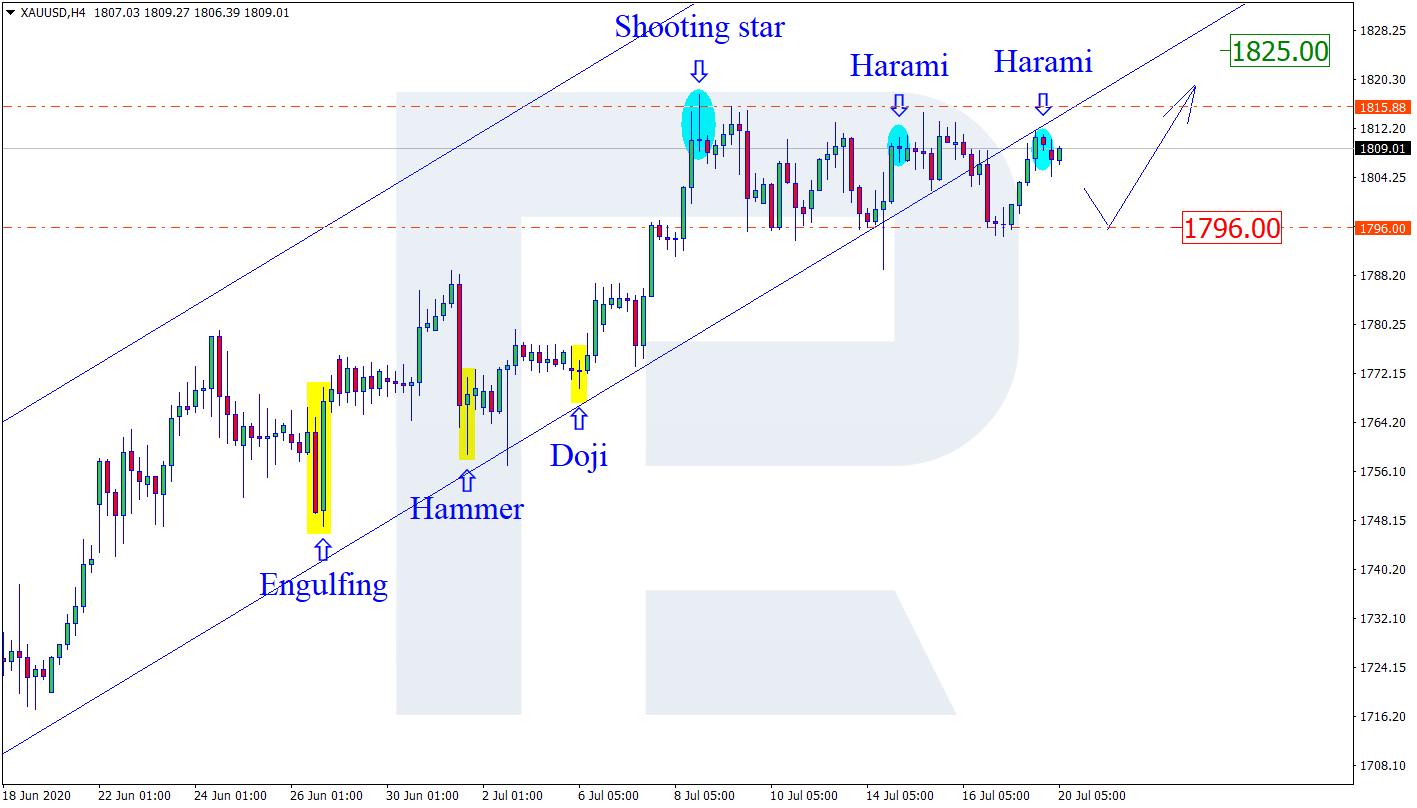
XAUUSD, “Gold vs US Dollar”
As we can see in the H4 chart, the asset continues moving sideways within the uptrend. After finishing a Harami reversal pattern not far from the resistance level, XAUUSD is expected to reverse. In this case, the downside target may be the support area at 1796.00. After completing the pullback, the pair may resume trading upwards. In this case, the upside target is at 1825.00.

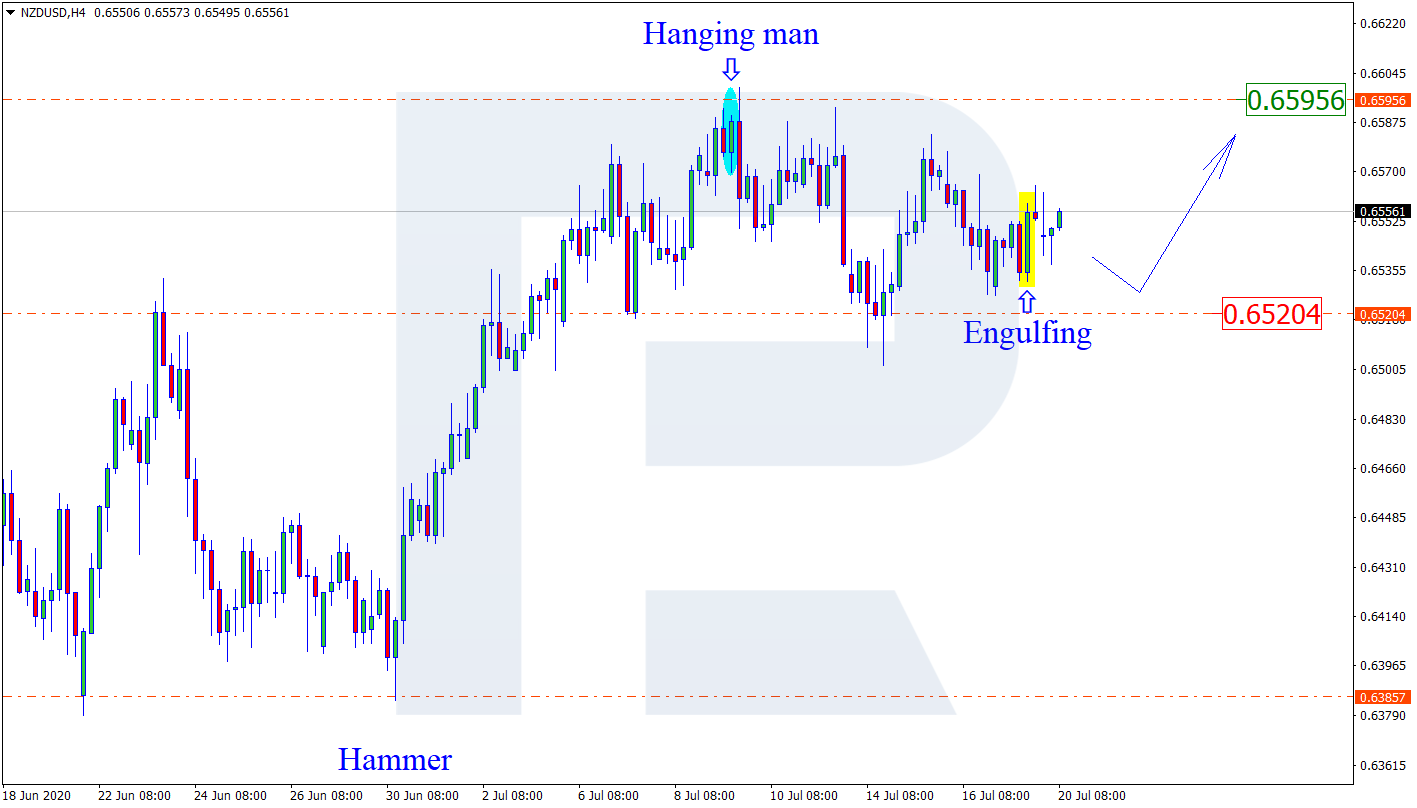
NZDUSD, “New Zealand vs. US Dollar”
As we can see in the H4 chart, the sideways tendency continues. After forming an Engulfing pattern, NZDUSD may reverse and start a new pullback towards the support area at 0.6520. Later, the pair is expected to finish its sideways movement and resume growing. in this case, the upside target may be at 0.6595.
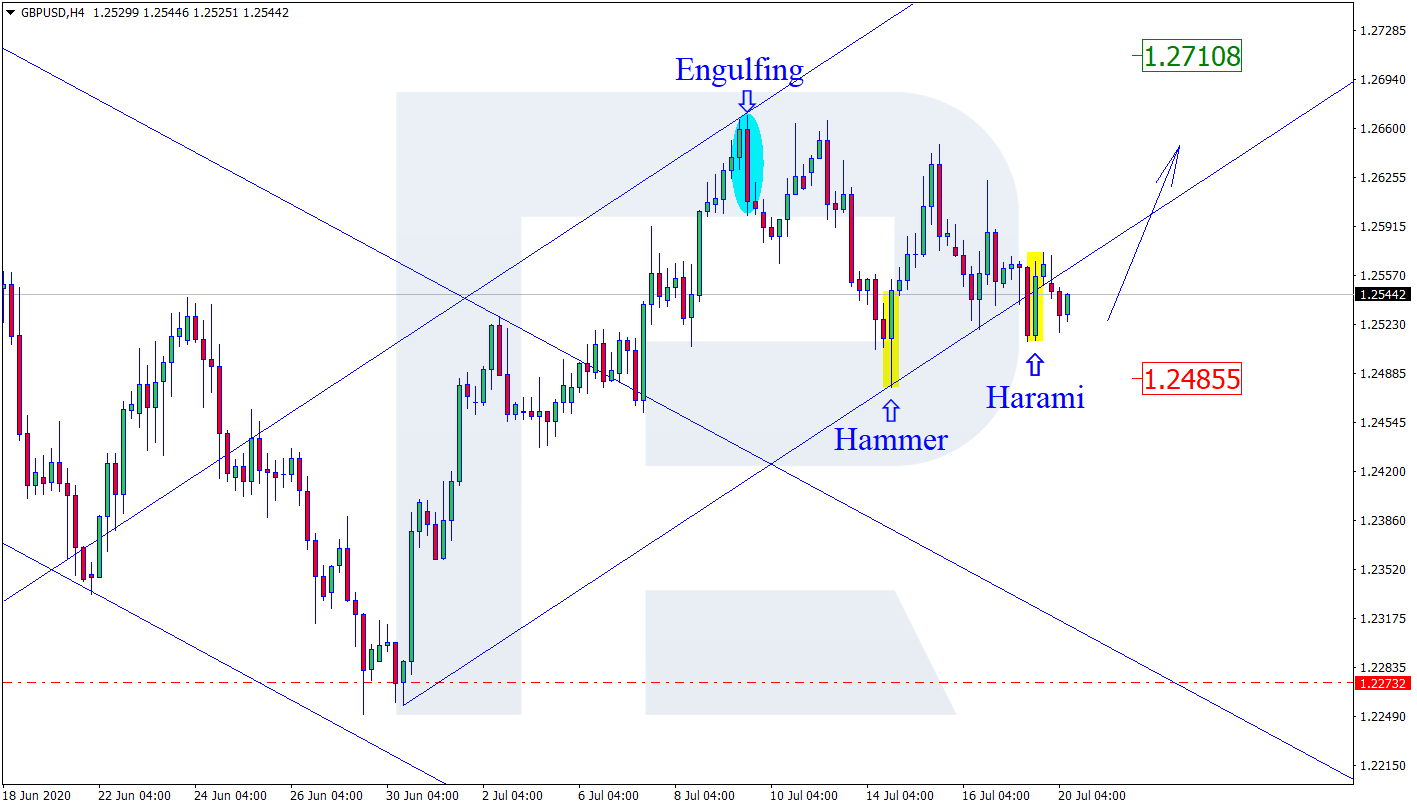
GBPUSD, “Great Britain Pound vs US Dollar”
As we can see in the H4 chart, the pair is forming the ascending channel. After forming a Harami pattern close to the downside border, GBPUSD has started reversing. At the moment, the price is expected to continue trading upwards. In this case, the upside target remains at 1.2710. However, there might be another scenario, according to which the price may fall to return to 1.2485.