rfxsignals December 29, 2020 No Comments

Japanese Candlesticks Analysis 29.12.2020 (GOLD, NZDUSD, GBPUSD)

Japanese Candlesticks Analysis 29.12.2020 (GOLD, NZDUSD, GBPUSD)

29.12.2020

XAUUSD, “Gold vs US Dollar”

As we can see in the H4 chart, the ascending tendency continues. Right now, after forming several reversal patterns, such as EngulfingDoji, and Harami, close to the support area, XAUUSD may reverse and resume growing towards the resistance level. In this case, the upside target will be at 1925.00. At the same time, an opposite scenario implies that the price may start another decline to return to 1850.00 before resuming its growth.

XAUUSD
Risk Warning: the result of previous trading operations do not guarantee the same results in the future

NZDUSD, “New Zealand vs. US Dollar”

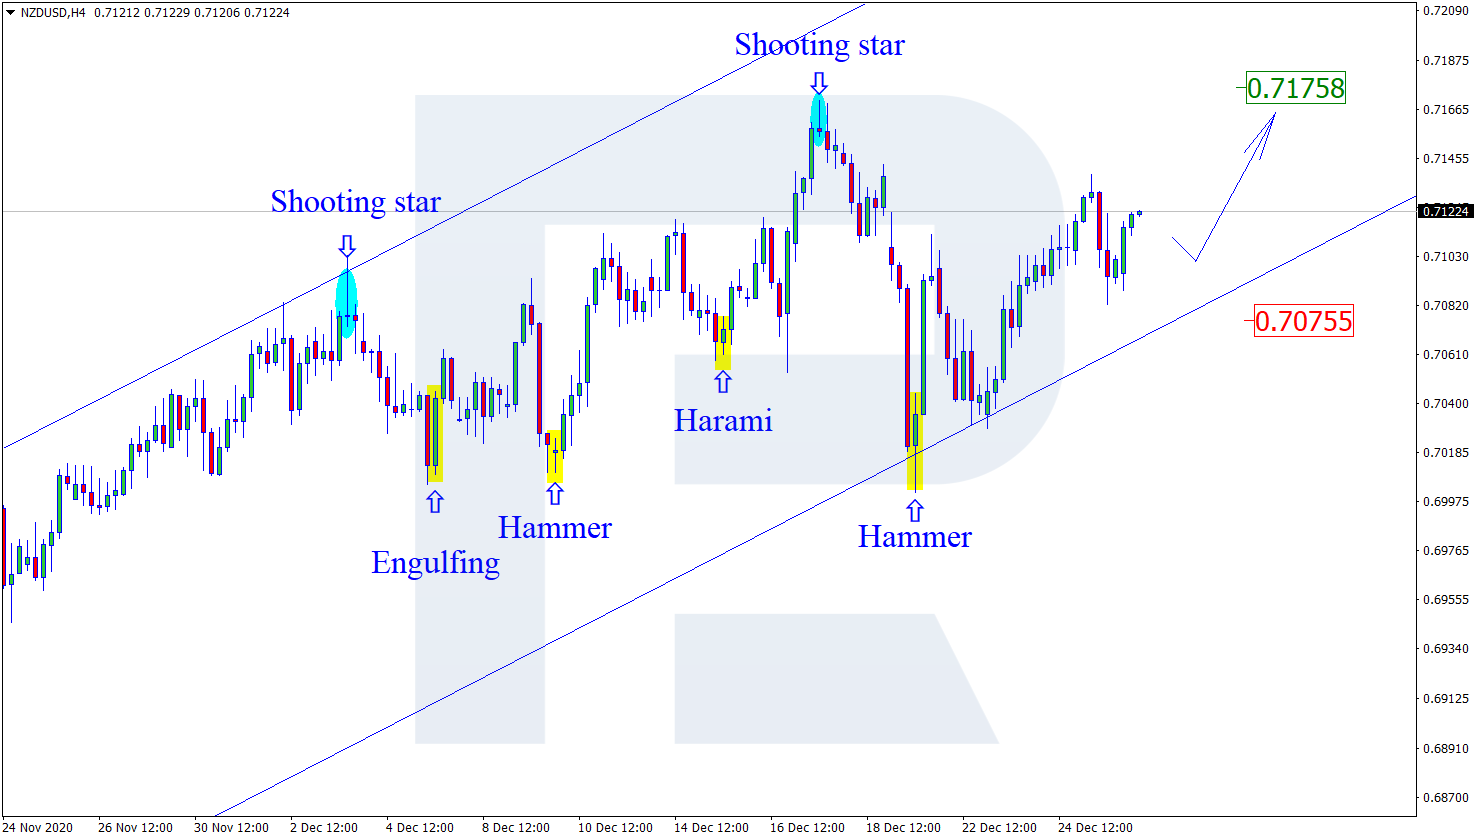
As we can see in the H4 chart, the pair is forming another rising impulse. Right now, after forming a Hammer pattern close to the horizontal support level, NZDUSD is still reversing. The upside target remains at the resistance area at 0.7175. However, an alternative scenario implies that the price may start a new pullback towards 0.7055 before resuming the ascending tendency.
NZDUSD
Risk Warning: the result of previous trading operations do not guarantee the same results in the future

GBPUSD, “Great Britain Pound vs US Dollar”

As we can see in the H4 chart, the asset is still correcting within the uptrend. Right now, after forming several reversal patterns, such as Hanging Man, not far from the resistance area, GBPUSD is reversing. The downside target is at 1.3390. After that, the instrument may rebound from the support level and resume moving upwards. Still, there might be an alternative scenario, according to which the asset may continue growing to reach 1.3625 without correcting towards the support area.

GBPUSD

rfxsignals December 29, 2020 No Comments

Ichimoku Cloud Analysis 29.12.2020 (EURJPY, CADCHF, ETHUSD)

Ichimoku Cloud Analysis 29.12.2020 (EURJPY, CADCHF, ETHUSD)

29.12.2020

EURJPY, “Euro vs Japanese Yen”

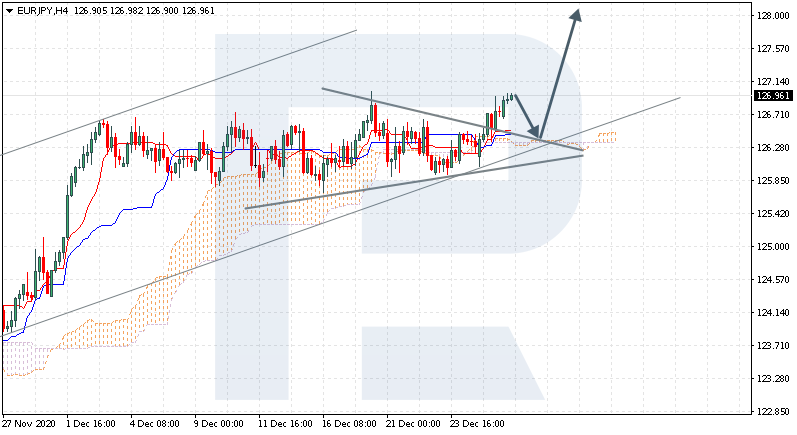
EURJPY is trading at 126.96; the instrument is moving above Ichimoku Cloud, thus indicating an ascending tendency. The markets could indicate that the price may test the cloud’s upside border at 126.45 and then resume moving upwards to reach 128.05. Another signal in favor of further uptrend will be a rebound from the upside border of a Triangle pattern. However, the bullish scenario may no longer be valid if the price breaks the cloud’s downside border and fixes below 125.75. In this case, the pair may continue falling towards 124.85.

EURJPY
Risk Warning: the result of previous trading operations do not guarantee the same results in the future

CADCHF, “Canadian Dollar vs Swiss Franc”

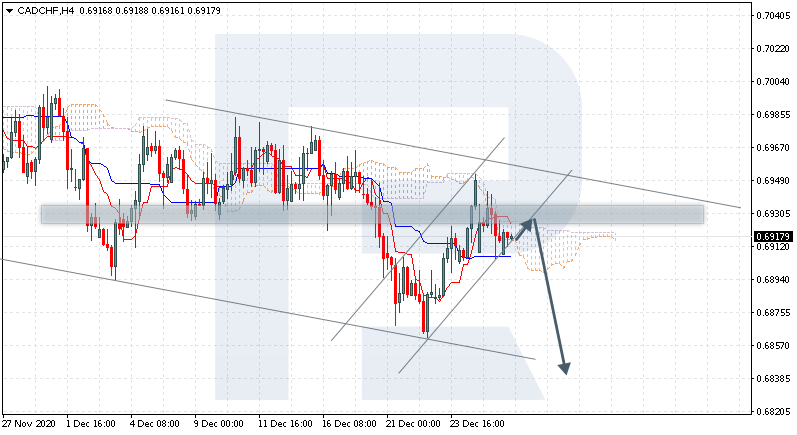
CADCHF is trading at 0.6917; the instrument is moving inside Ichimoku Cloud, thus indicating a sideways tendency. The markets could indicate that the price may test the cloud’s upside border at 0.6925 and then resume moving downwards to reach 0.6845. Another signal in favor of further downtrend will be a rebound from the rising channel’s downside border. However, the bearish scenario may no longer be valid if the price breaks the cloud’s upside border and fixes above 0.6945. In this case, the pair may continue growing towards 0.7035.

CADCHF
Risk Warning: the result of previous trading operations do not guarantee the same results in the future

ETHUSD, “Ethereum vs US Dollar”

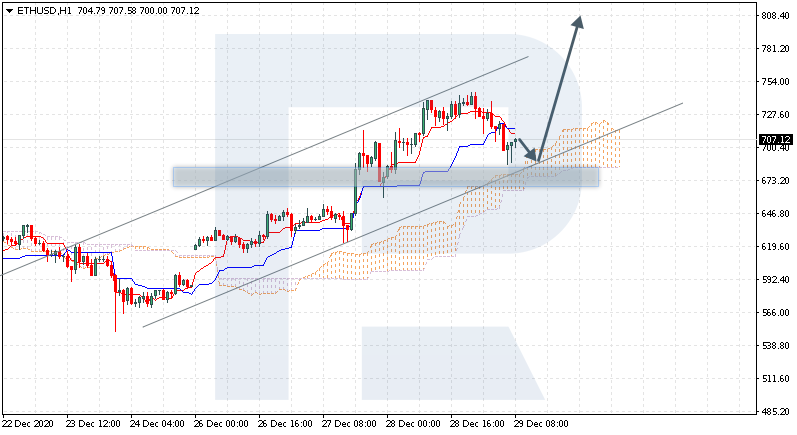
ETHUSD is trading at 707.12; the instrument is moving above Ichimoku Cloud, thus indicating an ascending tendency. The markets could indicate that the price may test the cloud’s upside border at 685.65 and then resume moving upwards to reach 810.05. Another signal in favor of further uptrend is a rebound from the rising channel’s downside border. However, the bullish scenario may no longer be valid if the price breaks the cloud’s downside border and fixes below 645.05. In this case, the pair may continue falling towards 575.05.

ETHUSD
Risk Warning: the result of previous trading operations do not guarantee the same results in the future

rfxsignals December 29, 2020 No Comments

The Euro is growing. Overview for 29.12.2020

The Euro is growing. Overview for 29.12.2020

29.12.2020

EURUSD continues rising amid global positive.

The major currency pair intends to continue growing on Tuesday morning. The current quote for the instrument is 1.2240.

Financial markets are overwhelmed with positive emotions after US President Donald Trump signed the budget for 2021, $900 billion of which is a stimulus package. Not as if it was a surprise but market players, who returned to the market for a short period between Christmas and New Year, duly appreciated the good news. A thin pre-New Year market only inspires volatility growth.

Another positive news for bulls is the start of the vaccination against the coronavirus in Europe. Investors have high hopes for it, although the logic says that a lot of time will pass before the vaccination proves to be effective.

In addition to that, there are always risks of new aggressive COVID-19 strains. However, right now market players are trying to stay focused on positive news.

No statistics worth paying attention to have been published recently. In today’s economic calendar, one should pay attention only to US Treasury Currency Report but investors are highly unlikely to ignore it. Prices will probably continue moving by inertia driven by a positive attitude on the market.

rfxsignals December 29, 2020 No Comments

Fibonacci Retracements Analysis 29.12.2020 (EURUSD, USDJPY)

Fibonacci Retracements Analysis 29.12.2020 (EURUSD, USDJPY)

29.12.2020

EURUSD, “Euro vs US Dollar”

As we can see in the H4 chart, after a divergence on MACD, EURUSD is stuck within the post-correctional extension area between 138.2% and 161.8% fibo at 1.2167 and 1.2262 respectively. The first descending impulse tried to reach 23.6% fibo at 1.2115 but failed. If the asset fails to break the high at 1.2273, it may start a new decline towards 38.2% and 50.0% fibo at 1.2018 and 1.1937 respectively. However, if the price does break the high, the pair may continue growing to reach the long-term fractal high at 1.2555.

EURUSD_H4
Risk Warning: the result of previous trading operations do not guarantee the same results in the future

The H1 chart shows potential upside targets. The asset has already reached 76.0% fibo. If the price breaks the high at 1.2273, it may move upwards to reach the post-correctional extension area between 138.2% and 161.8% fibo at 1.2327 and 1.2362 respectively. On the other hand, if EURUSD breaks the local low at 1.2130 again, the asset may continue the mid-term correction to the downside.

EURUSD_H1
Risk Warning: the result of previous trading operations do not guarantee the same results in the future

USDJPY, “US Dollar vs. Japanese Yen”

As we can see in the H4 chart, the pair is trying to start a new correction to the upside after a convergence on MACD. The correctional targets may be 23.6%, 38.2%, and 50.0% fibo at 104.95, 106.25, and 107.28 respectively. After breaking the low at 102.87, USDJPY may continue falling towards the fractal low at 101.18.

USDJPY_H4
Risk Warning: the result of previous trading operations do not guarantee the same results in the future

In the H1 chart, the pair is consolidating around 23.6% fibo; this movement may be considered as a correction. If the price breaks this range to the upside, the market may resume trading upwards to reach 38.2%, 50.0%, and 61.8% fibo at 103.94, 104.28, and 104.61 respectively.

USDJPY_H1
Risk Warning: the result of previous trading operations do not guarantee the same results in the future

rfxsignals December 28, 2020 No Comments

Daily Free Forex Signals For 28/12/2020

Here your going to see Daily Free Forex Signals For 28/12/2020 to free forex signal alert from our kitkat trading system and other trading logic’s .we provide like this free forex signals from 2012 on wards with more than 50,000 traders around the world .The free forex signals have 70 to 85% quality always .we give for you a note as maximum focus take profit 1 as your target and must use stop loss values .if you have any other query’s please visit our live chat or email option

GBPNZD SELL-1.90463
SL-1.908474
TP1-1.903006
TP2-1.901547


USDJPY SELL-103.498
SL-103.753
TP1-103.344
TP2-103.210


GBPAUD SELL-1.78109
SL-1.78660
TP1-1.77961
TP2-1.77797


EURAUD BUY-1.605454
SL-1.602856
TP1-1.606996
TP2-1.608589


USDCAD SELL-1.28248
SL-1.286605
TP1-1.280874
TP2-1.279402


USDCHF SELL-0.888884
SL-0.892156
TP1-0.88735
TP2-0.88588


rfxsignals December 28, 2020 No Comments

Forex Technical Analysis & Forecast 28.12.2020

Forex Technical Analysis & Forecast 28.12.2020

28.12.2020

EURUSD, “Euro vs US Dollar”

After breaking 1.2207, EURUSD is expected to continue growing towards 1.2240. After that, the instrument may correct to return to 1.2207 and then start another growth with the target at 1.2275.

EURUSD
Risk Warning: the result of previous trading operations do not guarantee the same results in the future

GBPUSD, “Great Britain Pound vs US Dollar”

GBPUSD is still consolidating below 1.3614. Possibly, the pair may expand the range up to 1.3671 and then down to 1.3464 to test it from above. Later, the market may form one more ascending structure with the target at 1.3781.

GBPUSD
Risk Warning: the result of previous trading operations do not guarantee the same results in the future

USDRUB, “US Dollar vs Russian Ruble”

USDRUB is still falling towards the first target at 73.70. After that, the instrument may start another correction to reach 74.84 and then resume trading downwards with the short-term target at 72.22.

USDRUB
Risk Warning: the result of previous trading operations do not guarantee the same results in the future

USDJPY, “US Dollar vs Japanese Yen”

USDJPY is falling towards 103.22. Possibly, the pair may break this level to the downside and then continue trading downwards with the short-term target at 102.70.

USDJPY
Risk Warning: the result of previous trading operations do not guarantee the same results in the future

USDCHF, “US Dollar vs Swiss Franc”

USDCHF is still consolidating above 0.8898. Today, the pair may grow to reach 0.8925 and then start another correction with the target at 0.8880.

USDCHF
Risk Warning: the result of previous trading operations do not guarantee the same results in the future

AUDUSD, “Australian Dollar vs US Dollar”

AUDUSD is still growing towards 0.7622. Later, the market may correct to reach 0.7568 and then resume trading upwards with the target at 0.7674.

AUDUSD
Risk Warning: the result of previous trading operations do not guarantee the same results in the future

BRENT

Brent is still forming a consolidation range around 51.36. Possibly, the asset may expand the range up to 52.30 and then fall to test 51.36 from above. After that, the instrument may resume trading upwards with the target at 53.50. However, if the price breaks 50.80 to the downside, the market may correct towards 50.10 and then form one more ascending structure to reach the above-mentioned target.

BRENT
Risk Warning: the result of previous trading operations do not guarantee the same results in the future

XAUUSD, “Gold vs US Dollar”

After breaking 1883.83 to the upside, Gold is expected to continue the correction towards 1907.00; by now, it has already reached the short-term target at 1900.10. Possibly, today the metal may correct towards 1879.70 and then resume trading upwards to reach 1907.00.

GOLD
Risk Warning: the result of previous trading operations do not guarantee the same results in the future

BTCUSD, “Bitcoin vs US Dollar”

BTCUSD continues trading upwards. After breaking 24700.00, the instrument has reached the short-term target at 27400.00; right now, it is consolidating around the latter level. Possibly, the asset may break the range to the downside and then resume trading downwards to reach 23000.00. Later, the market may form one more ascending structure with the target at 28500.00.

BITCOIN
Risk Warning: the result of previous trading operations do not guarantee the same results in the future

S&P 500

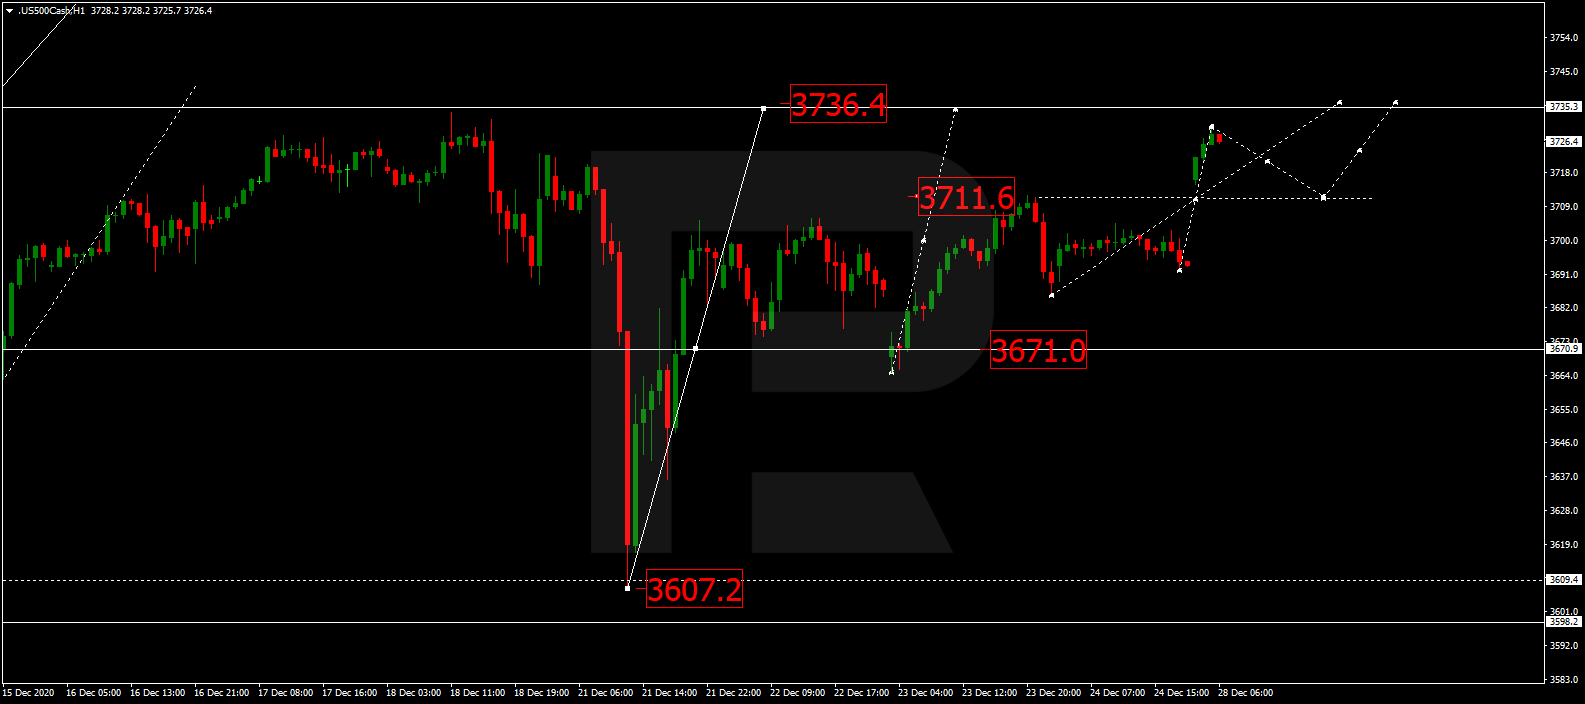
After breaking the consolidation range to the upside, the S&P index is expected to grow and reach 3735.3. Later, the market may start a new decline with the first target at 3671.0.

S&P 500

rfxsignals December 28, 2020 No Comments

Murrey Math Lines 28.12.2020 (EURUSD, GBPUSD)

Murrey Math Lines 28.12.2020 (EURUSD, GBPUSD)

28.12.2020

EURUSD, “Euro vs. US Dollar”

As we can see in the H4 chart, EURUSD is moving not far from the resistance at 8/8. In this case, the price is expected to rebound from this level and then resume falling towards the support at 6/8. However, this scenario may no longer be valid if the price breaks 8/8 to the upside. After that, the instrument may continue trading upwards to reach the resistance at +1/8.

EURUSD_H4
Risk Warning: the result of previous trading operations do not guarantee the same results in the future

In the M15 chart, the pair may break the downside line of the VoltyChannel indicator and, as a result, continue its decline.

EURUSD_M15
Risk Warning: the result of previous trading operations do not guarantee the same results in the future

GBPUSD, “Great Britain Pound vs US Dollar”

In the H4 chart, GBPUSD is moving above the 200-day Moving Average, thus confirming an ascending tendency. In this case, the price is expected to continue moving upwards to reach the resistance at 8/8. However, this scenario may no longer be valid if the price breaks 7/8 to the downside. After that, the instrument may reverse and fall to reach the closest support at 6/8.

GBPUSD_H4
Risk Warning: the result of previous trading operations do not guarantee the same results in the future

As we can see in the M15 chart, the price has broken the upside line of the VoltyChannel indicator and, as a result, may continue growing.

GBPUSD_M15
Risk Warning: the result of previous trading operations do not guarantee the same results in the future

rfxsignals December 28, 2020 No Comments

Japanese Candlesticks Analysis 28.12.2020 (EURUSD, USDJPY, EURGBP)

Japanese Candlesticks Analysis 28.12.2020 (EURUSD, USDJPY, EURGBP)

28.12.2020

EURUSD, “Euro vs. US Dollar”

As we can see in the H4 chart, the ascending tendency continues. Right now, after forming several reversal patterns, such as Engulfing, close to the support level, EURUSD may reverse in the form of another rising impulse. The upside target may be at 1.2325. After that, the pair may continue trading upwards. However, an alternative scenario implies that the price may start a new decline towards 1.2175 before resuming the uptrend.

EURUSD
Risk Warning: the result of previous trading operations do not guarantee the same results in the future

USDJPY, “US Dollar vs. Japanese Yen”

As we can see in the H4 chart, after testing the horizontal support level and forming a Hammer pattern, USDJPY is reversing. The correctional target may be near the descending channel’s upside border at 103.75. After finishing the correction, the asset may continue trading downwards to reach the support area at 102.90.

USDJPY
Risk Warning: the result of previous trading operations do not guarantee the same results in the future

EURGBP

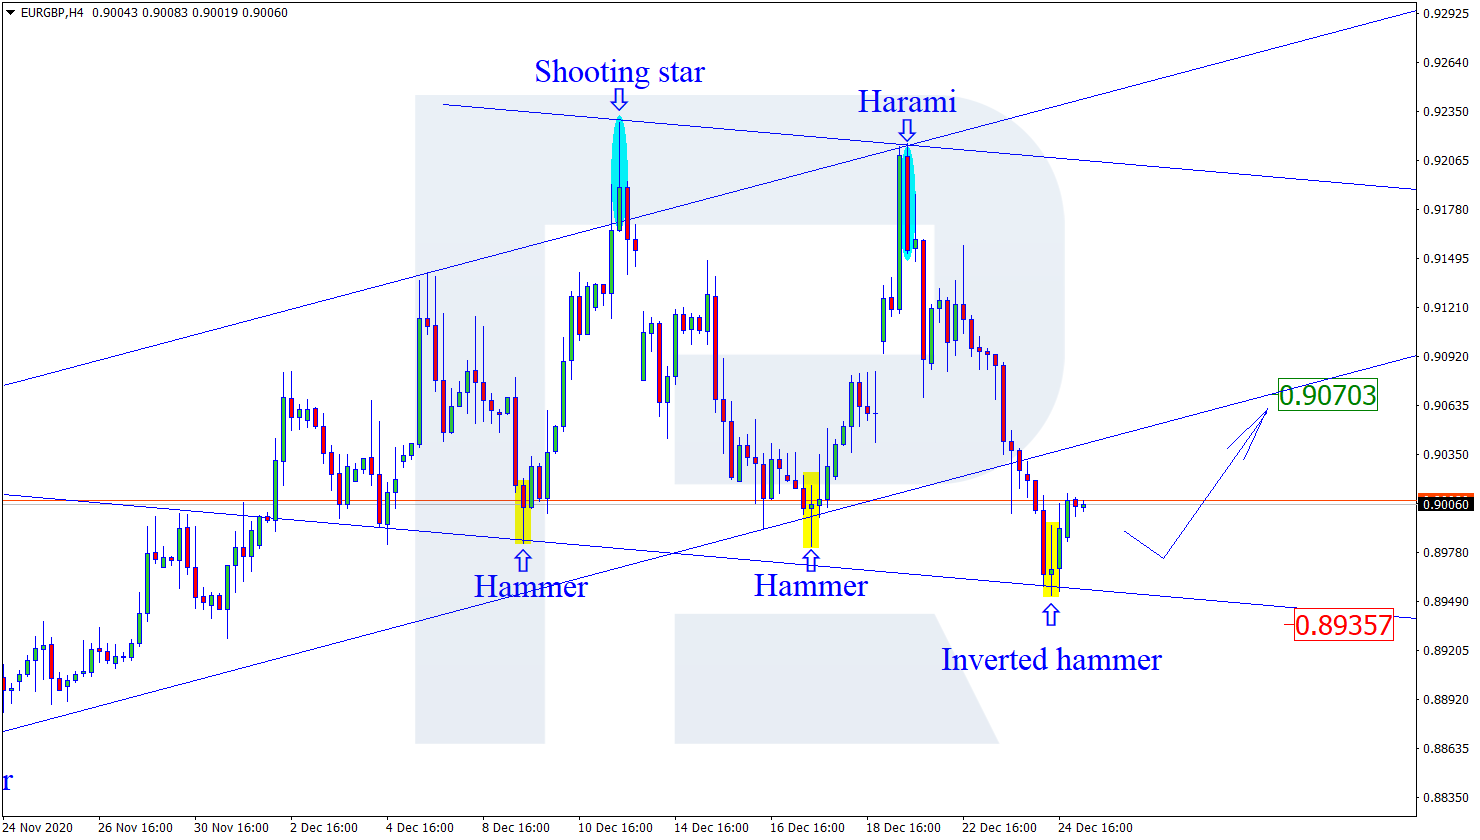
As we can see in the H4 chart, after forming several reversal patterns, such as Inverted Hammer, not far from the support level, EURGBP is reversing and correcting. In this case, the upside target may be at 0.9070. However, judging by previous movements, the pair may yet start another decline to reach 0.8935 without reversing.

EURGBP
Risk Warning: the result of previous trading operations do not guarantee the same results in the future

Ichimoku Cloud Analysis 28.12.2020 (EURUSD, USDJPY, XAUUSD)

Ichimoku Cloud Analysis 28.12.2020 (EURUSD, USDJPY, XAUUSD)

28.12.2020

EURUSD, “Euro vs US Dollar”

EURUSD is trading at 1.2224; the instrument is moving above Ichimoku Cloud, thus indicating an ascending tendency. The markets could indicate that the price may test the cloud’s downside border at 1.2175 and then resume moving upwards to reach 1.2355. Another signal in favor of further uptrend will be a rebound from the support level. However, the bullish scenario may be canceled if the price breaks the cloud’s downside border and fixes below 1.2135. In this case, the pair may continue falling towards 1.2055. To confirm further growth, the asset must break the upside border of a Triangle pattern and fix above 1.2265.

EURUSD
Risk Warning: the result of previous trading operations do not guarantee the same results in the future

USDJPY, “US Dollar vs Japanese Yen”

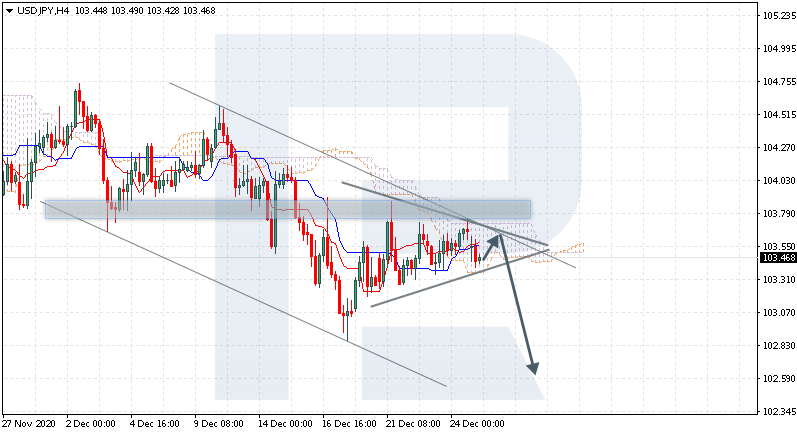
USDJPY is trading at 103.46; the instrument is moving inside Ichimoku Cloud, thus indicating a sideways tendency. The markets could indicate that the price may test the cloud’s upside border at 103.65 and then resume moving downwards to reach 102.60. Another signal in favor of further downtrend will be a rebound from the descending channel’s upside border. However, the bearish scenario may no longer be valid if the price breaks the cloud’s upside border and fixes above 104.05. In this case, the pair may continue growing towards 104.95. To confirm further decline, the asset must break the downside border of a Triangle pattern and fix below 103.10.

USDJPY
Risk Warning: the result of previous trading operations do not guarantee the same results in the future

XAUUSD, “Gold vs US Dollar”

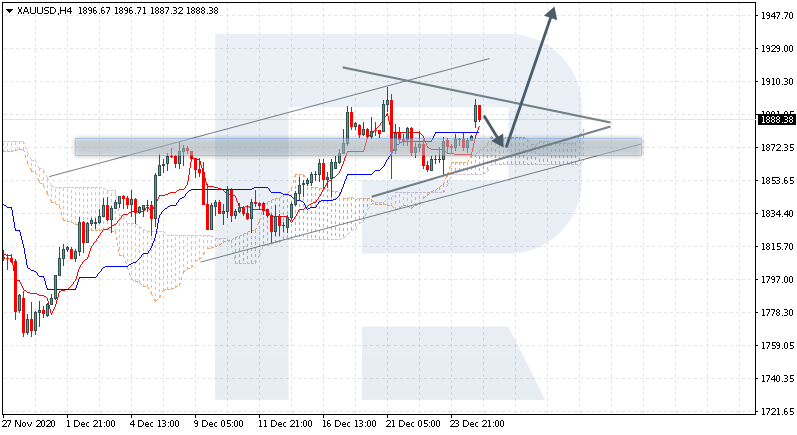
XAUUSD is trading at 1888.00; the instrument is moving above Ichimoku Cloud, thus indicating an ascending tendency. The markets could indicate that the price may test the cloud’s downside border at 1875.00 and then resume moving upwards to reach 1950.00. Another signal in favor of further uptrend will be a rebound from the downside border of the Triangle patter. However, the bullish scenario may no longer be valid if the price breaks the cloud’s downside border and fixes below 1845.00. In this case, the pair may continue falling towards 1805.00. To confirm further growth, the asset must break the pattern’s upside border and fix above 1915.00.

XAUUSD
Risk Warning: the result of previous trading operations do not guarantee the same results in the future

rfxsignals December 28, 2020 No Comments

The Pound is consolidating. Overview for 28.12.2020

The Pound is consolidating. Overview for 28.12.2020

28.12.2020

GBPUSD stopped growing; after the Christmas celebration, the asset is consolidating.

The British Pound slowed down its growth against the USD due to the Christmas calmness on the market. The current quote for the instrument is 1.3566.

So, the United Kingdom and the European Union managed to make a deal on the trade agreement just days shy of the deadline. The agreement, which has 1,246 pages, covers aspects of fishing, borders, and arguable points of trade relations. Starting from December 31st, when London is scheduled to exit the alliance, trade operations will be made without quotas and fees. However, it doesn’t cover services and financial proposals.

Probably, the catalysts for finding a final decision was the closure of the border between France and the United Kingdom due to a new strain of the coronavirus, which was considered by many as more aggressive and dangerous. It was a vivid picture of what might happen if the alliance countries had borders with the UK. Even if it didn’t happen, market players still had an excellent opportunity to see a possible collapse, which might have taken place without the Brexit agreement.

From now on, investors will have to go with the flow and just watch how the parties are going to fulfill their parts of the agreement. One can say almost certainly that there will be updates and revisions but they will deal with technical matters.

Reaching an agreement finally is a good sign for the Pound but later the British currency will bend with the wind.