rfxsignals December 24, 2020 No Comments

Daily Free Forex Signals For 24/12/2020

Here your going to see Daily Free Forex Signals For 24/12/2020 to free forex signal alert from our kitkat trading system and other trading logic’s .we provide like this free forex signals from 2012 on wards with more than 50,000 traders around the world .The free forex signals have 70 to 85% quality always .we give for you a note as maximum focus take profit 1 as your target and must use stop loss values .if you have any other query’s please visit our live chat or email option

USDCAD SELL-1.285533
SL-1.291476
TP1-1.284043
TP2-1.282341


NZDJPY BUY-73.4136
SL-72.852
TP1-73.5672
TP2-73.7352

AUDNZD BUY-1.068871
SL-1.0656
TP1-1.07044
TP2-1.07208


EURAUD BUY-1.609387
SL-1.605429
TP1-1.610882
TP2-1.612334


CADCHF SELL-0.690472
SL-0.693174
TP1-0.688913
TP2-0.687374


AUDCAD BUY-0.974831
SL-0.971258
TP1-0.976279
TP2-0.977856


AUDCHF BUY-0.673175
SL-0.669666
TP1-0.674667
TP2-0.6762

EURCHF BUY-1.08266
SL-1.07962
TP1-1.084193
TP2-1.08566

USDCAD SELL-1.284456
SL-1.288267
TP1-1.282949
TP2-1.281548

rfxsignals December 24, 2020 No Comments

The Pound is waiting for a miracle. Overview for 24.12.2020

The Pound is waiting for a miracle. Overview for 24.12.2020

24.12.2020

GBPUSD is rising on Thursday morning in anticipation of the results of the Brexit talks.

The British Pound is trying to keep its positive momentum against the USD. The current quote for the instrument is 1.3553.

Today’s economic calendar is rather poor in reports and numbers due to the Christmas eve in Catholic countries. However, the “weather” in the United Kingdom is pretty hot despite the end of December: The Brexit negotiators were discussing topical issues all night long and don’t seem to stop. In the meantime, the Brexit transition period is just two weeks away.

Last night, the media reported that the parties had reached some results in discussing the trade agreement.

Noteworthy is that London, which had been standing its ground relating to trade border and fishing all autumn, softened its stance by the end of December and said it was ready for a compromise. The only problem is that there is no time left for it.

It became known that there was a possibility to resume talks, at least the part that is left, the next year – this information came from French negotiators, who said that the EU had new requirements for London.

It seems like the Pound won’t have dull moments in the next 24 hours.

rfxsignals December 24, 2020 No Comments

Fibonacci Retracements Analysis 24.12.2020 (AUDUSD, USDCAD)

Fibonacci Retracements Analysis 24.12.2020 (AUDUSD, USDCAD)

24.12.2020

AUDUSD, “Australian Dollar vs US Dollar”

As we can see in the H4 chart, a divergence on MACD made AUDUSD start a new decline, which has already reached 23.6% fibo. However, at the moment the pair is correcting upwards to reach the post-correctional extension area between 138.2% and 161.8% fibo at 0.7574 and 0.7675 respectively, as well as the high at 0.7640. If the asset fails to break the high, the next descending wave will be heading towards 38.2%, 50.0%, and 61.8% fibo at 0.7392, 0.7316, and 0.7239 respectively.

AUDUSD_H4
Risk Warning: the result of previous trading operations do not guarantee the same results in the future

In the H1 chart, the ascending wave has reached 76.0% fibo. If the price breaks the high at 0.7640, AUDUSD may continue growing to enter the post-correctional extension area between 138.2% and 161.8% fibo at 0.7708 and 0.7750 respectively. On the other hand, a breakout of the fractal low at 0.7462 will result in further mid-term descending tendency.

AUDUSD_H1
Risk Warning: the result of previous trading operations do not guarantee the same results in the future

USDCAD, “US Dollar vs Canadian Dollar”

As we can see in the H4 chart, a convergence on MACD made USDCAD start a new correctional uptrend, which, after quickly reaching 38.2% fibo, was followed by a short-term correction. When the correction is over, the instrument may resume moving upwards to reach 50.0% and 61.8% fibo at 1.3039 and 1.3122. The support is the low at 1.2688.

USDCAD_H4
Risk Warning: the result of previous trading operations do not guarantee the same results in the future

The H1 chart shows a local correction after a rising impulse, which has already reached 50.0% and may continue in the form of a Triangle pattern. At the same time, one shouldn’t exclude another decline towards 61.8% fibo at 1.2791. If the price breaks the high at 1.2957, the correction will be over and the asset may resume growing.

USDCAD_H1
Risk Warning: the result of previous trading operations do not guarantee the same results in the future

rfxsignals December 24, 2020 No Comments

Ichimoku Cloud Analysis 24.12.2020 (CADCHF, XAUUSD, USDCAD)

Ichimoku Cloud Analysis 24.12.2020 (CADCHF, XAUUSD, USDCAD)

24.12.2020

CADCHF, “Canadian Dollar vs Swiss Franc”

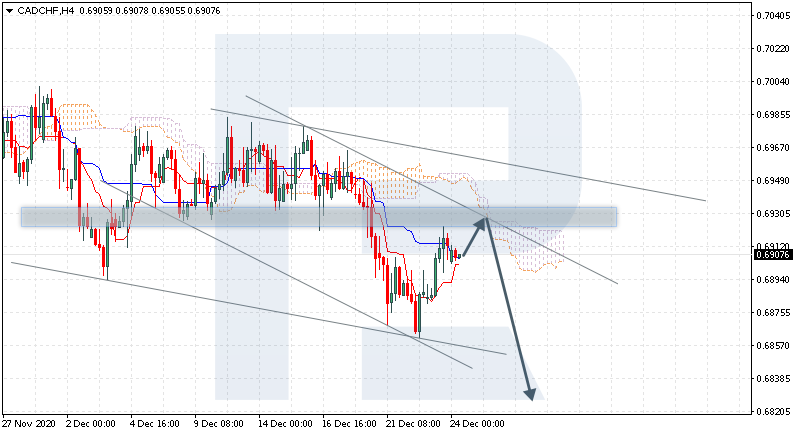
CADCHF is trading at 0.6907; the instrument is moving below Ichimoku Cloud, thus indicating a descending tendency. The markets could indicate that the price may test the cloud’s downside border at 0.6915 and then resume moving downwards to reach 0.6835. Another signal in favor of further downtrend will be a rebound from the descending channel’s upside border. However, the bearish scenario may no longer be valid if the price breaks the cloud’s upside border and fixes above 0.6950. In this case, the pair may continue growing towards 0.7045.

CADCHF
Risk Warning: the result of previous trading operations do not guarantee the same results in the future

XAUUSD, “Gold vs US Dollar”

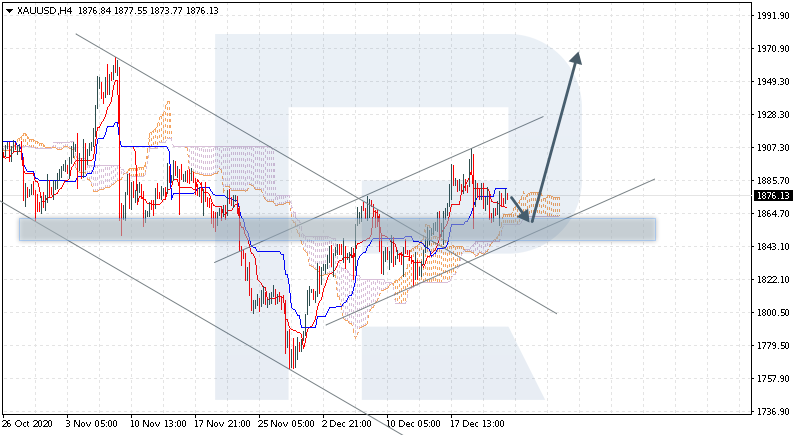
XAUUSD is trading at 1876.00; the instrument is moving above Ichimoku Cloud, thus indicating an ascending tendency. The markets could indicate that the price may test the cloud’s downside border at 1865.00 and then resume moving upwards to reach 1970.00. Another signal in favor of further uptrend will be a rebound from the rising channel’s downside border. However, the bullish scenario may no longer be valid if the price breaks the cloud’s downside border and fixes below 1840.00. In this case, the pair may continue falling towards 1805.00.

GOLD
Risk Warning: the result of previous trading operations do not guarantee the same results in the future

USDCAD, “US Dollar vs Canadian Dollar”

USDCAD is trading at 1.2847; the instrument is moving above Ichimoku Cloud, thus indicating an ascending tendency. The markets could indicate that the price may test Tenkan-Sen and Kijun-Sen at 1.2835 and then resume moving upwards to reach 1.3035. Another signal in favor of further uptrend will be a rebound from the rising channel’s downside border. However, the bullish scenario may no longer be valid if the price breaks the cloud’s downside border and fixes below 1.2735. In this case, the pair may continue falling towards 1.2645. To confirm further growth, the asset must break the upside border of the Triangle pattern and fix above 1.2925.

USDCAD
Risk Warning: the result of previous trading operations do not guarantee the same results in the future

rfxsignals December 24, 2020 No Comments

Japanese Candlesticks Analysis 24.12.2020 (GOLD, NZDUSD, GBPUSD)

Japanese Candlesticks Analysis 24.12.2020 (GOLD, NZDUSD, GBPUSD)

24.12.2020

XAUUSD, “Gold vs US Dollar”

As we can see in the H4 chart, the ascending tendency continues. Right now, after forming several reversal patterns, such as Engulfing and Doji, close to the support area, XAUUSD may reverse and resume growing towards the resistance level. In this case, the upside target will be at 1925.00. At the same time, an opposite scenario implies that the price may start another decline to return to 1850.00 before resuming its growth.

GOLD
Risk Warning: the result of previous trading operations do not guarantee the same results in the future

NZDUSD, “New Zealand vs. US Dollar”

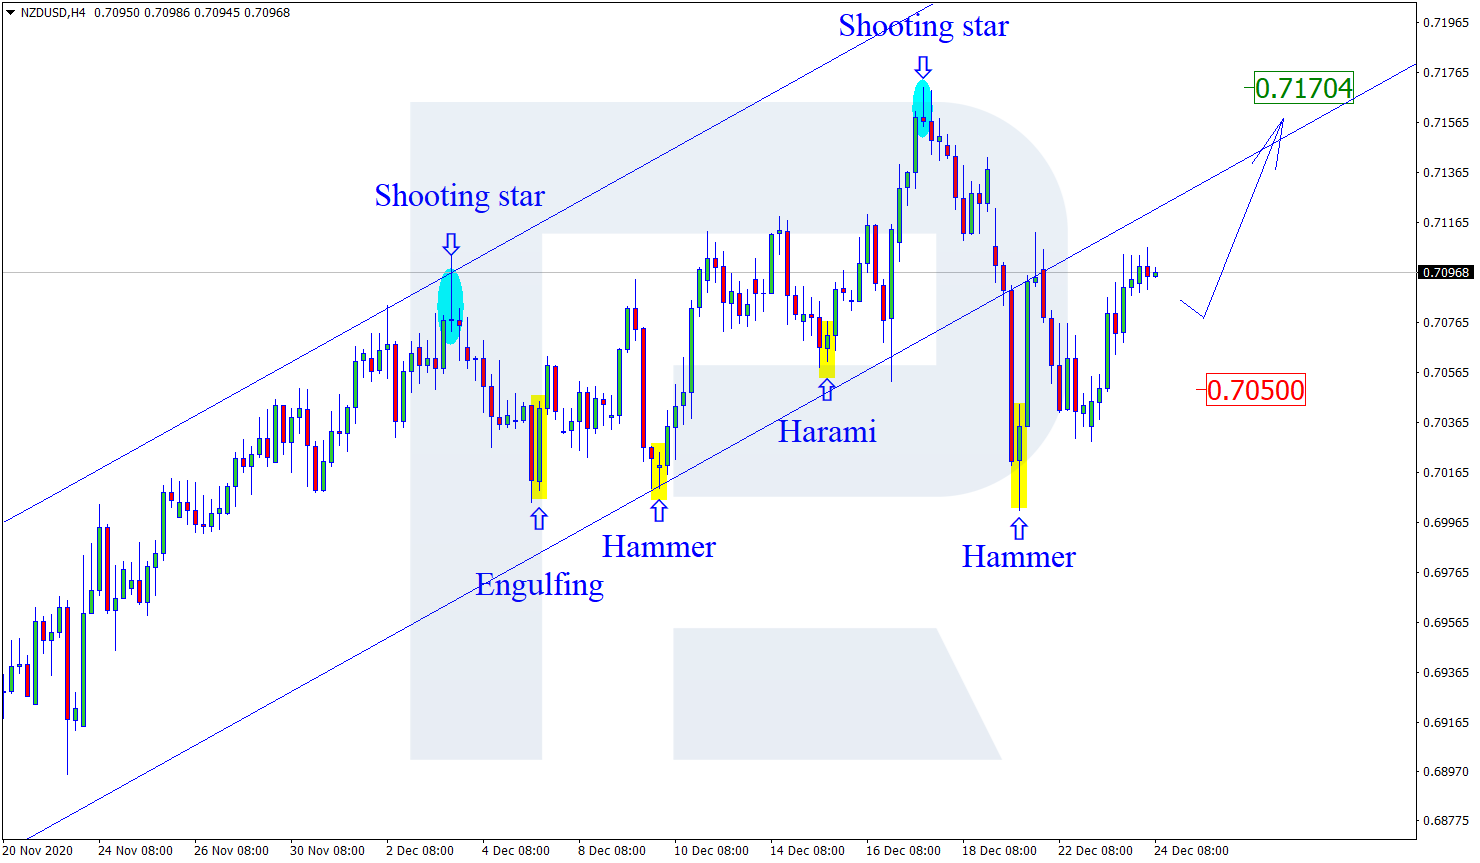
As we can see in the H4 chart, after finishing the correction within the uptrend and forming a Hammer pattern close to the horizontal support level, NZDUSD is reversing. The upside target remains at the resistance area at 0.7170. However, an alternative scenario implies that the price may start a new pullback towards 0.7050 before resuming the ascending tendency.

NZDUSD
Risk Warning: the result of previous trading operations do not guarantee the same results in the future

GBPUSD, “Great Britain Pound vs US Dollar”

As we can see in the H4 chart, the asset is moving within the uptrend. Right now, after forming several reversal patterns, such as Hammer, not far from the support area, GBPUSD is reversing. The upside target is at 1.3655. After that, the instrument may break the resistance level and continue moving upwards. Still, there might be an alternative scenario, according to which the asset may return to 1.3355 before further growth.

GBPUSD
Risk Warning: the result of previous trading operations do not guarantee the same results in the future

rfxsignals December 24, 2020 No Comments

Murrey Math Lines 24.12.2020 (USDCHF, GOLD)

Murrey Math Lines 24.12.2020 (USDCHF, GOLD)

24.12.2020

USDCHF, “US Dollar vs Swiss Franc”

As we can see in the H4 chart, USDCHF is moving below the 200-day Moving Average, thus indicating a descending tendency; a rebound from 2/8 earlier is another signal in favor of further decline. In this case, the price is expected to continue falling to reach the support at 0/8. Still, this scenario may no longer be valid if the price breaks 2/8 to the upside. After that, the instrument may reverse and correct towards the resistance at 3/8.

USDCHF_H4
Risk Warning: the result of previous trading operations do not guarantee the same results in the future

In the M15 chart, the pair may break the downside line of the VoltyChannel indicator and, as a result, continue the descending tendency.

USDCHF_M15
Risk Warning: the result of previous trading operations do not guarantee the same results in the future

XAUUSD, “Gold vs US Dollar”

As we can see in the H4 chart, the 200-day Moving Average has been broken, thus reversing the tendency to the upside. In this case, the price is expected to continue growing to reach the resistance at 5/8. However, this scenario may no longer be valid if the price breaks the support at 3/8 to the downside. After that, the instrument may continue falling towards 2/8.

GOLD_H4
Risk Warning: the result of previous trading operations do not guarantee the same results in the future

In the M15 chart, the price may break the upside line of the VoltyChannel indicator again and, as a result, may continue growing to reach 5/8 from the H4 chart.

GOLD_M15
Risk Warning: the result of previous trading operations do not guarantee the same results in the future

rfxsignals December 24, 2020 No Comments

Forex Technical Analysis & Forecast 24.12.2020

Forex Technical Analysis & Forecast 24.12.2020

24.12.2020

EURUSD, “Euro vs US Dollar”

EURUSD is still consolidating around 1.2184. Possibly, today the pair may expand this range up to 1.2230 and then fall to return to 1.2184. If later the price breaks this range to the upside, the market may start another growth towards 1.2330; if to the downside – resume trading downwards with the target at 1.2130.

EURUSD
Risk Warning: the result of previous trading operations do not guarantee the same results in the future

GBPUSD, “Great Britain Pound vs US Dollar”

GBPUSD is still moving upwards to reach 1.3614 Later, the market may correct towards 1.3464 and then form one more ascending structure with the target at 1.3723.

GBPUSD
Risk Warning: the result of previous trading operations do not guarantee the same results in the future

USDRUB, “US Dollar vs Russian Ruble”

USDRUB is still consolidating above 75.00. Today, the pair may break the range to the downside and reach 73.94. After that, the instrument may start another decline with the target at 74.90.

USDRUB
Risk Warning: the result of previous trading operations do not guarantee the same results in the future

USDJPY, “US Dollar vs Japanese Yen”

USDJPY is still consolidating around 103.52 without any particular direction. Possibly, the pair may expand the range up to 103.77. If later the price breaks 103.30 to the downside, the market may start another decline to break 103.00 and then continue trading downwards with the target at 102.50.

USDJPY
Risk Warning: the result of previous trading operations do not guarantee the same results in the future

USDCHF, “US Dollar vs Swiss Franc”

USDCHF is forming a new consolidation range around 0.8870. Possibly, the pair may expand the range down to 0.8830 and then start another growth to test 0.8860 from below. Later, the market may resume trading downwards with the target at 0.8811.

USDCHF
Risk Warning: the result of previous trading operations do not guarantee the same results in the future

AUDUSD, “Australian Dollar vs US Dollar”

AUDUSD is still consolidating above 0.7568. If later the price breaks this range to the upside, the market form one more ascending structure to reach 0.7636; if to the downside – resume trading downwards to break 0.7490 and then continue falling with the target at 0.7373.

AUDUSD
Risk Warning: the result of previous trading operations do not guarantee the same results in the future

BRENT

After breaking 50.69, Brent is still growing towards 52.30. Today, the asset may reach this level and then fall to return to 50.70, thus forming a wide consolidation range around this level. If later the price breaks this range to the upside, the market form one more ascending structure to reach 55.50; if to the downside – start a new correction with the target at 48.50.

BRENT
Risk Warning: the result of previous trading operations do not guarantee the same results in the future

XAUUSD, “Gold vs US Dollar”

After finishing the ascending wave at 1875.00, Gold is expected to resume falling and reach 1853.90. After that, the instrument may start another growth with the target at 1881.00.

GOLD
Risk Warning: the result of previous trading operations do not guarantee the same results in the future

BTCUSD, “Bitcoin vs US Dollar”

BTCUSD is still consolidating around 23000.00. Possibly, today the asset may fall to reach 21700.00 and then return to test 23000.00 from below. Later, the market may resume trading downwards with the target at 20700.00.

BTCUSD
Risk Warning: the result of previous trading operations do not guarantee the same results in the future

S&P 500

The S&P index is still consolidating above 3671.0. Today, the asset may reach 3704.0 and then fall to test 3671.0 from above. Later, the market may form one more ascending structure with the target at 3735.5.

S&P500
Risk Warning: the result of previous trading operations do not guarantee the same results in the future

rfxsignals December 23, 2020 No Comments

Daily Free Forex Signals For 23/12/2020

Here your going to see Daily Free Forex Signals For 23/12/2020 to free forex signal alert from our kitkat trading system and other trading logic’s .we provide like this free forex signals from 2012 on wards with more than 50,000 traders around the world .The free forex signals have 70 to 85% quality always .we give for you a note as maximum focus take profit 1 as your target and must use stop loss values .if you have any other query’s please visit our live chat or email option

EURGBP SELL-0.910212
SL-0.913363
TP1-0.908637
TP2-0.907158


EURJPY SELL-126.096923
SL-126.546923
TP1-125.943077
TP2-125.773846


GBPCHF BUY-1.190164
SL-1.187026
TP1-1.191643
TP2-1.193212


GBPUSD BUY-1.340064
SL-1.335241
TP1-1.341672
TP2-1.343074


EURJPY SELL-126.096923
SL-126.546923
TP1-125.943077
TP2-125.773846


GBPNZD BUY-1.90306
SL-1.894627
TP1-1.904585
TP2-1.906109


NZDCAD BUY- 0.909165
SL-0.906139
TP1-0.910721
TP2-0.91229


AUDJPY BUY-78.157515
SL-77.771893
TP1-78.318935
TP2-78.450592

NZDCHF BUY-0.627488
SL-0.627488
TP1-0.629114
TP2-0.631475


USDJPY SELL-103.459797
SL-103.803581
TP1-103.319324
TP2-103.120608

rfxsignals December 23, 2020 No Comments

Forex Technical Analysis & Forecast 23.12.202

Forex Technical Analysis & Forecast 23.12.2020

23.12.2020

EURUSD, “Euro vs US Dollar”

After completing the descending wave at 1.2152 EURUSD has broken 1.2184 to the upside; right now, it is consolidating around the latter level. Possibly, the pair may break this range to the upside to reach 1.2218 and then fall to return to 1.2184. If later the price breaks this range to the upside, the market may start another growth towards 1.2330; if to the downside – resume trading downwards with the target at 1.2050.

EURUSD
Risk Warning: the result of previous trading operations do not guarantee the same results in the future

GBPUSD, “Great Britain Pound vs US Dollar”

After finishing the descending wave at 1.3308, GBPUSD has broken 1.3370 to the upside; right now, it is still moving upwards. Possibly, today the pair may reach 1.3439 and then fall to return to 1.3370, thus forming a new consolidation range around the latter level. If later the price breaks this range to the upside, the market may form one more ascending structure to reach 1.3544; if to the downside – resume trading downwards with the target at 1.3180.

GBPUSD
Risk Warning: the result of previous trading operations do not guarantee the same results in the future

USDRUB, “US Dollar vs Russian Ruble”

USDRUB is still consolidating around 75.40. Today, the pair may expand the range up to 76.10 and then form a new descending structure to break 74.50. After that, the instrument may continue trading downwards with the target at 73.20.

USDRUB
Risk Warning: the result of previous trading operations do not guarantee the same results in the future

USDJPY, “US Dollar vs Japanese Yen”

USDJPY is still consolidating around 103.51. Possibly, the pair may expand the range up to 103.77 and then fall to break 103.30. After that, the instrument may start another decline to break 103.00 and then continue trading downwards with the target at 102.50.

USDJPY
Risk Warning: the result of previous trading operations do not guarantee the same results in the future

USDCHF, “US Dollar vs Swiss Franc”

After breaking 0.8880 to the downside, USDCHF is still falling. Possibly, today the pair may reach 0.8855 and then form one more ascending structure to return to 0.8880, thus forming a new consolidation range between two latter levels. If later the price breaks this range to the upside, the market may start another growth to reach 0.8940; if to the downside – resume trading downwards with the target at 0.8840 or even continue falling towards 0.8811.

USDCHF
Risk Warning: the result of previous trading operations do not guarantee the same results in the future

AUDUSD, “Australian Dollar vs US Dollar”

AUDUSD is still consolidating around 0.7544. If later the price breaks this range to the upside, the market form one more ascending structure to reach 0.7636; if to the downside – resume trading downwards to break 0.7490 and then continue falling with the target at 0.7373.

AUDUSD
Risk Warning: the result of previous trading operations do not guarantee the same results in the future

BRENT

After completing another descending structure at 49.50, Brent is expected to grow and test 50.25 from below. Later, the asset may correct with the short-term target at 47.83.

BRENT
Risk Warning: the result of previous trading operations do not guarantee the same results in the future

XAUUSD, “Gold vs US Dollar”

After finishing the descending wave at 1863.68, Gold is forming a new consolidation range around this level. Possibly, the pair may start another growth to test 1875.70 from below and then form a new descending structure with the target at 1844.54.

GOLD
Risk Warning: the result of previous trading operations do not guarantee the same results in the future

BTCUSD, “Bitcoin vs US Dollar”

After forming a new consolidation range below 23100.00 and breaking it to the upside, BTCUSD has reached the short-term upside target at 23950.00. Possibly, today the asset may return to 23100.00 to test it from above and then resume trading upwards to with the target at 24250.00.

BITCOIN
Risk Warning: the result of previous trading operations do not guarantee the same results in the future

S&P 500

The S&P index is still consolidating above 3670.9. Today, the asset may grow towards 3709.0 and then return to test 3670.9 from above. Later, the market may form one more ascending structure with the target at 3736.2.
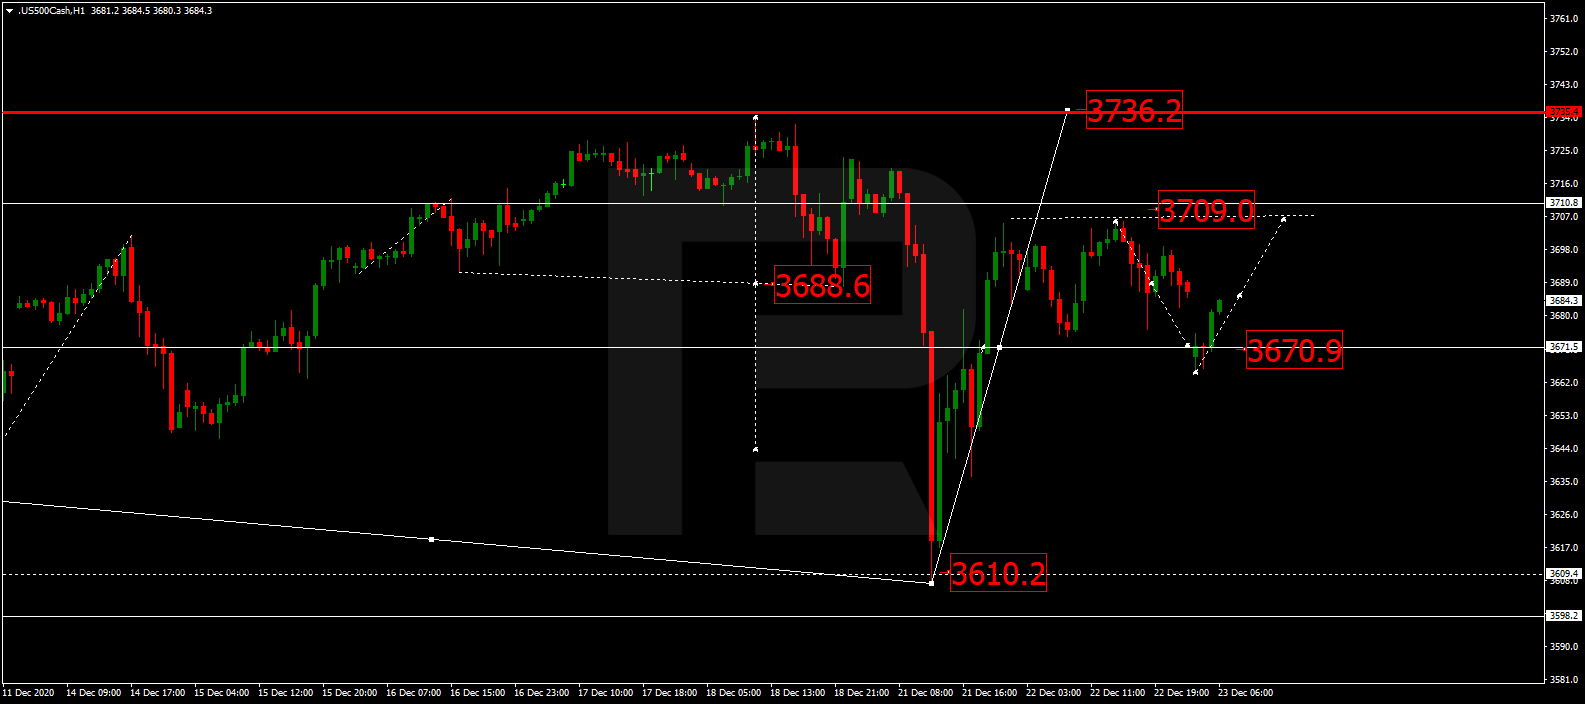
S&P 500

rfxsignals December 23, 2020 No Comments

Murrey Math Lines 23.12.2020 (USDJPY, USDCAD)

Murrey Math Lines 23.12.2020 (USDJPY, USDCAD)

23.12.2020

USDJPY, “US Dollar vs. Japanese Yen”

As we can see in the H4 chart, USDJPY is moving below the 200-day Moving Average, thus indicating a possible descending tendency. At the moment, the asset is breaking 1/8 and that’s another signal in favor of further decline towards the support at -1/8. However, this scenario may no longer be valid if the price breaks 1/8 to the upside. After that, the instrument may continue growing to reach the resistance at 3/8.

USDJPY_H4
Risk Warning: the result of previous trading operations do not guarantee the same results in the future

In the M15 chart, the pair may break the downside line of the VoltyChannel indicator and, as a result, continue moving downwards to reach -1/8 from the H4 chart.

USDJPY_M15
Risk Warning: the result of previous trading operations do not guarantee the same results in the future

USDCAD, “US Dollar vs Canadian Dollar”

As we can see in the H4 chart, USDCAD is moving below the 200-day Moving Average, thus indicating a descending tendency. In this case, the pair is expected to break 3/8 and then continue falling towards the support at 1/8. Still, this scenario may no longer be valid if the price breaks 4/8 to the upside. After that, the instrument may reverse and grow to reach 5/8.

USDCAD_H4
Risk Warning: the result of previous trading operations do not guarantee the same results in the future

In the M15 chart, the pair may beak the downside line of the VoltyChannel indicator and, as a result, continue trading downwards.

USDCAD_M15
Risk Warning: the result of previous trading operations do not guarantee the same results in the future