rfxsignals December 23, 2020 No Comments

Japanese Candlesticks Analysis 23.12.2020 (EURUSD, USDJPY, EURGBP)

Japanese Candlesticks Analysis 23.12.2020 (EURUSD, USDJPY, EURGBP)

23.12.2020

EURUSD, “Euro vs. US Dollar”

As we can see in the H4 chart, the ascending tendency continues. Right now, after forming several reversal patterns, such as Engulfing, close to the support level, EURUSD may reverse in the form of another rising impulse. The upside target remains at 1.2300. After that, the pair may continue trading upwards.

EURUSD
Risk Warning: the result of previous trading operations do not guarantee the same results in the future

USDJPY, “US Dollar vs. Japanese Yen”

As we can see in the H4 chart, after testing the horizontal support level and forming a Hammer pattern, USDJPY is reversing. The correctional target may be near the descending channel’s upside border at 103.85. After finishing the correction, the asset may continue trading downwards to reach the support area at 102.90.

USDJPY
Risk Warning: the result of previous trading operations do not guarantee the same results in the future

EURGBP, “Euro vs. Great Britain Pound”

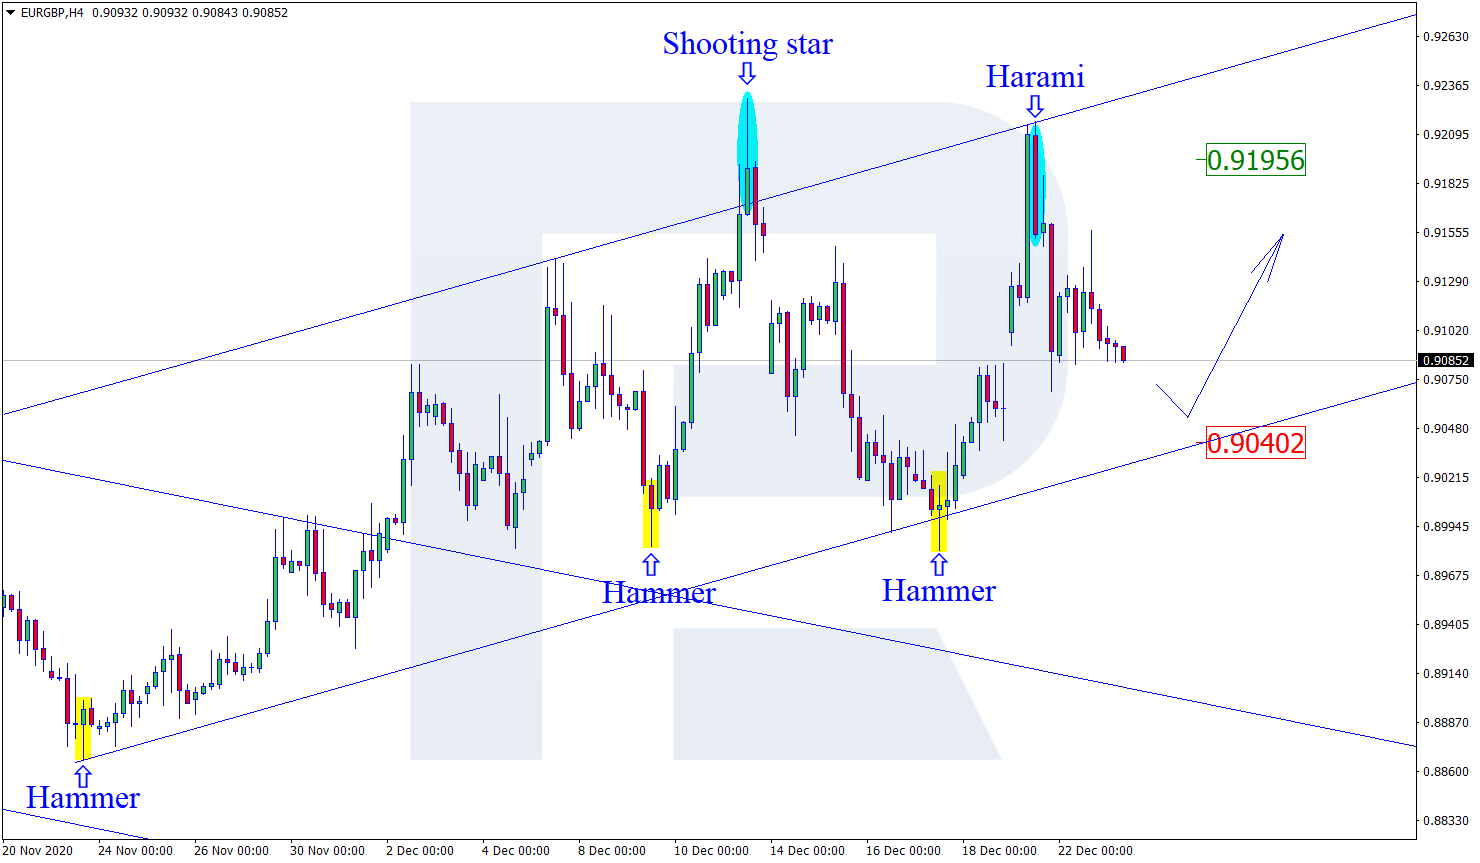
As we can see in the H4 chart, the correction within the ascending tendency continues. Right now, after forming several reversal patterns, such as Harami, not far from the channel’s upside border, EURGBP is reversing and correcting. In this case, the downside target may be at 0.9040. However, judging by previous movements, the pair may yet start another growth to reach 0.9195 without testing the channel’s downside border.

EURGBP
Risk Warning: the result of previous trading operations do not guarantee the same results in the future

rfxsignals December 23, 2020 No Comments

Ichimoku Cloud Analysis 23.12.2020 (BTCUSD, EURUSD, USDJPY)

Ichimoku Cloud Analysis 23.12.2020 (BTCUSD, EURUSD, USDJPY)

23.12.2020

BTCUSD, “Bitcoin vs US Dollar”

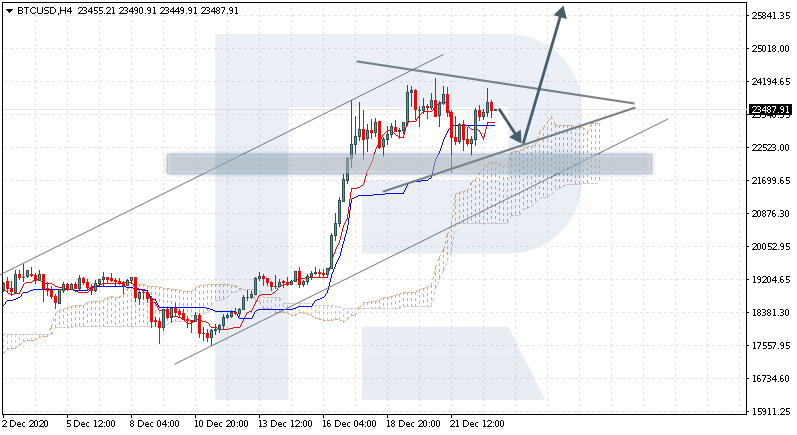
BTCUSD is trading at 23487.00; the instrument is moving above Ichimoku Cloud, thus indicating an ascending tendency. The markets could indicate that the price may test the cloud’s upside border at 22565.00 and then resume moving upwards to reach 25845.00. Another signal in favor of further uptrend will be a rebound from the downside border of a Triangle pattern. However, the bullish scenario may no longer be valid if the price breaks the cloud’s downside border and fixes below 20805.00. In this case, the pair may continue falling towards 19955.00. To confirm further growth, the asset must break the pattern’s upside border and fix above 24365.00.

BTCUSD
Risk Warning: the result of previous trading operations do not guarantee the same results in the future

EURUSD, “Euro vs US Dollar”

EURUSD is trading at 1.2188; the instrument is moving above Ichimoku Cloud, thus indicating an ascending tendency. The markets could indicate that the price may test the cloud’s downside border at 1.2155 and then resume moving upwards to reach 1.2345. Another signal in favor of further uptrend will be a rebound from the rising channel’s downside border. However, the bullish scenario may be canceled if the price breaks the cloud’s downside border and fixes below 1.2105. In this case, the pair may continue falling towards 1.2015. To confirm further growth, the asset must break the upside border of a Triangle pattern and fix above 1.2265.

EURUSD
Risk Warning: the result of previous trading operations do not guarantee the same results in the future

USDJPY, “US Dollar vs Japanese Yen”

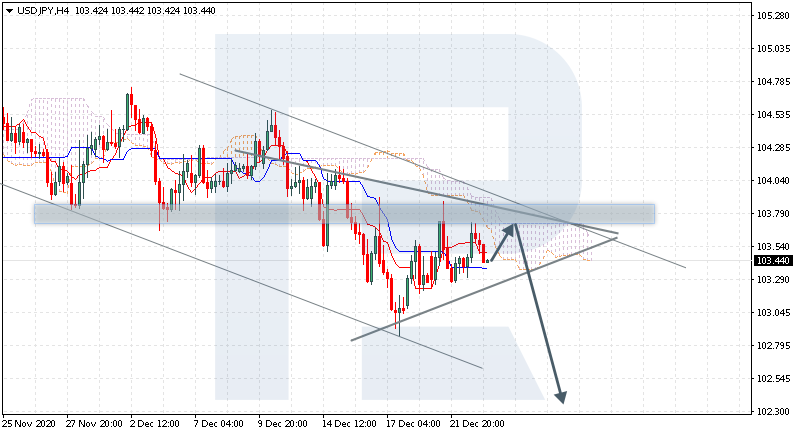
USDJPY is trading at 103.44; the instrument is moving below Ichimoku Cloud, thus indicating a descending tendency. The markets could indicate that the price may test the cloud’s upside border at 103.65 and then resume moving downwards to reach 102.45. Another signal in favor of further downtrend will be a rebound from the descending channel’s upside border. However, the bearish scenario may no longer be valid if the price breaks the cloud’s upside border and fixes above 104.05. In this case, the pair may continue growing towards 104.95. To confirm further decline, the asset must break the downside border of a Triangle pattern and fix below 103.10.

USDJPY
Risk Warning: the result of previous trading operations do not guarantee the same results in the future

rfxsignals December 23, 2020 No Comments

Fibonacci Retracements Analysis 23.12.2020 (GBPUSD, EURJPY)

Fibonacci Retracements Analysis 23.12.2020 (GBPUSD, EURJPY)

23.12.2020

GBPUSD, “Great Britain Pound vs US Dollar”

As we can see in the H4 chart, a divergence on MACD made the pair stop its ascending movement and start a new correction downwards to reach 38.2% fibo, which was later followed by another rising impulse to eliminate the gap. Possibly, this impulse may reach or even break the high at 1.3624 and then continue moving towards the post-correctional extension area between 138.2% and 161.8% fibo at 1.3792 and 1.3980 respectively. However, as long as the asset is trading below the high, the main scenario implies further decline to reach 50.0%, 61.8%, and 76.0% fibo at 1.3150, 1.3037, and 1.2904 respectively.

GBPUSD_H4
Risk Warning: the result of previous trading operations do not guarantee the same results in the future

In the H1 chart, after completing the descending wave, the par has corrected upwards and reached 61.8% fibo. Later, the asset may grow to break the high at 1.3624 and then continue towards the local post-correctional extension area between 138.2% and 161.8% fibo at 1.3790 and 1.3892 respectively. On the other hand, a breakout of the local support at 1.3188 will lead to further decline.

GBPUSD_H1
Risk Warning: the result of previous trading operations do not guarantee the same results in the future

EURJPY, “Euro vs. Japanese Yen”

In the H4 chart, EURJPY is rebounding from the high at 127.07 after testing it. Such a rebound may lead to both a short-term decline and a proper descending wave towards the low at 121.61 or even lower. On the other hand, if the pair breaks the high at 127.07, the asset may continue growing towards the mid-term 61.8% fibo at 128.65 and then the post-correctional extension area between 138.2% and 161.8% fibo at 129.15 and 130.40 respectively.

EURJPY_H4
Risk Warning: the result of previous trading operations do not guarantee the same results in the future

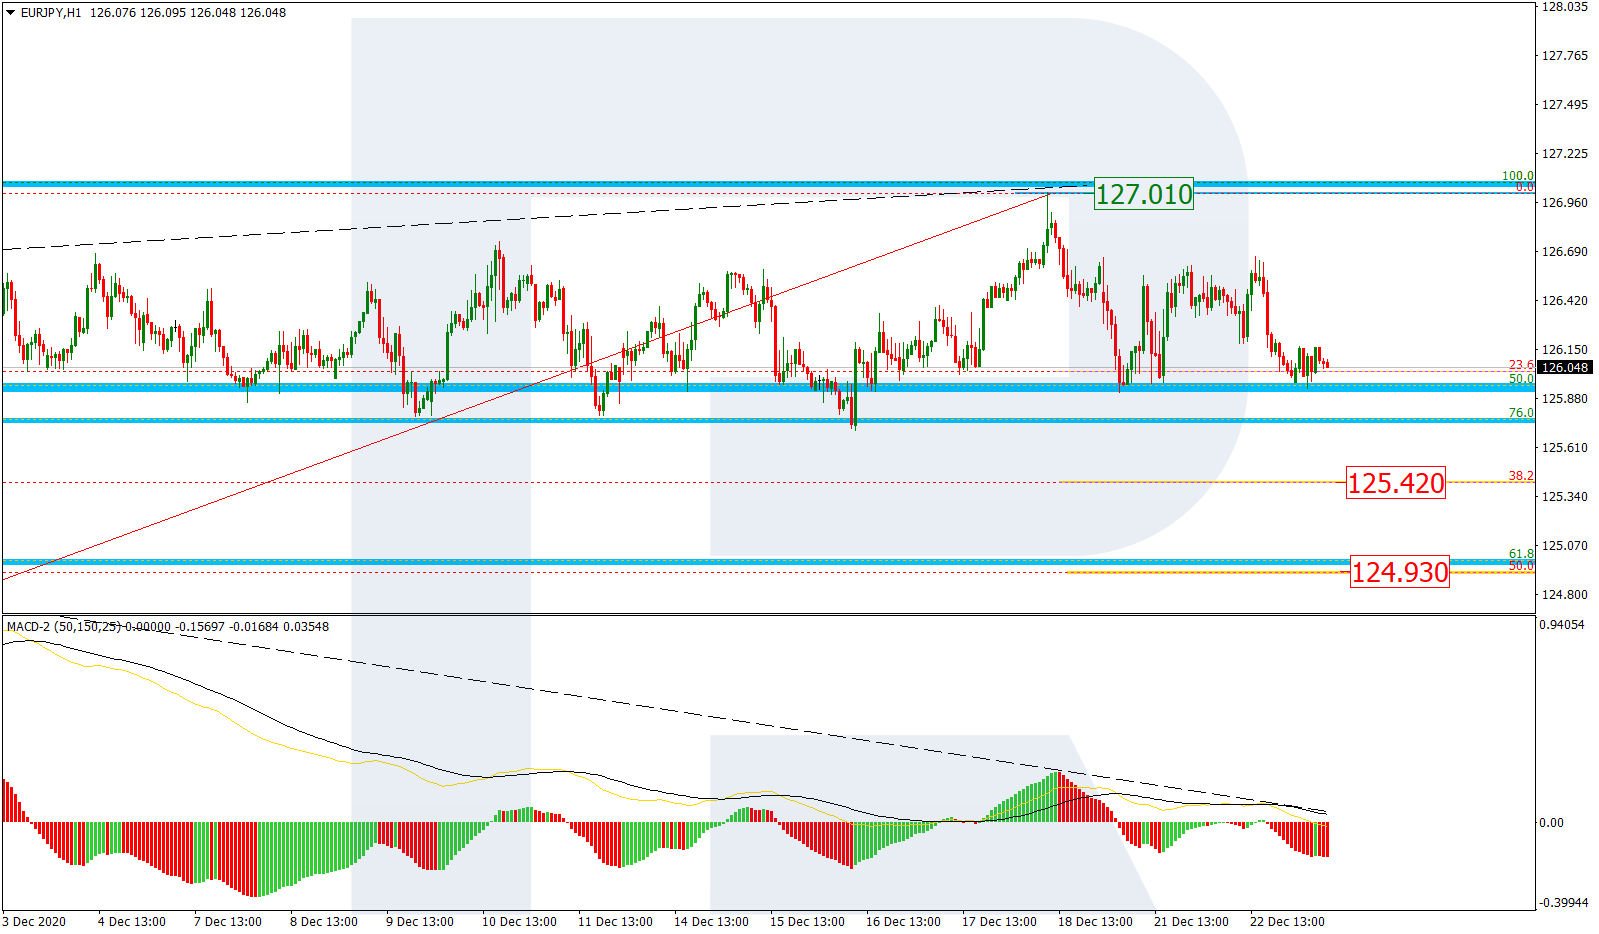
As we can see in the H1 chart, after a divergence on MACD, the asset has tested 23.6% fibo twice. Possibly, the pair may break this level and continue falling towards 38.2% and 50.0% fibo at 125.42 and 124.93 respectively. A breakout of the local high at 127.01 will hint at further uptrend.

EURJPY_H1
Risk Warning: the result of previous trading operations do not guarantee the same results in the future

rfxsignals December 23, 2020 No Comments

The USD continues strengthening. Overview for 23.12.2020

The USD continues strengthening. Overview for 23.12.2020

23.12.2020

EURUSD is falling while financial markets are becoming less active.

The major currency pair continues falling on Wednesday. The current quote for the instrument is 1.2182.

Yesterday, the USA reported on the GDP for the third quarter of 2020. After stimulus packages, the country’s economy added 33.4% q/q against the first estimate of 33.1% q/q. As a result, the third quarter completely eliminated the decline of the second one. So, the economy is still not alright but at least doesn’t look sick.

Later today, there will be more data from the USA and less time for work – the Catholic Christmas is almost here. America is planning to publish such reports as the Core Durable Goods Orders, which is expected to show +0.5% m/m in November after being +1.3% m/m the month before, and the Durable Goods Orders, which may add 0.6% m/m after increasing by 1.3% m/m over the same period of time.

Personal Spending is expected to lose 0.2% m/m in November after adding 0.5% m/m in October. On the other hand, Personal Income may lose 0.3% m/m after decreasing by 0.7% m/m over the same period.

Also. Investors will see the New Home Sales report, which is expected to fall a little bit in November, and the Revised University of Michigan Consumer Sentiment, which may correct down to 81.0 points in December after being 81.4 points in the previous month.

In other words, there will be a lot of numbers and market players will try to use the most interesting of them right here and right now because Christmas is around the corner.

rfxsignals December 22, 2020 No Comments

Daily Free Forex Signals For 22/12/2020

Here your going to see Daily Free Forex Signals For 22/12/2020 to free forex signal alert from our kitkat trading system and other trading logic’s .we provide like this free forex signals from 2012 on wards with more than 50,000 traders around the world .The free forex signals have 70 to 85% quality always .we give for you a note as maximum focus take profit 1 as your target and must use stop loss values .if you have any other query’s please visit our live chat or email option

EURAUD BUY-1.61697
SL -1.614427
TP1-1.619042
TP2-1.620565

GBPCHF SELL-1.18726
SL-1.190373
TP1-1.185653
TP2-1.184157

EURUSD SELL-1.22202
SL-1.225128
TP1-1.220416
TP2-1.218875

NZDUSD SELL-0.70601
SL-0.708997
TP1-0.704479
TP2-0.702935
EURGBP BUY-0.91223
SL- 0.907719
TP1- 0.91379
TP2-0.915375
AUDCAD BUY-0.97076
SL-0.970758
TP1-0.975466
TP2- 0.977004


CHFJPY SELL-116.640
SL- 116.783314
TP1-116.480457
TP2- 116.32499


CADCHF SELL-0.68843
SL-0.691619
TP1-0.686973
TP2-0.685335


NZDCAD SELL-0.90895
SL-0.9119
TP1-0.907512
TP2-0.90633


NZDCHF SELL-0.62584
SL-0.629498
TP1-0.62421
TP2-0.622576


EURAUD BUY-1.62071
SL-1.614395
TP1-1.622115
TP2-1.623652

rfxsignals December 22, 2020 No Comments

Fibonacci Retracements Analysis 22.12.2020 (EURUSD, USDJPY)

Fibonacci Retracements Analysis 22.12.2020 (EURUSD, USDJPY)

22.12.2020

EURUSD, “Euro vs US Dollar”

As we can see in the H4 chart, EURUSD is forming a new descending impulse within the post-correctional extension area between 138.2% and 161.8% fibo at 1.2167 and 1.2262 respectively after a divergence on MACD. The key downside targets may be 23.6%, 38.2%, and 50.0% fibo at 1.2115, 1.2018, and 1.1937 respectively. If the price breaks the high at 1.2273, the asset may continue growing to reach the long-term fractal high at 1.2555.

EURUSD_H4
Risk Warning: the result of previous trading operations do not guarantee the same results in the future

The H1 chart shows both potential downside and upside targets. On one hand, if the price breaks the high at 1.2273, it may move upwards to reach the post-correctional extension area between 138.2% and 161.8% fibo at 1.2327 and 1.2362 respectively. On the other hand, if EURUSD breaks the local low at 1.2130 again, the asset may continue trading downwards.

EURUSD_H1
Risk Warning: the result of previous trading operations do not guarantee the same results in the future

USDJPY, “US Dollar vs. Japanese Yen”

As we can see in the H4 chart, after completing another pullback at 23.6% fibo and breaking the low at 103.17, USDJPY has started a new correction to the upside. However, the main scenario remains the same and hints at further decline towards the fractal low at 101.18.

USDJPY_H4
Risk Warning: the result of previous trading operations do not guarantee the same results in the future

In the H1 chart, after breaking 23.6% fibo, the correctional uptrend has failed to reach 38.2% fibo at 103.95. However, if the current decline breaks the low at 102.87, the downtrend will continue. At the same time, one shouldn’t exclude a possibility of a new rising impulse to reach 38.2% and 50.0% fibo at 104.28 and 106.61 respectively.

USDJPY_H1

rfxsignals December 22, 2020 No Comments

The USD is interesting once again. Overview for 22.12.2020

The USD is interesting once again. Overview for 22.12.2020

22.12.2020

EURUSD has reversed after the world faced a new coronavirus strain.

The major currency pair is barely moving to the downside on Tuesday morning. The current quote for the instrument is 1.2220.

Last weekend, the US Congress finally approved an additional stimulus package in the amount of $900 billion to support the country’s economy. The package is targeted, so one can be sure that the money will be spent as intended.

It’s the second-biggest package ever approved for the American economy. The first one of $2.3 trillion was in March 2020. This time, it was supposed to be $1.2-1.5 trillion but the final approved sum is also very good.

In this case, direct payments to individuals imply a $600 and $300 increase in unemployment benefits. In addition to that, billions will be spent to support small businesses, provide food assistance, distribute the COVID-19 vaccine, and improve the country’s health care system.

$25 billion within the package are intended to extend the suspension of foreclosure of the right of redemption and leasehold.

However, Democrats are standing their ground and believe that the country’s economy will need more stimulus packages before the coronavirus pandemic and its consequences are over.

In this light, the USD is acting like a “safe haven” asset.

rfxsignals December 22, 2020 No Comments

Forex Technical Analysis & Forecast 22.12.2020

Forex Technical Analysis & Forecast 22.12.2020

22.12.2020

EURUSD, “Euro vs US Dollar”

After completing the descending wave at 1.2140 and then breaking 1.2200 to the upside, EURUSD has reached the short-term upside target at 1.2249; right now, it is falling to test 1,2200 from above and may later form one more ascending structure towards 1.2277. However, if the price breaks 1.2190 to the downside, the market may continue the correction to reach 1.2050 and then start another growth with the target at 1.2330.

EURUSD
Risk Warning: the result of previous trading operations do not guarantee the same results in the future

GBPUSD, “Great Britain Pound vs US Dollar”

After finishing the descending wave at 1.3230 and then breaking 1.3330 to the upside, GBPUSD has reached the short-term target at 1.3499; right now, it is falling to test 1.3330 from above and may later start another growth towards 1.3544. However, if the price breaks 1.3320 to the downside, the instrument may continue trading downwards with the target at 1.3200.

GBPUSD
Risk Warning: the result of previous trading operations do not guarantee the same results in the future

USDRUB, “US Dollar vs Russian Ruble”

After breaking 73.83 to the upside and then completing the ascending structure at 75.12, USDRUB is expected to test 73.83 from above and may later form one more ascending structure towards 74.67, thus forming a new consolidation range between two latter levels. If later the price breaks this range to the upside, the market may start another growth to reach 76.76; if to the downside – resume trading downwards with the target at 72.20.

USDRUB
Risk Warning: the result of previous trading operations do not guarantee the same results in the future

USDJPY, “US Dollar vs Japanese Yen”

After finishing the ascending wave at 103.77, USDJPY is falling towards 103.00. After that, the instrument may grow to reach 103.40 and then start another decline to break 102.70. Later, the market may form a new descending structure with the closest target at 102.50.

USDJPY
Risk Warning: the result of previous trading operations do not guarantee the same results in the future

USDCHF, “US Dollar vs Swiss Franc”

After finishing the ascending structure at 0.8900, then reaching 0.8880, and forming a new consolidation range there, USDCHF has broken this range to the downside to reach the short-term target at 0.8844; right now, it is correcting to test 0.8877 from below. After that, the instrument may start another decline with the target at 0.8839.

USDCHF
Risk Warning: the result of previous trading operations do not guarantee the same results in the future

AUDUSD, “Australian Dollar vs US Dollar”

After completing the descending wave at 0.7490 along with the correction towards 0.7599, AUDUSD is trading downwards to reach 0.7548. Later, the market may start a new growth with the target at 0.7636.

AUDUSD
Risk Warning: the result of previous trading operations do not guarantee the same results in the future

BRENT

After completing another descending structure at 49.50, Brent has tested 51.08 from below and may later fall towards 50.00, thus forming a new consolidation range between these two levels. If later the price breaks this range to the downside; the market may continue the correction to reach 47.84; if to the upside – resume trading upwards to break 52.85 and then continue growing with the target at 55.00.

BRENT
Risk Warning: the result of previous trading operations do not guarantee the same results in the future

XAUUSD, “Gold vs US Dollar”

After finishing the ascending wave at 1906.48 and then falling towards 1855.25, Gold has formed one more ascending structure to reach 1878.00; right now, it is forming a new consolidation range between the latter level. If later the price breaks this range to the downside at 1870.00; the market may form a new descending structure to break 1850.00 and then continue trading downwards to reach 1820.66; if to the upside at 1886.00 – resume trading upwards with the target at 1900.00 and then start another decline towards 1750.00.

GOLD
Risk Warning: the result of previous trading operations do not guarantee the same results in the future

BTCUSD, “Bitcoin vs US Dollar”

BTCUSD continues falling to reach 21800.00 and may later correct towards 22900.00, thus forming a new consolidation range between these two levels. If later the price breaks this range to the downside; the market may form a new descending structure with the target at 20600.00; if to the upside – resume trading upwards to reach 24700.00 and then start a new decline towards the above-mentioned target.

BITCOIN
Risk Warning: the result of previous trading operations do not guarantee the same results in the future

S&P 500

After finishing the descending structure at 3610.2 along with the correction towards 3700.0, the S&P index is falling to reach 3671.9, thus forming a new consolidation range between two latter levels. If later the price breaks this range to the downside; the market may form a new descending structure to reach 3600.0; if to the upside – resume trading upwards with the target at 3737.0.
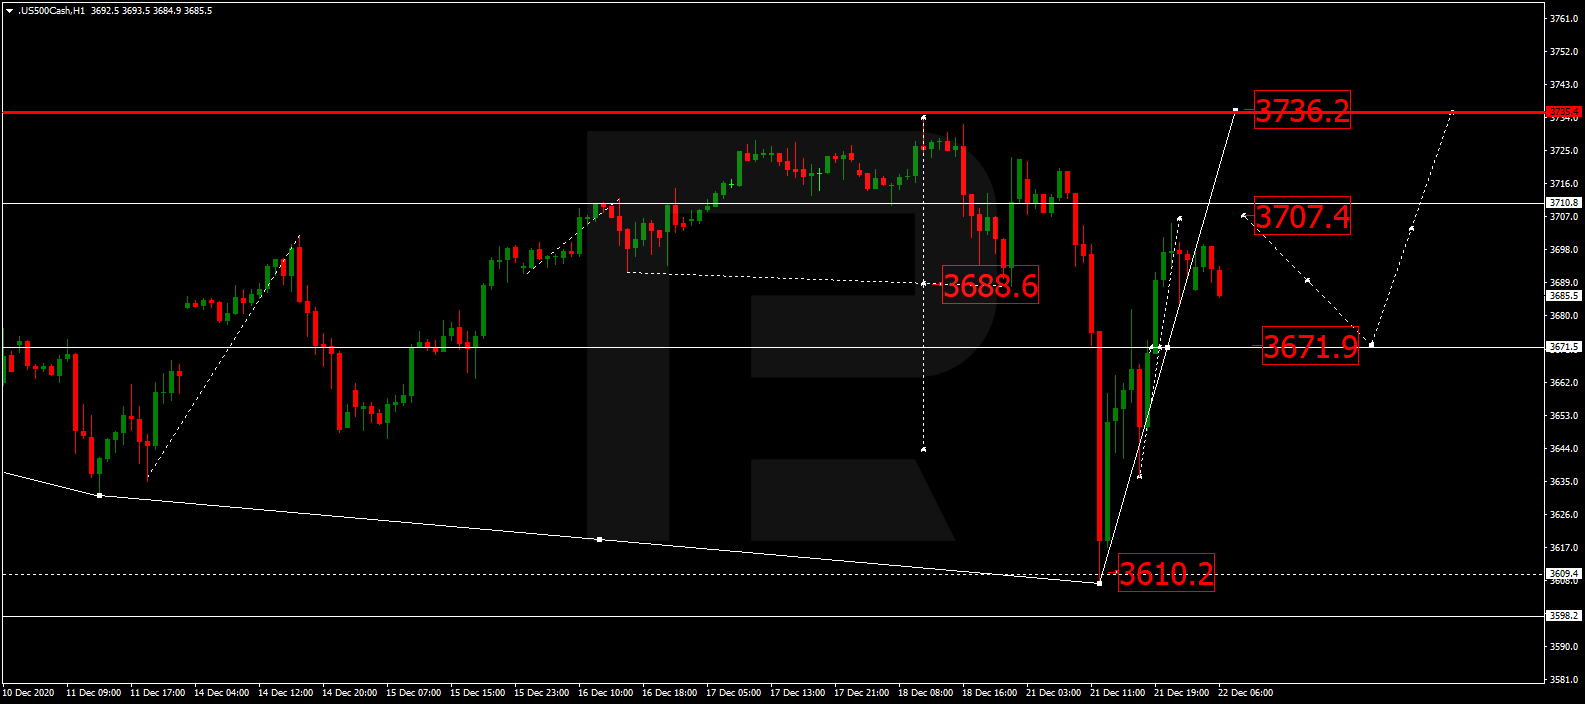
S&P 500
Risk Warning: the result of previous trading operations do not guarantee the same results in the future

rfxsignals December 22, 2020 No Comments

Murrey Math Lines 22.12.2020 (AUDUSD, NZDUSD)

Murrey Math Lines 22.12.2020 (AUDUSD, NZDUSD)

22.12.2020

AUDUSD, “Australian Dollar vs US Dollar”

As we can see in the H4 chart, AUDUSD has broken 8/8 once again. In this case, the price is expected to correct within the uptrend and reach the support at 6/8. However, this scenario may be canceled if the price breaks 8/8 to the upside. After that, the instrument may reverse and continue growing towards the resistance at +1/8.

AUDUSD_H4
Risk Warning: the result of previous trading operations do not guarantee the same results in the future

In the M15 chart, the pair may break the downside line of the VoltyChannel indicator and, as a result, continue trading downwards.

AUDUSD_M15
Risk Warning: the result of previous trading operations do not guarantee the same results in the future

NZDUSD, “New Zealand Dollar vs US Dollar”

In the H4 chart, after breaking 6/8, NZDUSD is trading below it. In this case, the price is expected to continue falling towards the closest support at 5/8. However, this scenario may no longer be valid if the price breaks 6/8 to the upside. After that, the instrument may reverse and resume growing to reach the resistance at 7/8.

NZDUSD_H4
Risk Warning: the result of previous trading operations do not guarantee the same results in the future

As we can see in the M15 chart, the pair has broken the downside line of the VoltyChannel indicator and, as a result, may continue moving downwards.

NZDUSD_M15
Risk Warning: the result of previous trading operations do not guarantee the same results in the future

rfxsignals December 22, 2020 No Comments

Japanese Candlesticks Analysis 22.12.2020 (USDCAD, AUDUSD, USDCHF)

Japanese Candlesticks Analysis 22.12.2020 (USDCAD, AUDUSD, USDCHF)

22.12.2020

USDCAD, “US Dollar vs Canadian Dollar”

As we can see in the H4 chart, the pullback within the descending tendency continues. Right now, after forming several reversal patterns, such as Hammer, not far from the support level, USDCAD is reversing in the form of another correction and may later continue growing within the descending channel. in this case, the upside target will be at 1.2990. However, an alternative scenario implies that the price may continue falling to reach 1.2685 without testing the channel’s upside border.

USDCAD
Risk Warning: the result of previous trading operations do not guarantee the same results in the future

AUDUSD, “Australian Dollar vs US Dollar”

As we can see in the H4 chart, after forming a Hammer pattern, the pair is reversing. Right now, AUDUSD continues growing within the rising channel. In this case, the upside target will be the next resistance level at 0.7670. At the same time, an opposite scenario says that the price may continue falling to return to 0.7500 before resuming its growth.

AUDUSD
Risk Warning: the result of previous trading operations do not guarantee the same results in the future

USDCHF, “US Dollar vs Swiss Franc”

As we can see in the H4 chart, after breaking the descending channel’s downside border and forming several reversal patterns, such as Doji, not far from the resistance area, USDCHF is reversing and may resume the descending tendency. In this case, the next downside target may be the support area at 0.8800. Still, there might be an alternative scenario, according to which the asset may return to 0.8930 before resuming its decline.

USDCHF
Risk Warning: the result of previous trading operations do not guarantee the same results in the future