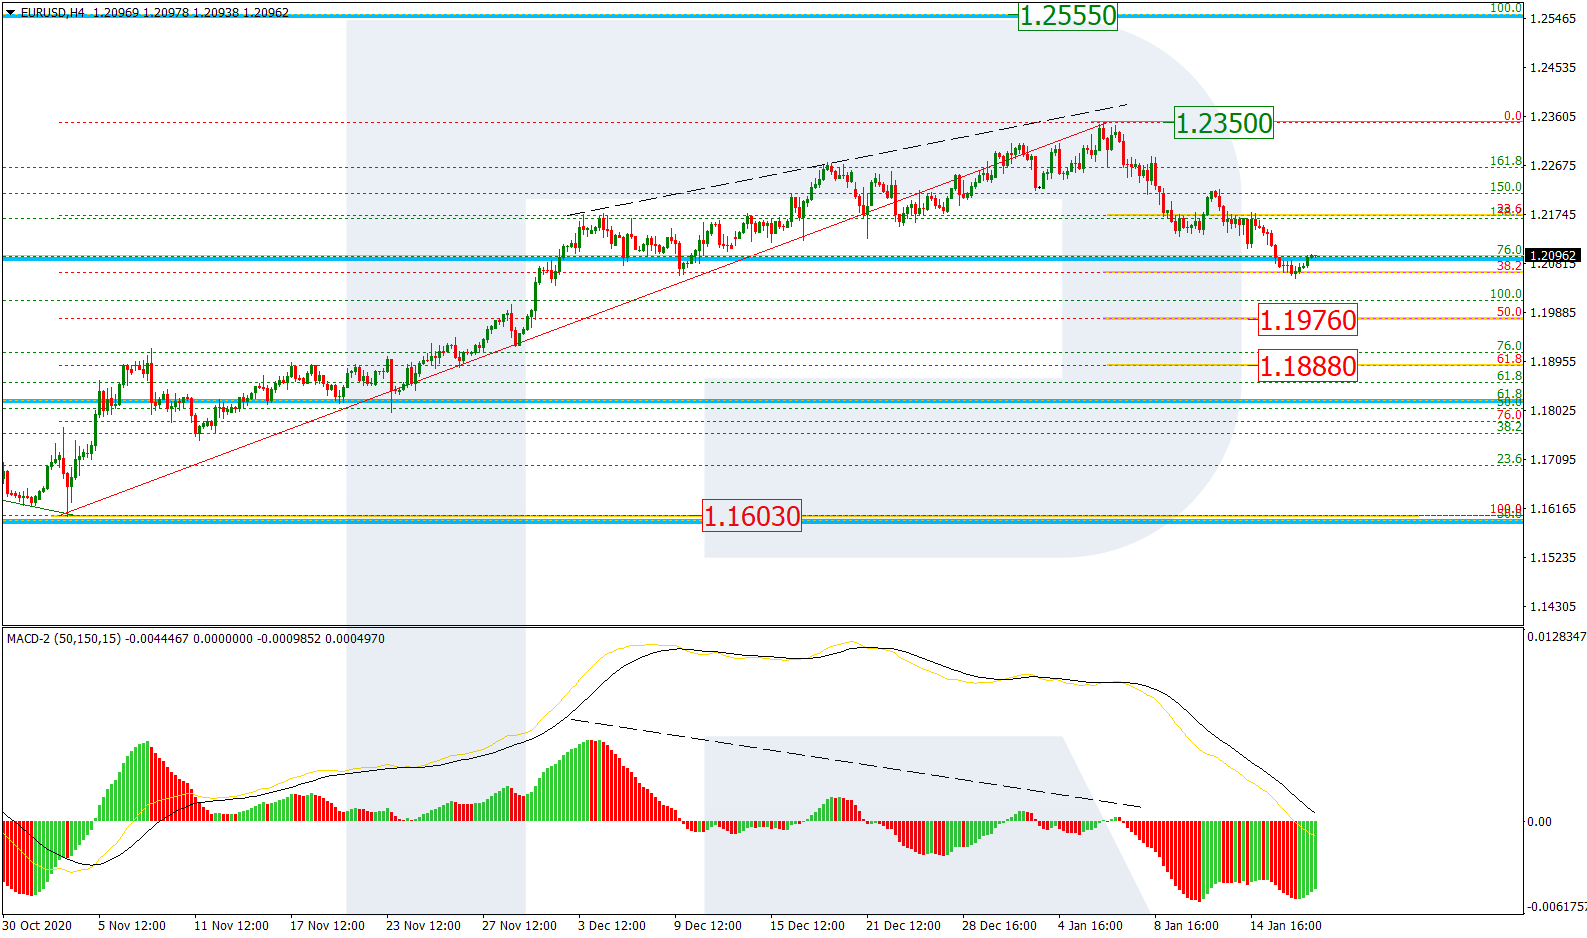
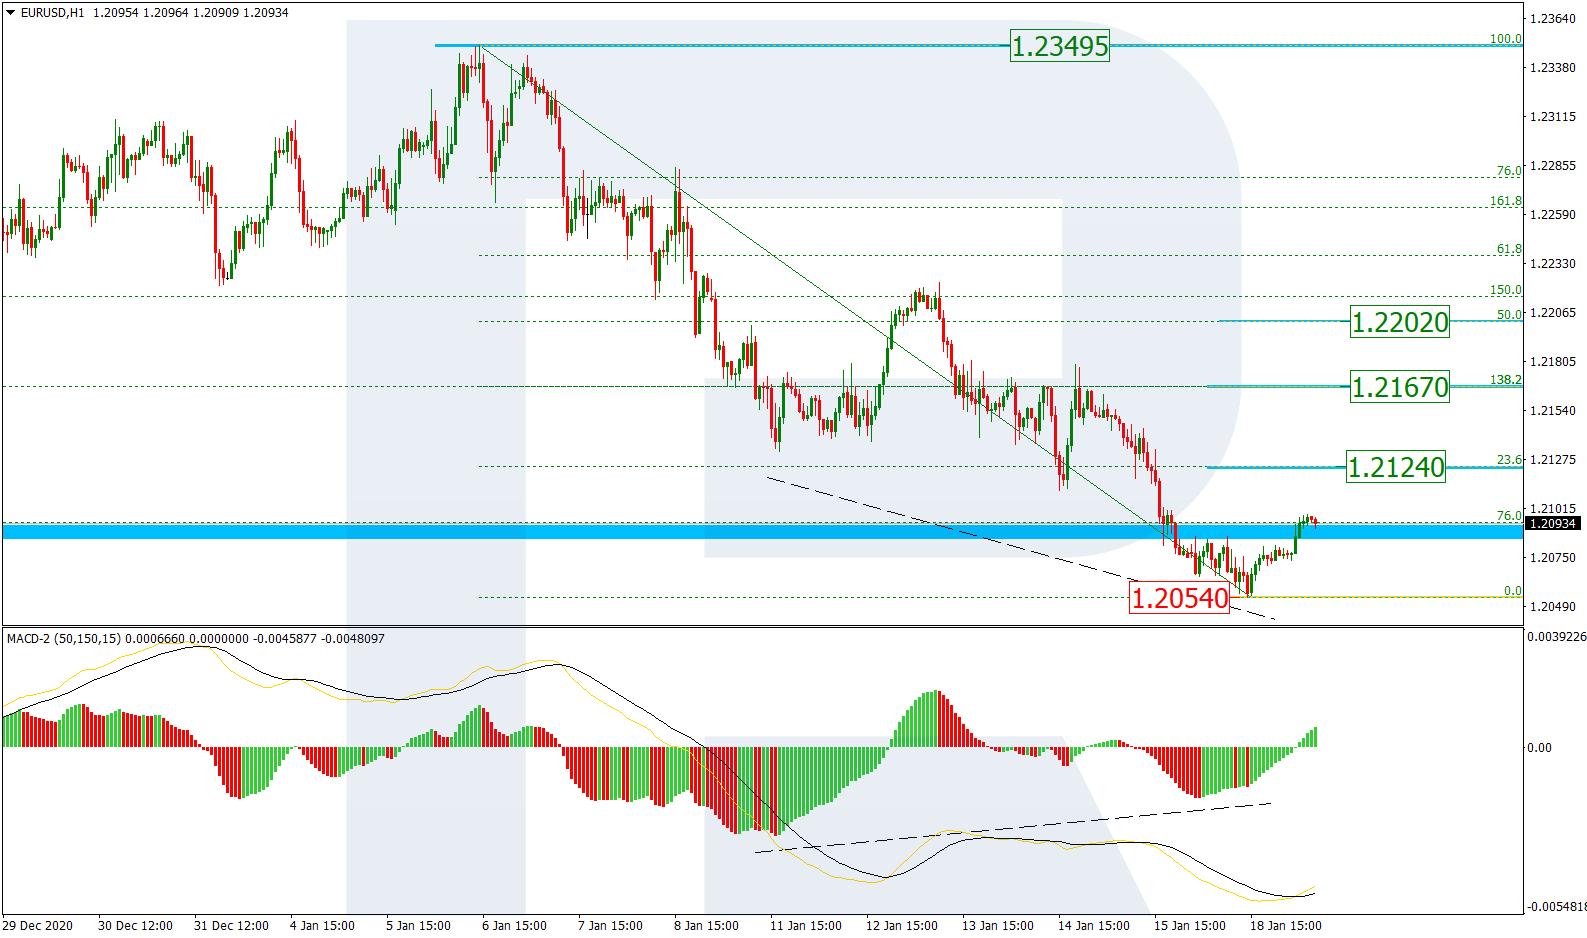
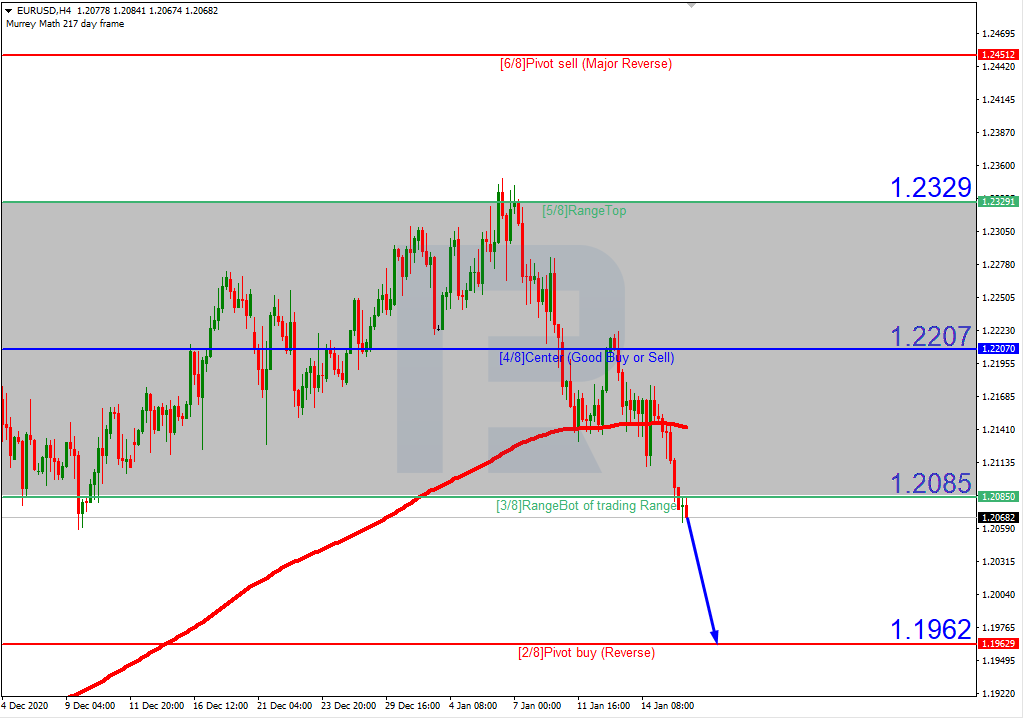
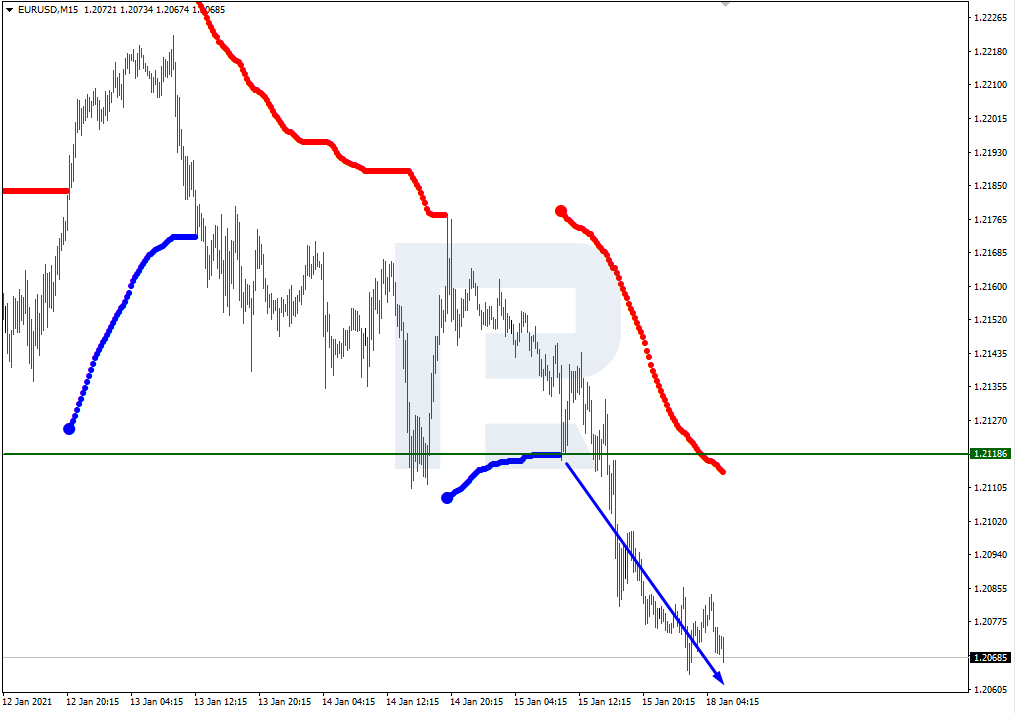
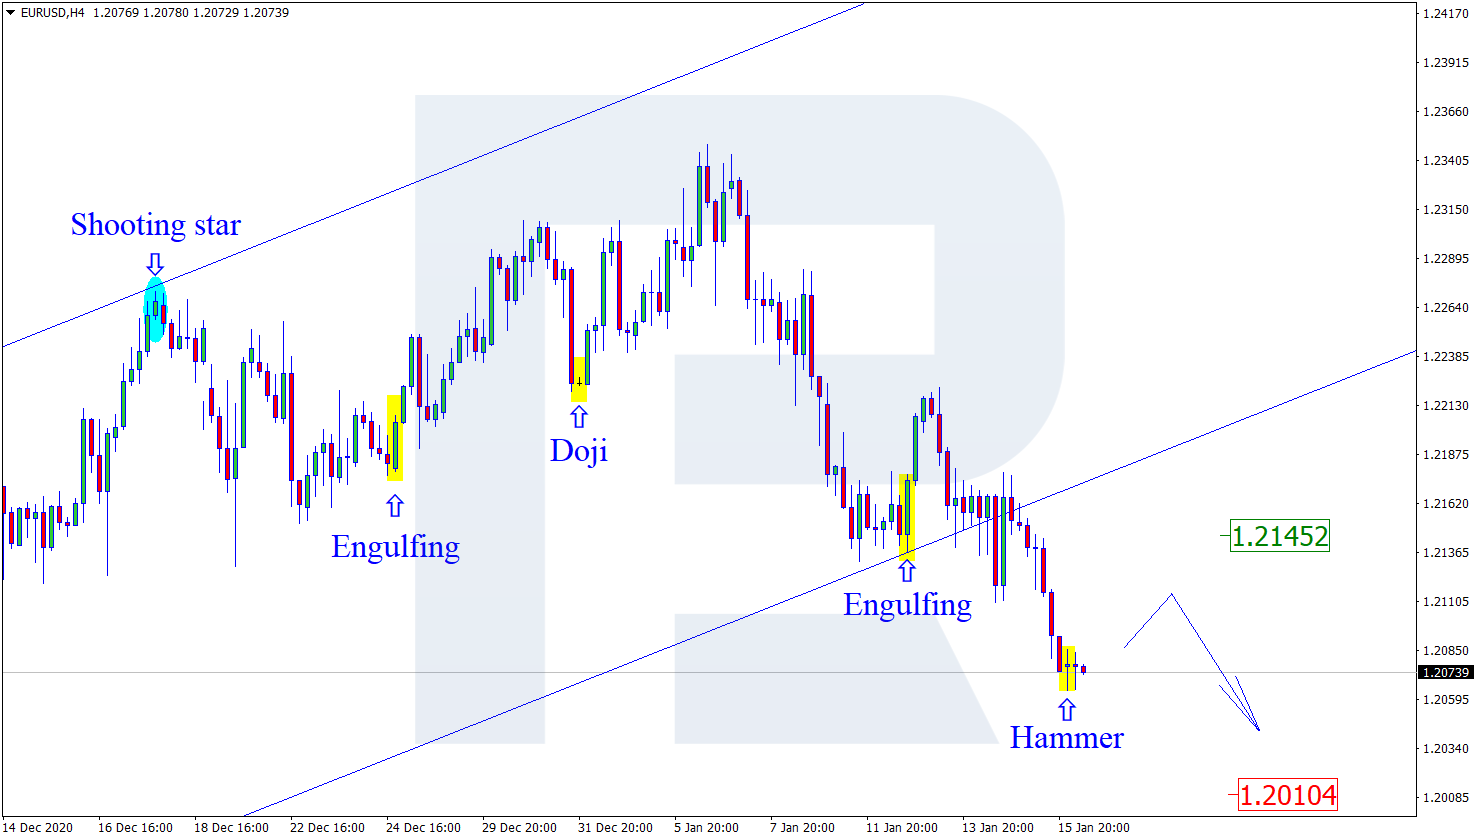
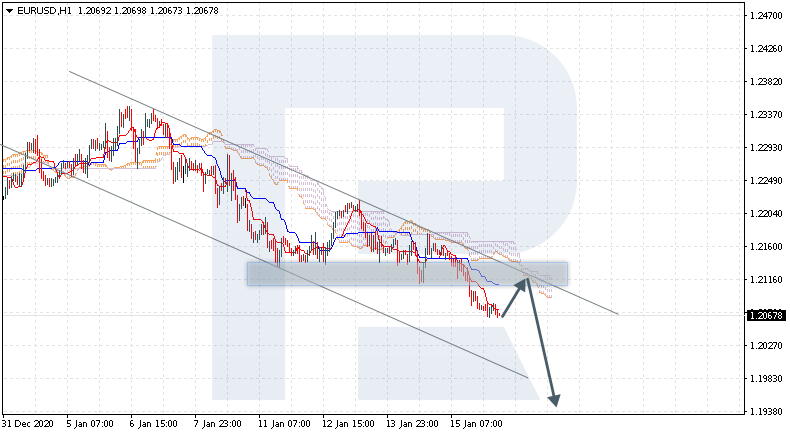
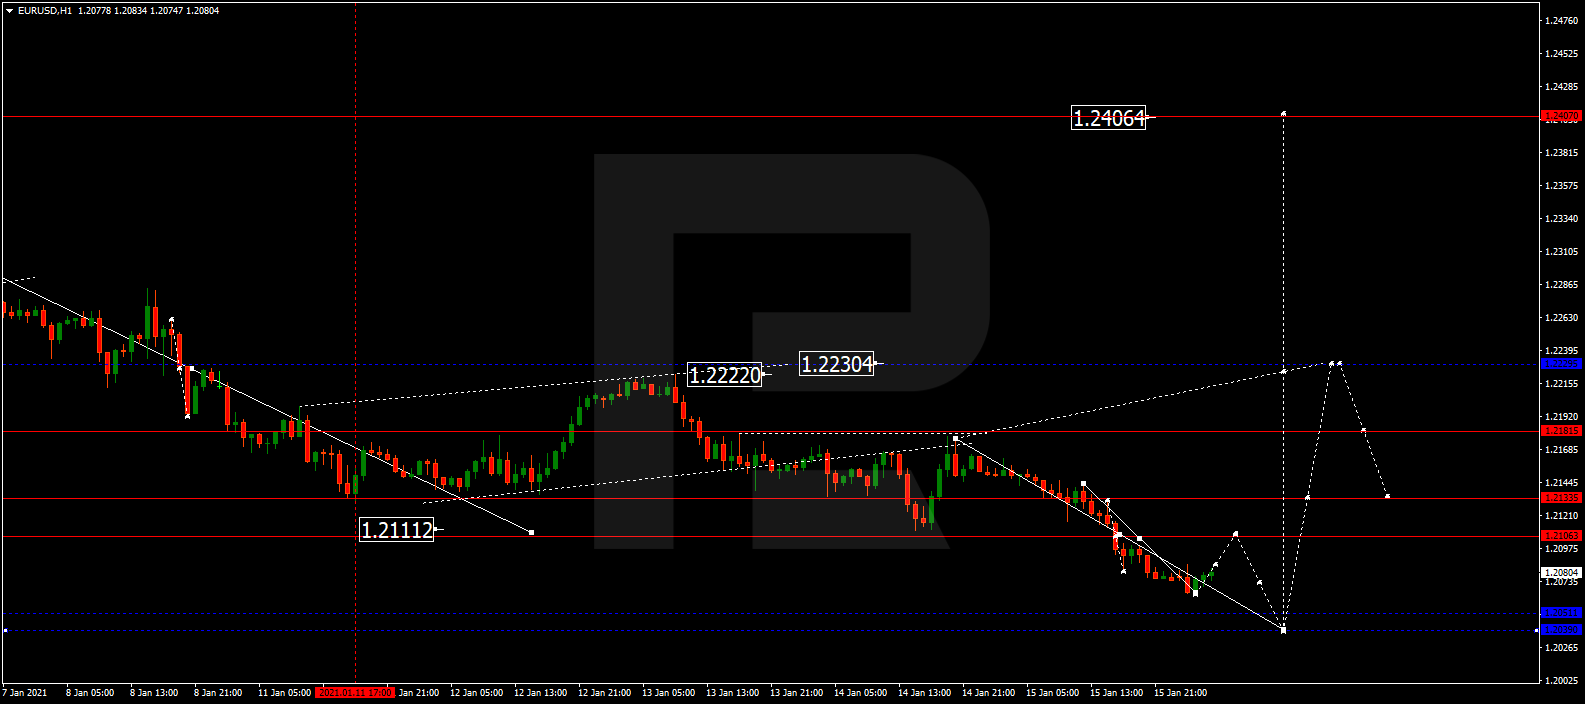
EURUSD, “Euro vs US Dollar”
After forming another consolidation range around 1.2111 and breaking it to the downside, EURUSD is expected to continue falling to reach 1.2050. Later, the market may start a new growth to break 1.2130 and then continue trading upwards with the first target at 1.2230.

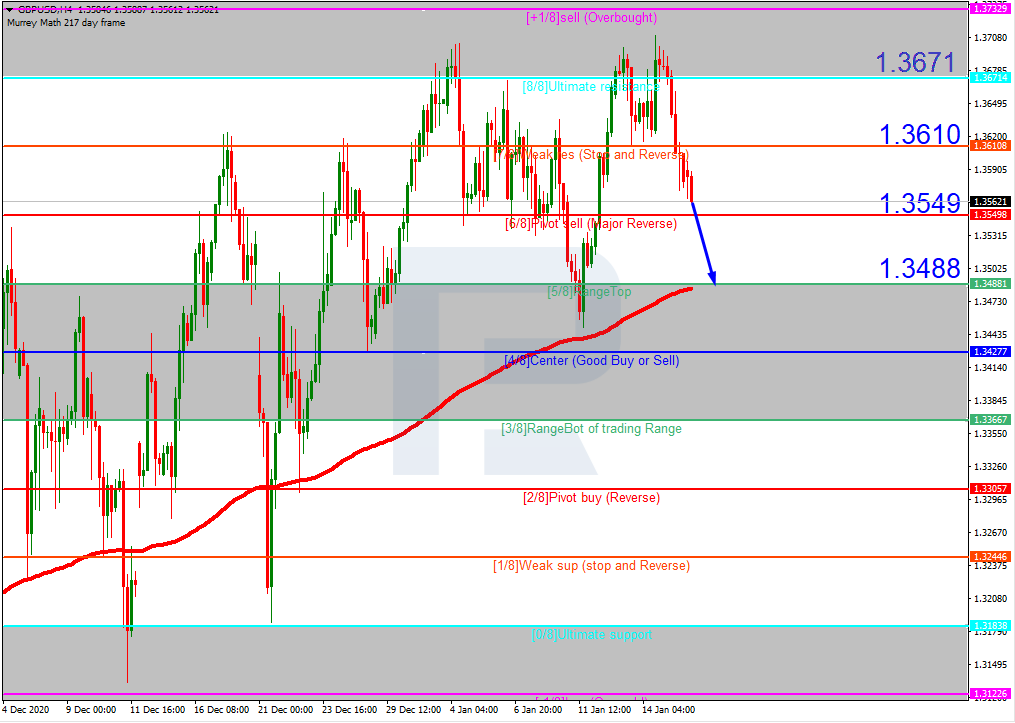
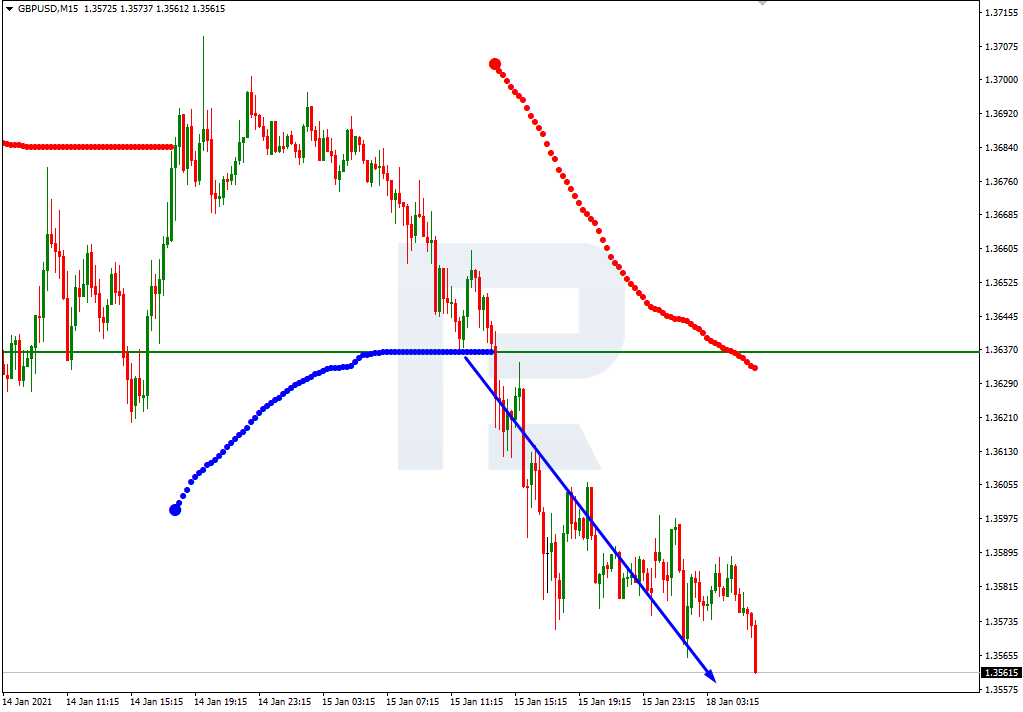
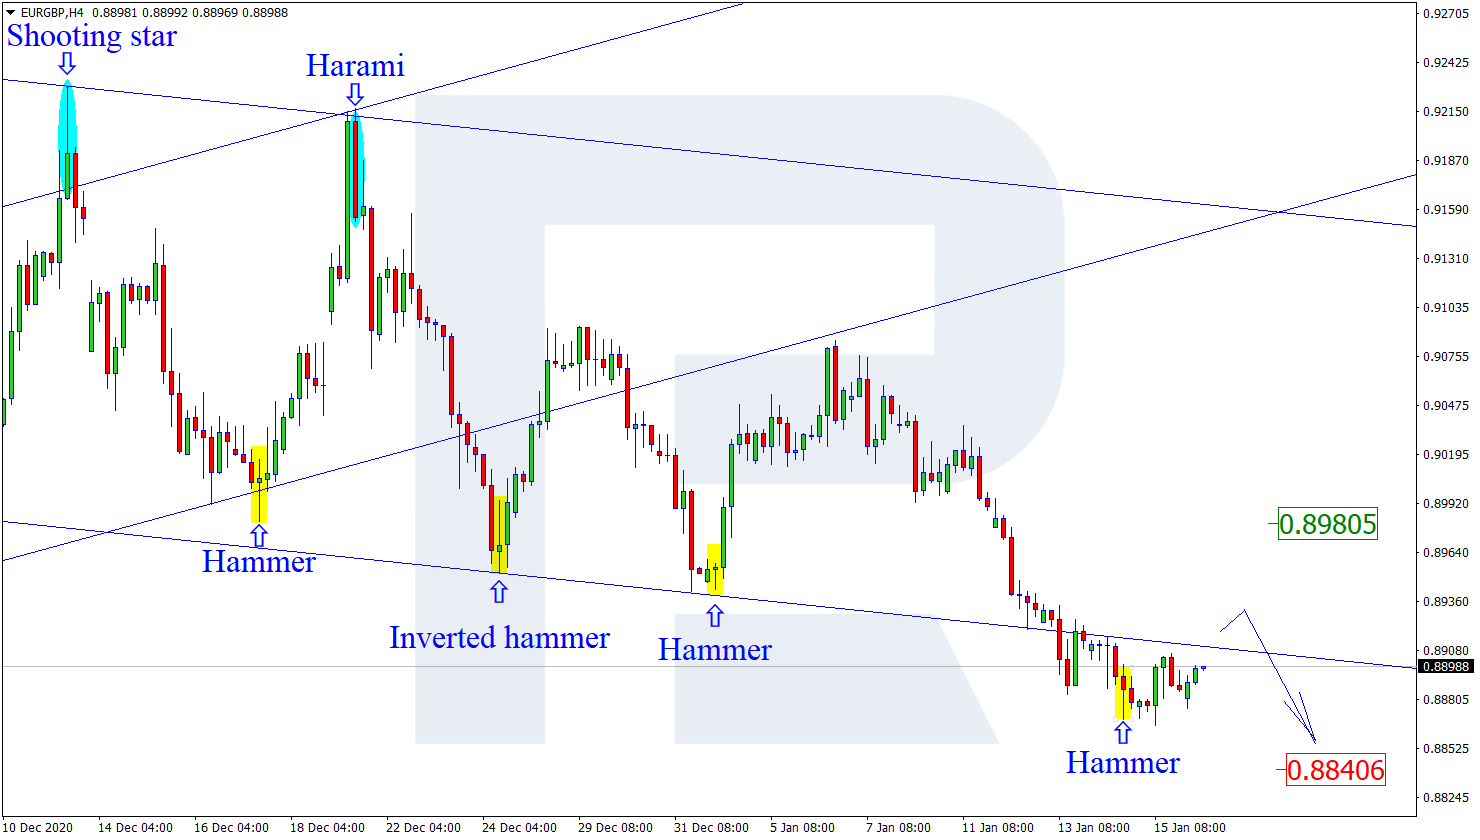
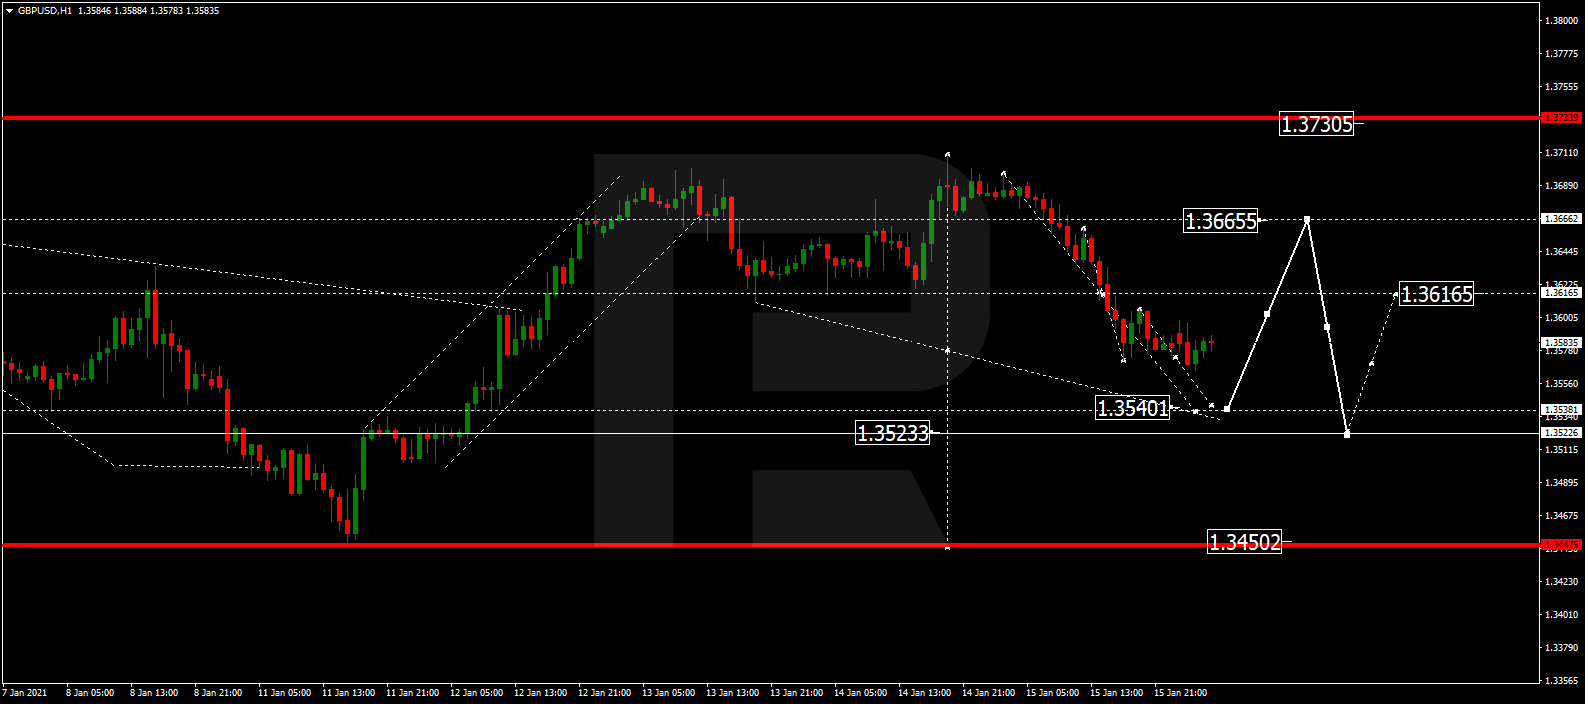
GBPUSD, “Great Britain Pound vs US Dollar”
After forming a new consolidation range above 1.3616 and breaking it to the downside, GBPUSD is expected to fall and reach 1.3540. After that, the instrument may form one more ascending structure to return to 1.3616 and then start a new decline with the target at 1.3523.
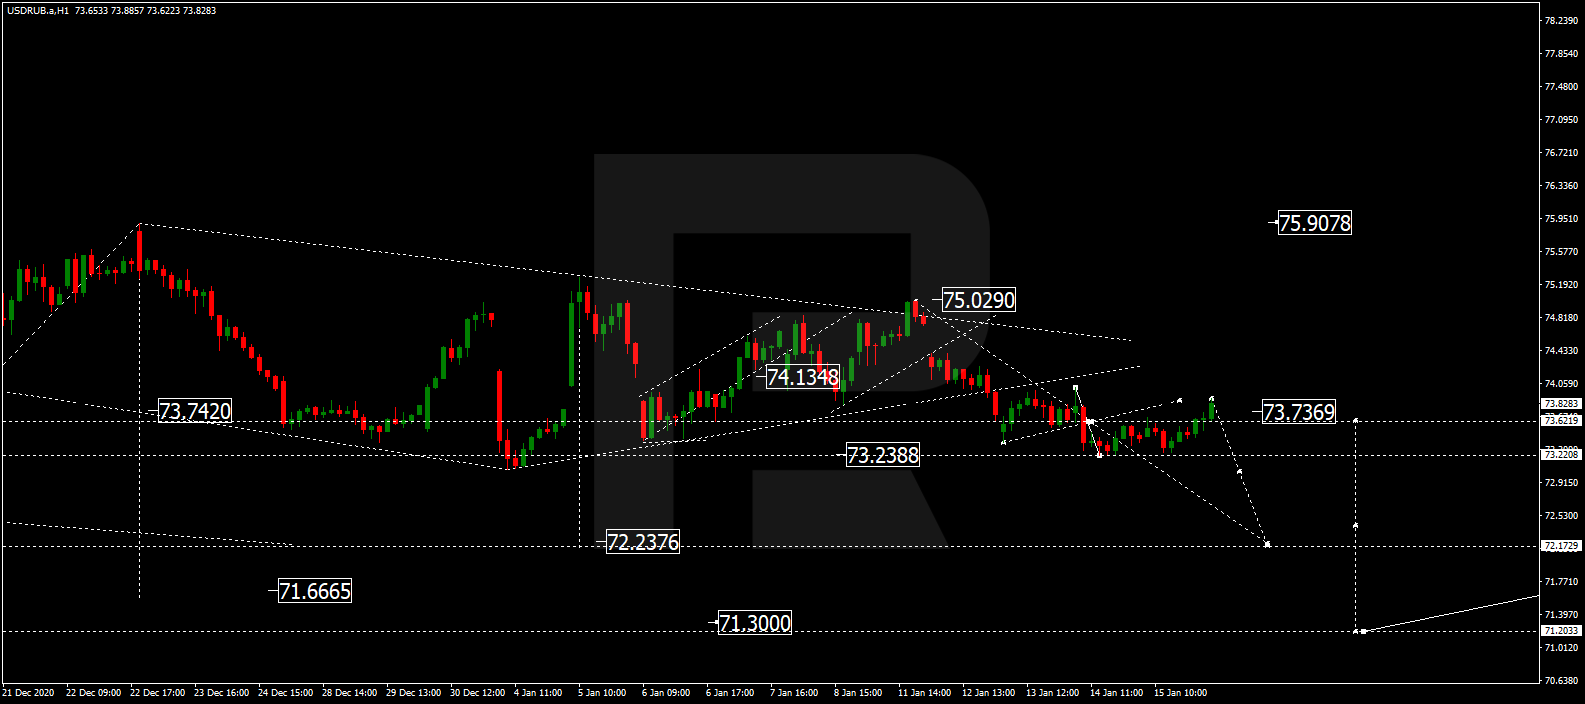
USDRUB, “US Dollar vs Russian Ruble”
USDRUB is still consolidating around 73.73. Possibly, the pair may form one more ascending structure to reach 74.00 and then resume moving within the downtrend with the short-term target at 72.23.
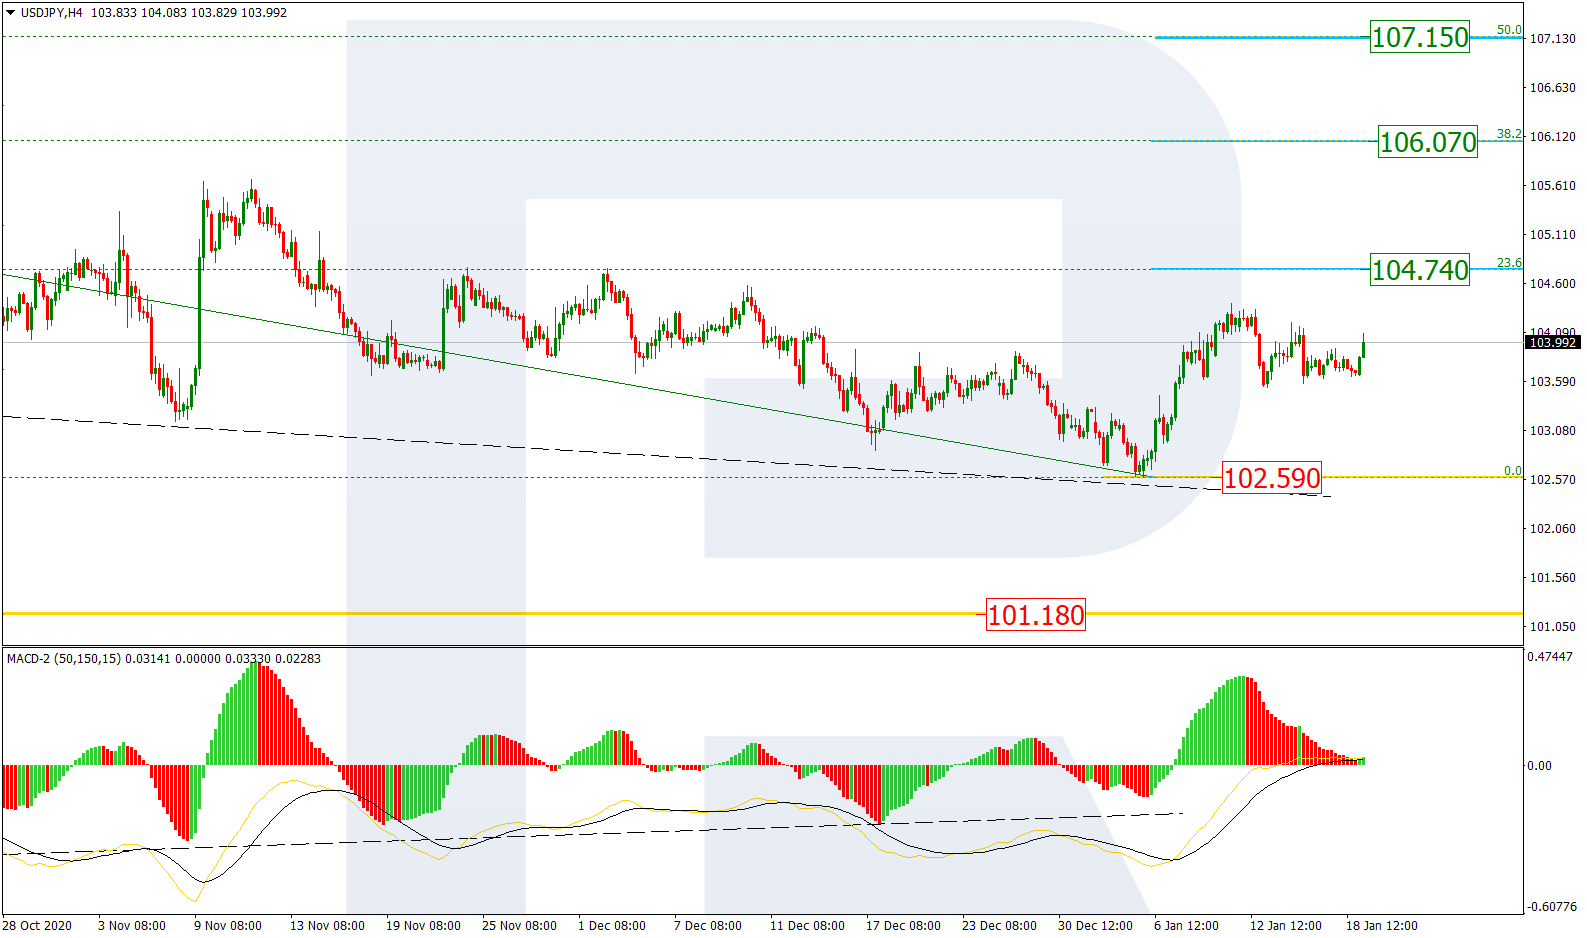
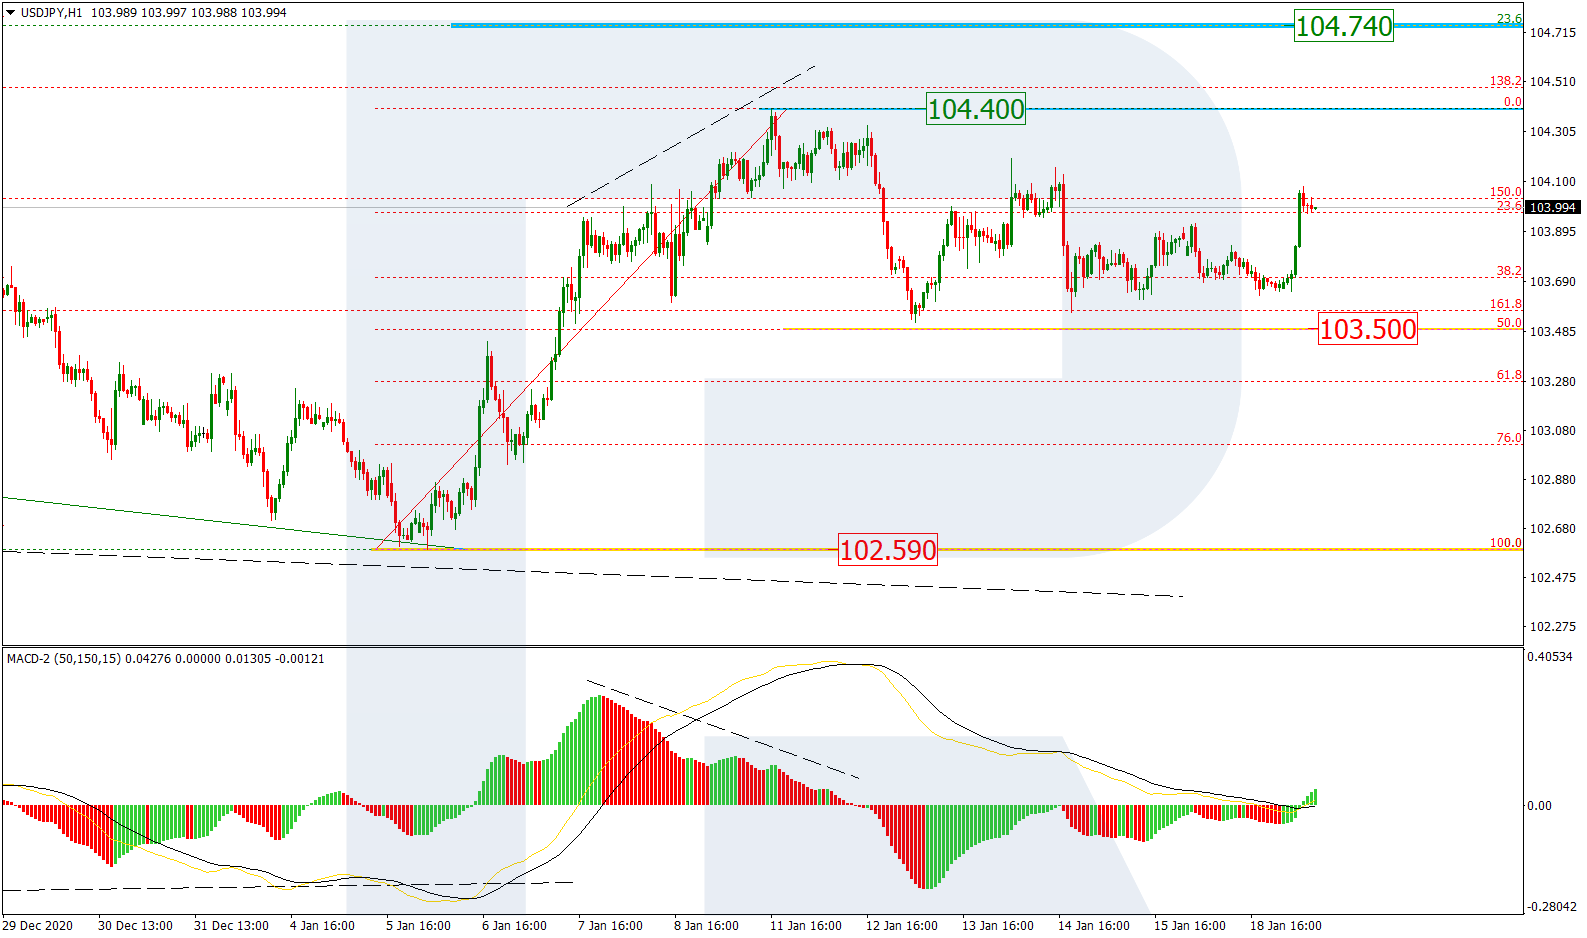
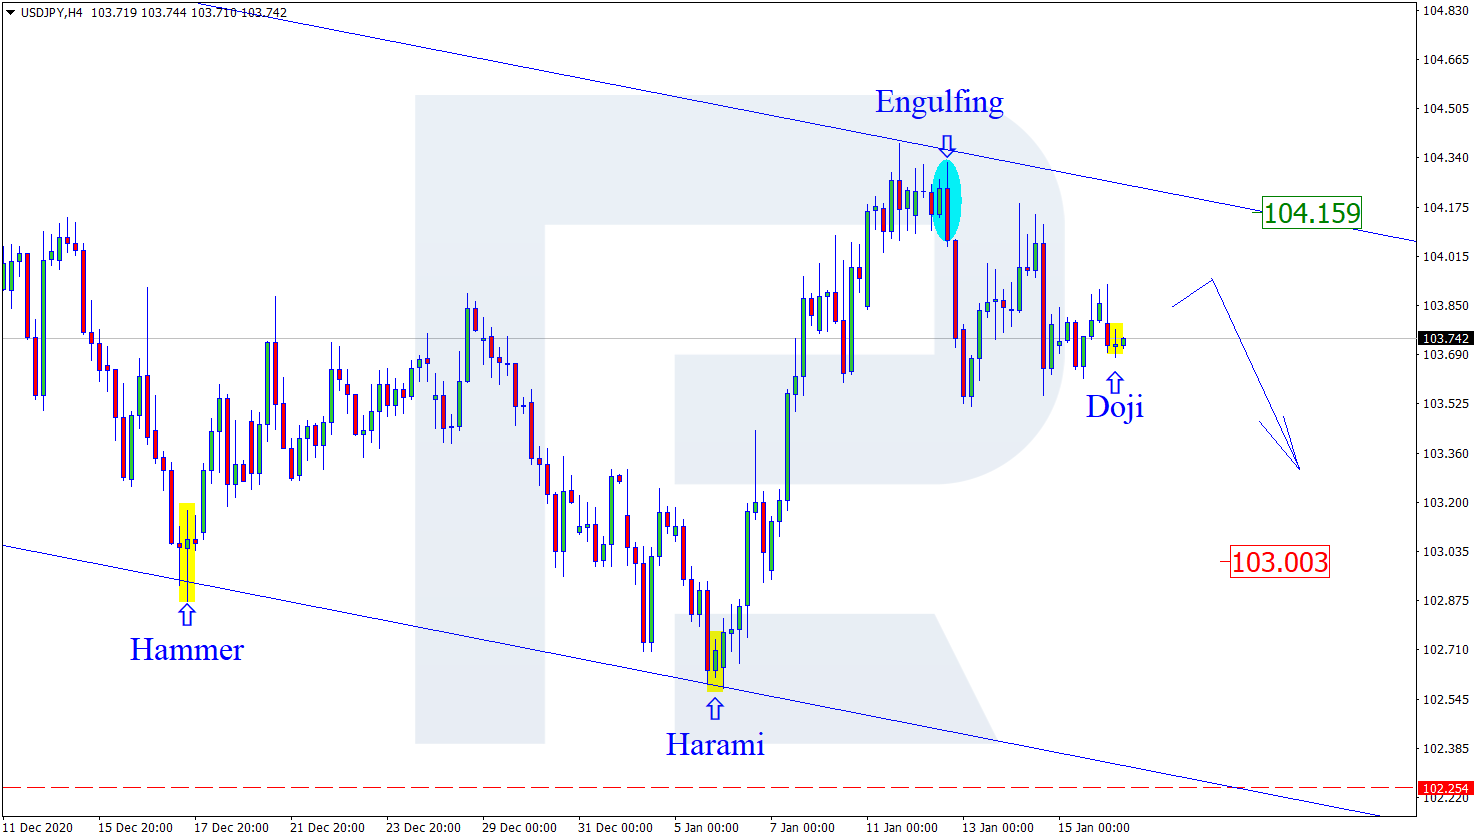
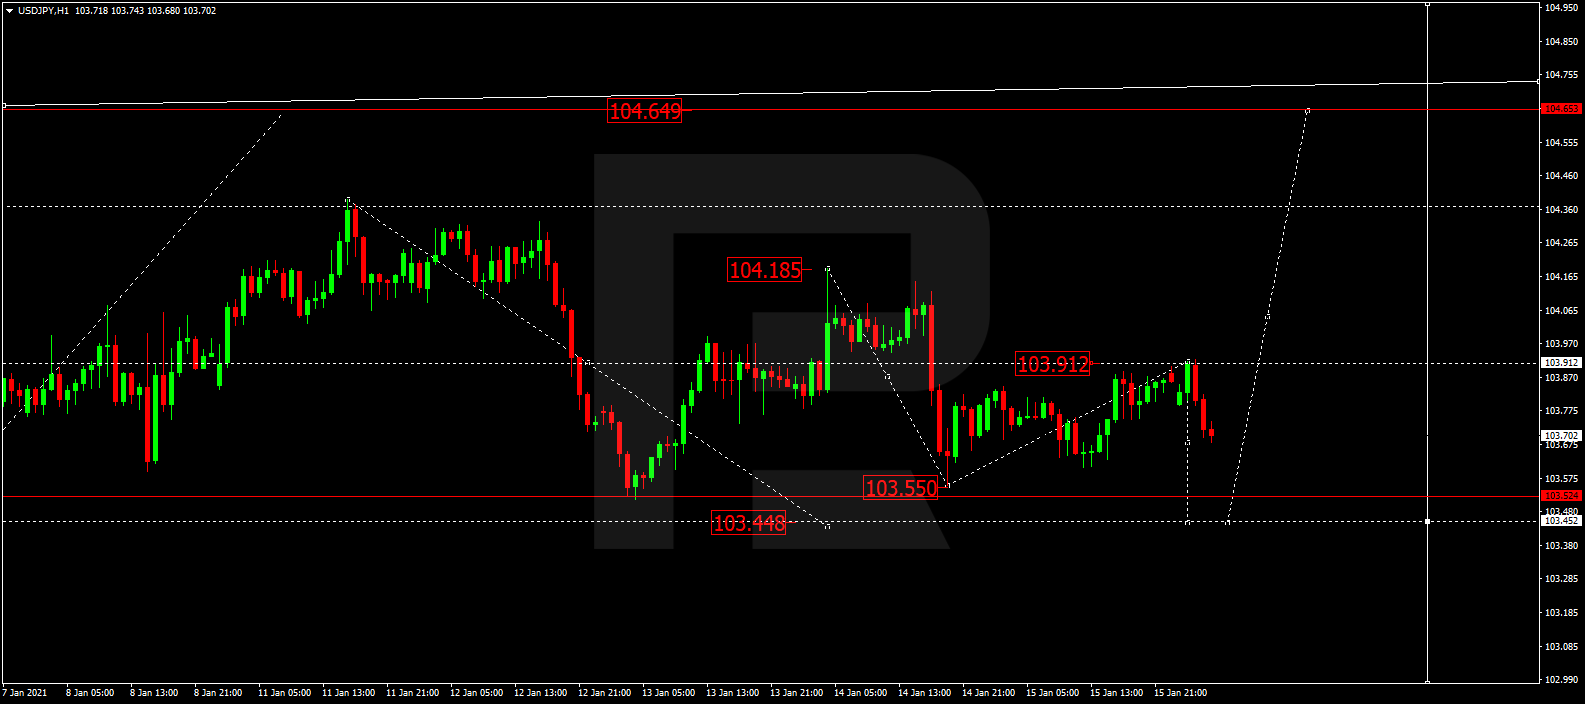
USDJPY, “US Dollar vs Japanese Yen”
After rebounding from 103.91, USDJPY is falling towards 103.44 and may later grow to break 104.00. After that, the instrument may continue trading upwards with the target at 104.60.
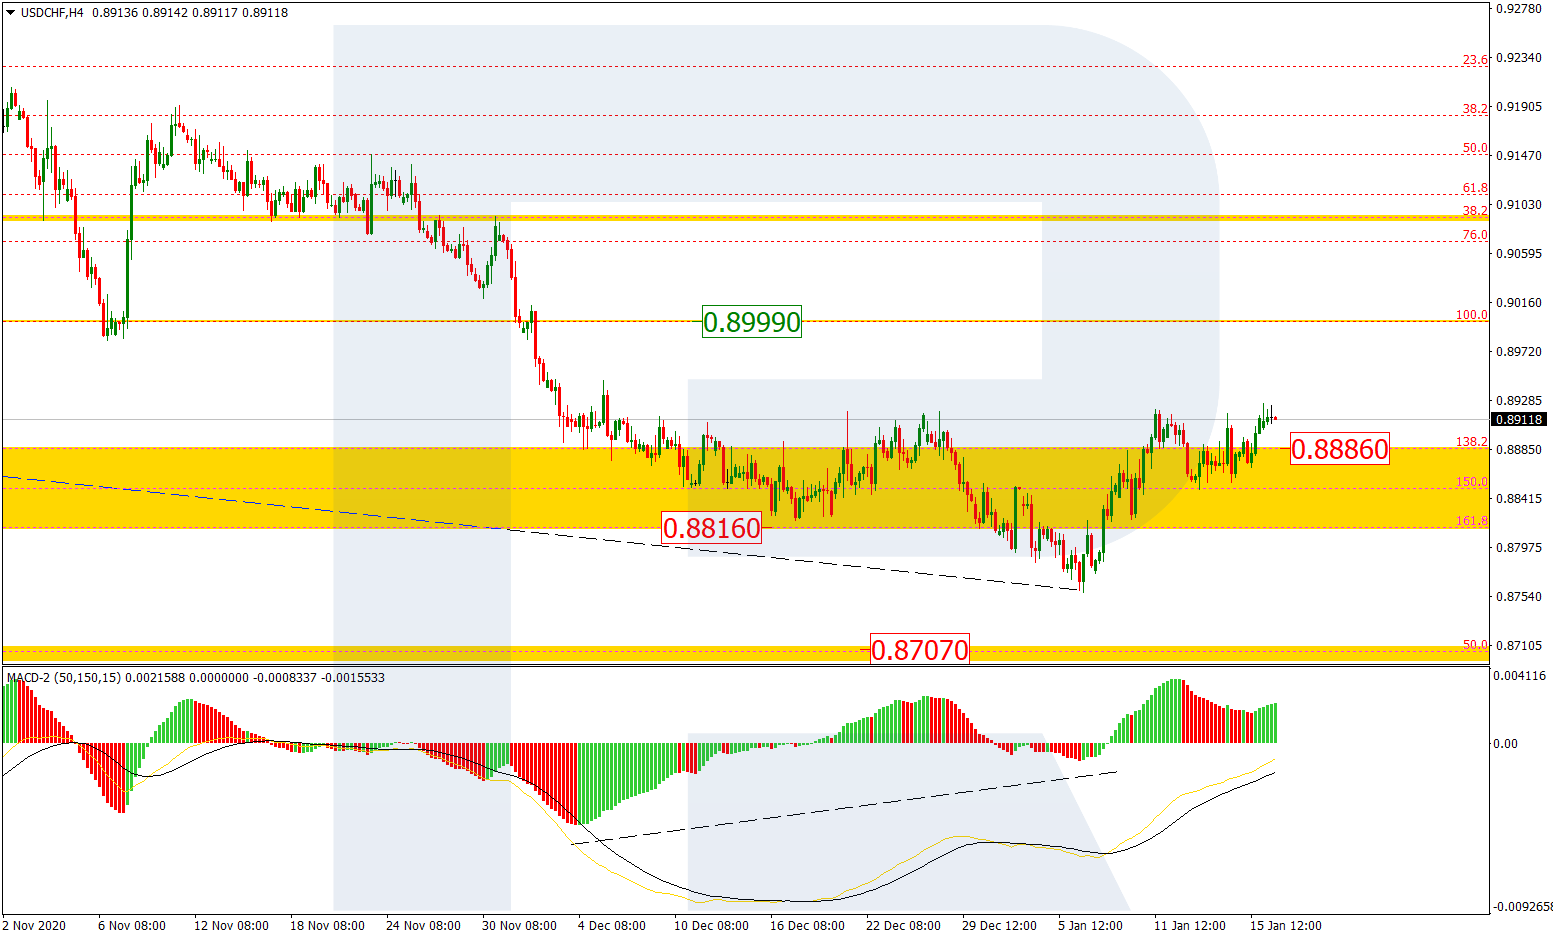
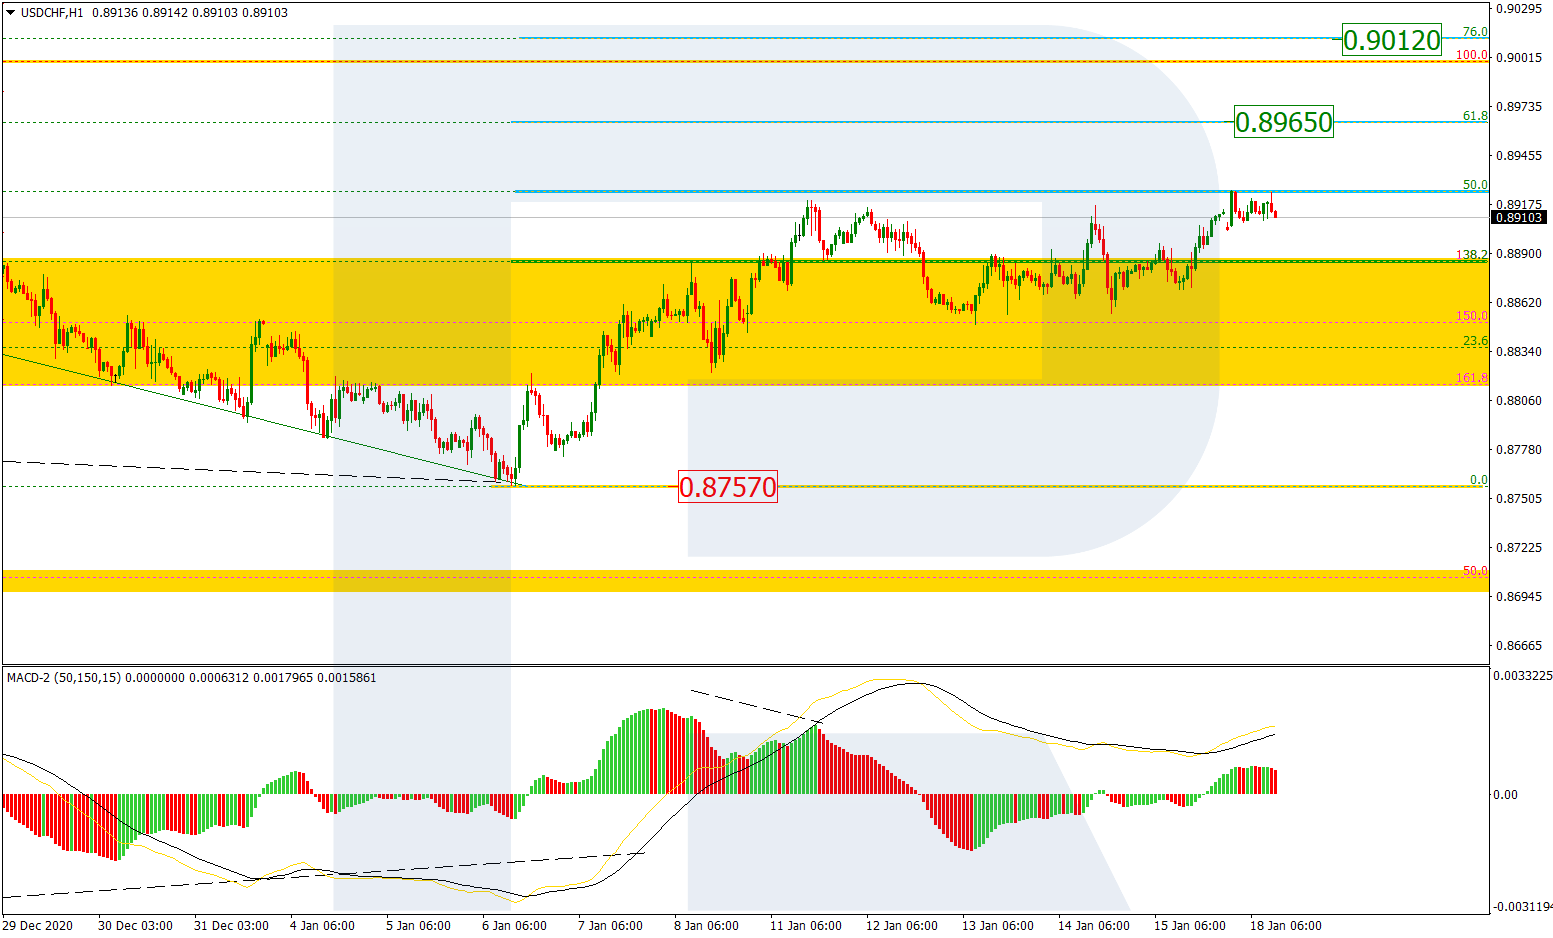
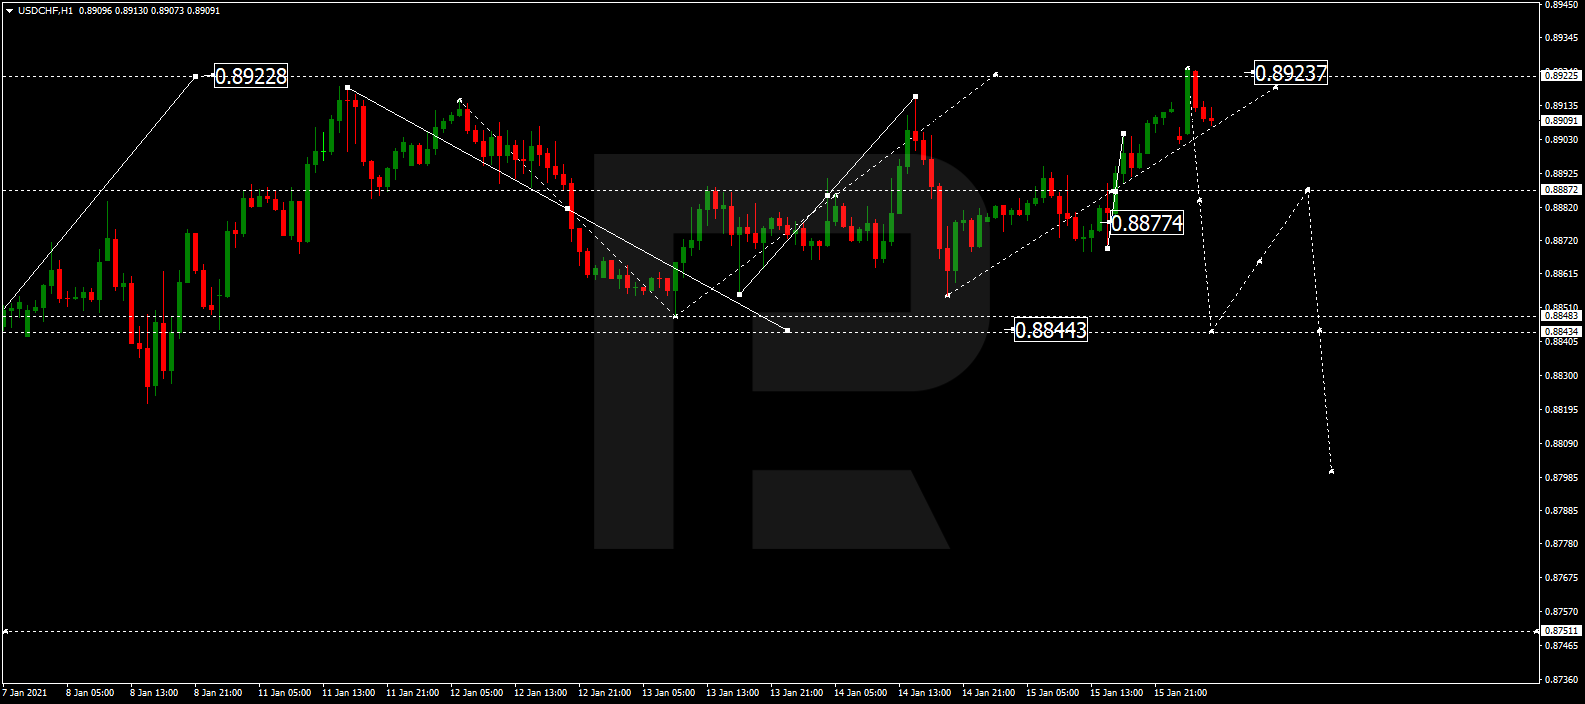
USDCHF, “US Dollar vs Swiss Franc”
USDCHF has finished the ascending structure at 0.8923; right now, it is still consolidating around this level. Possibly, the pair may expand the range up to 0.8937 and then form a new descending structure with the target at 0.8844.
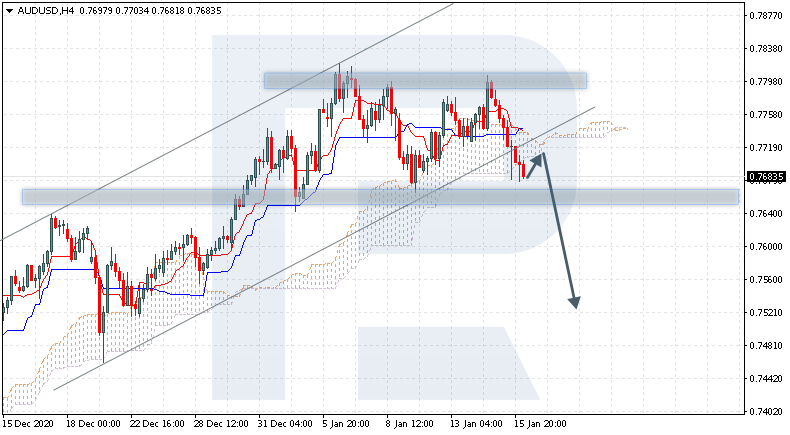
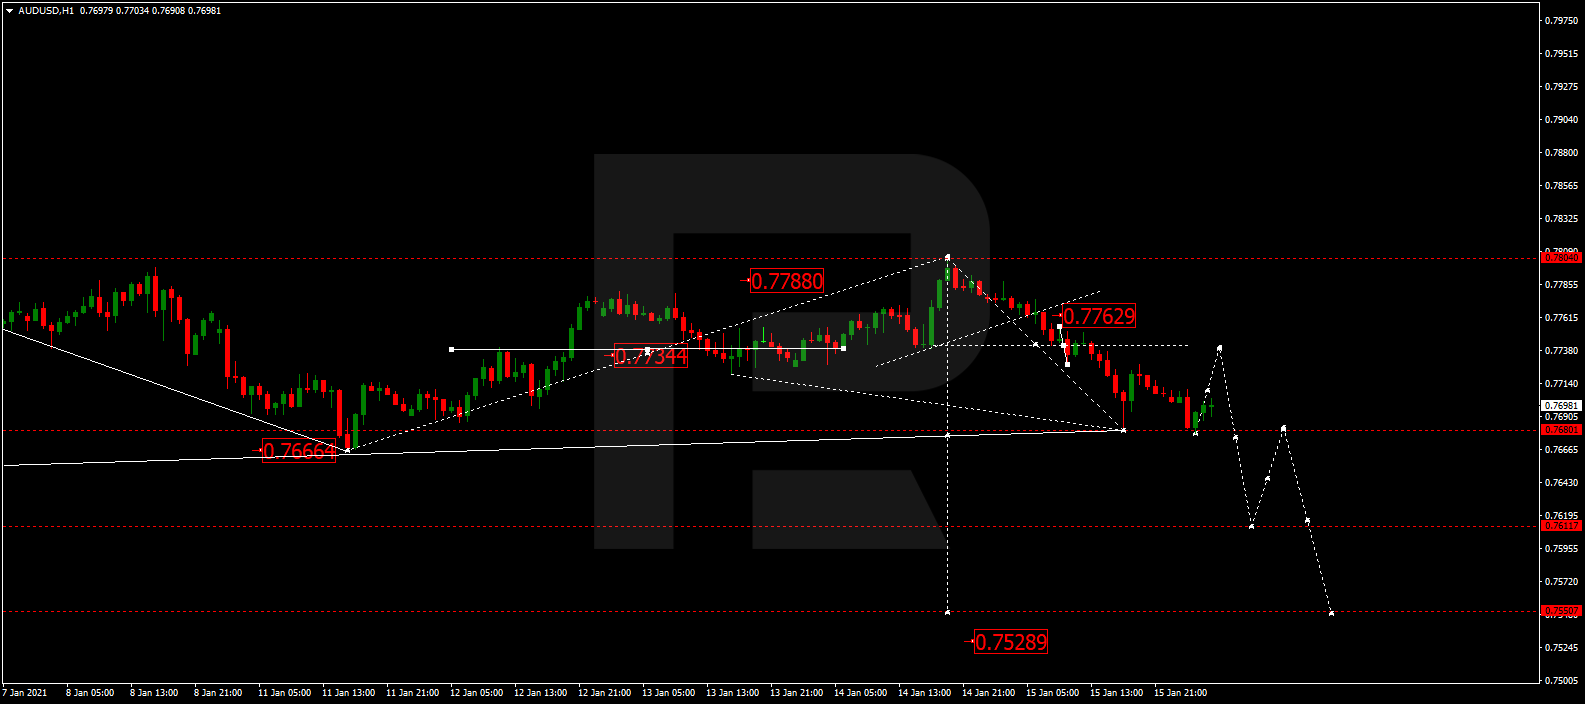
AUDUSD, “Australian Dollar vs US Dollar”
After completing the descending wave at 0.7660, AUDUSD is expected to correct towards 0.7760. Later, the market may return to 0.7660 to break it to the downside and then continue trading downwards with the target at 0.7530.
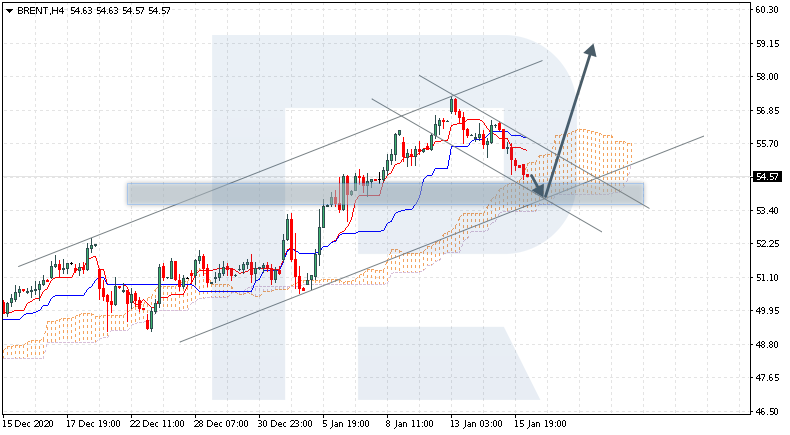
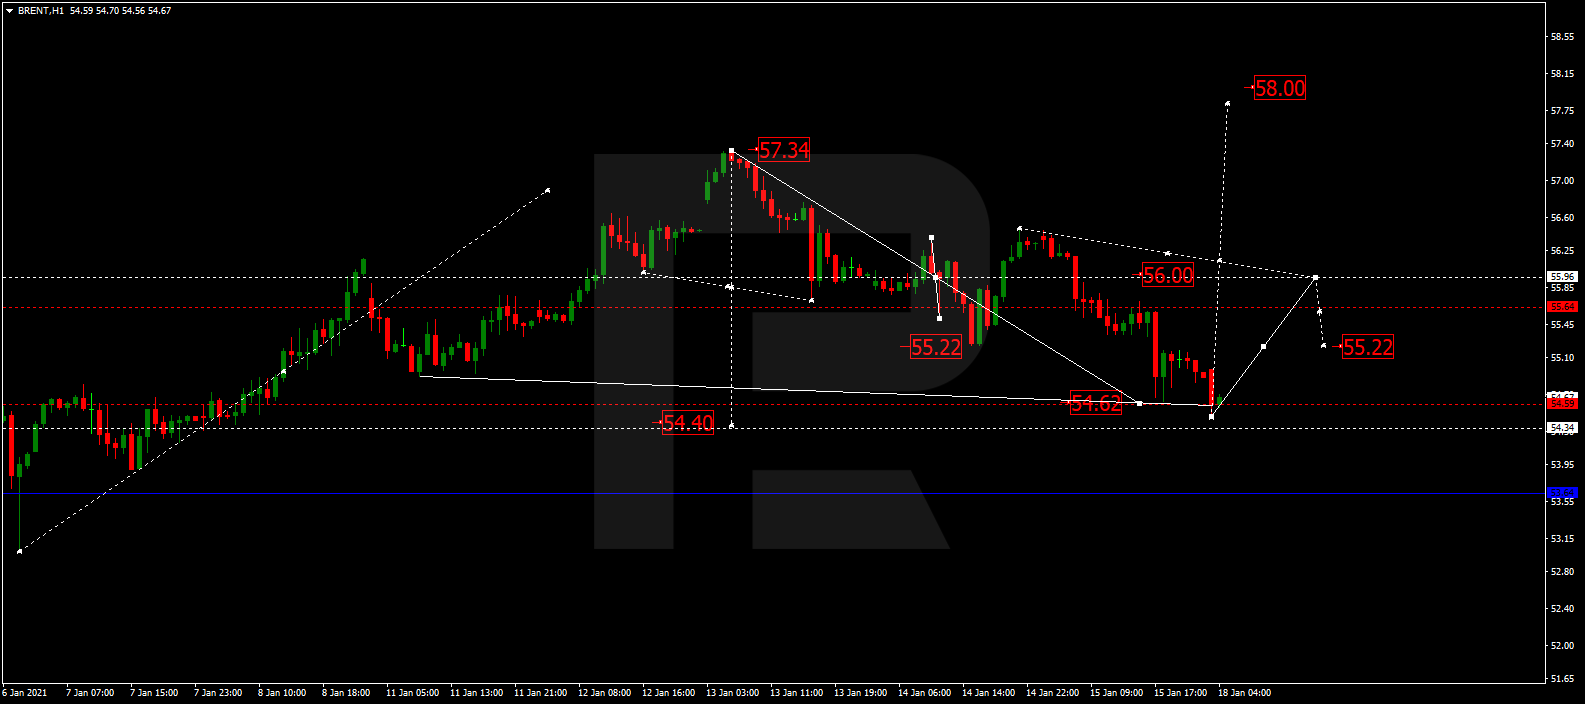
BRENT
After finishing the correction at 54.60, Brent is expected to consolidate around this level. If later the price breaks the range to the upside, the market may start a new growth to break. After that, the instrument may continue trading upwards with the target at 58.00.
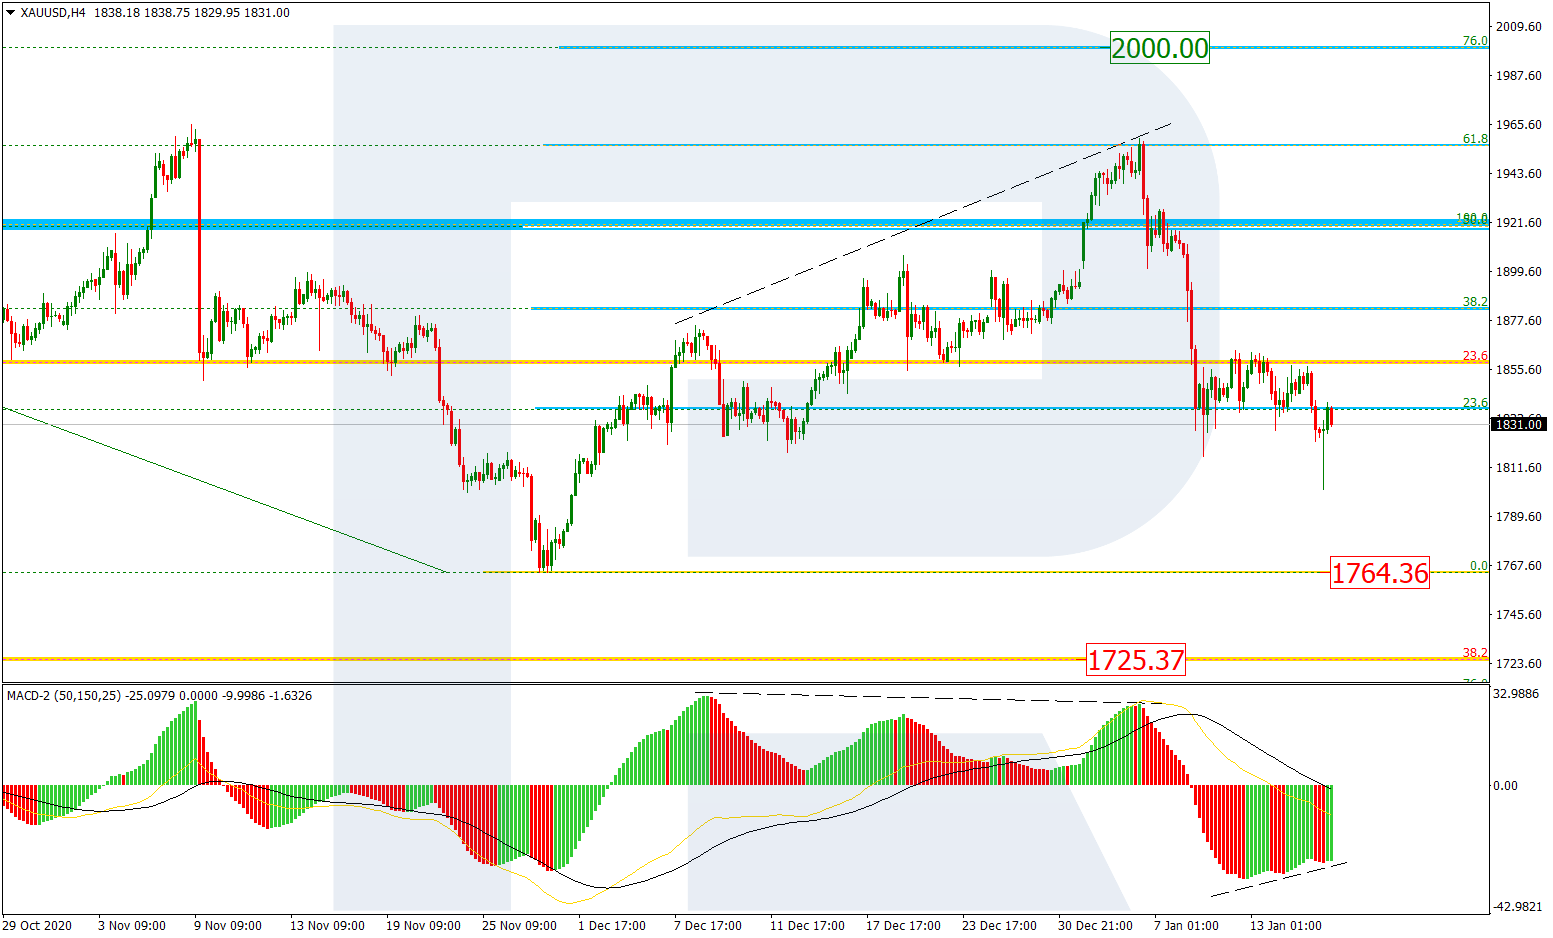
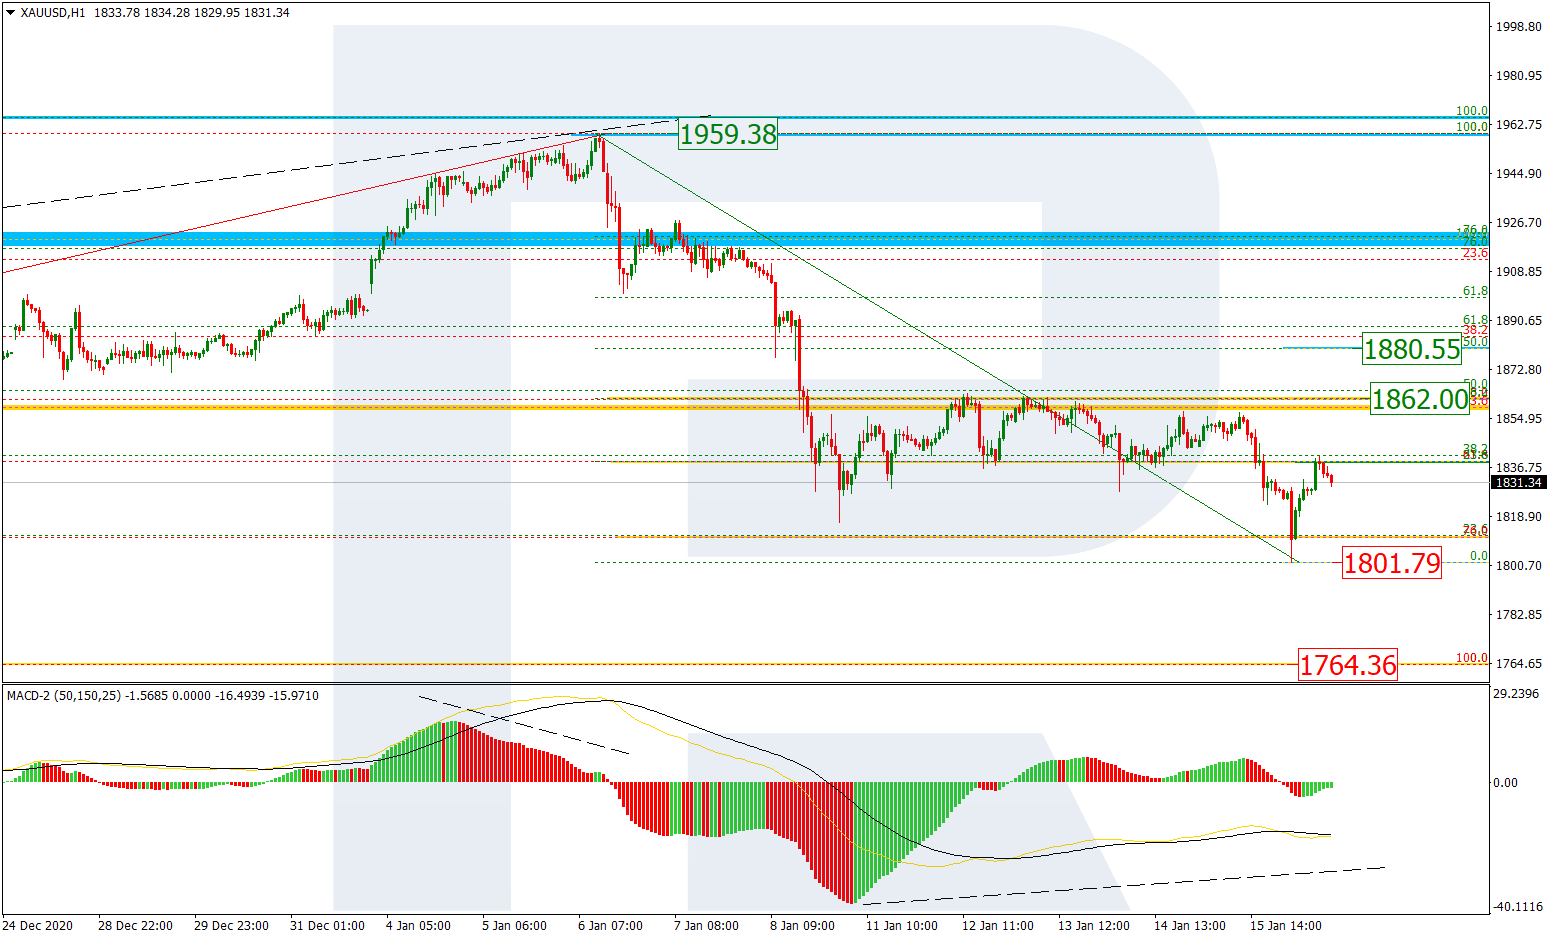
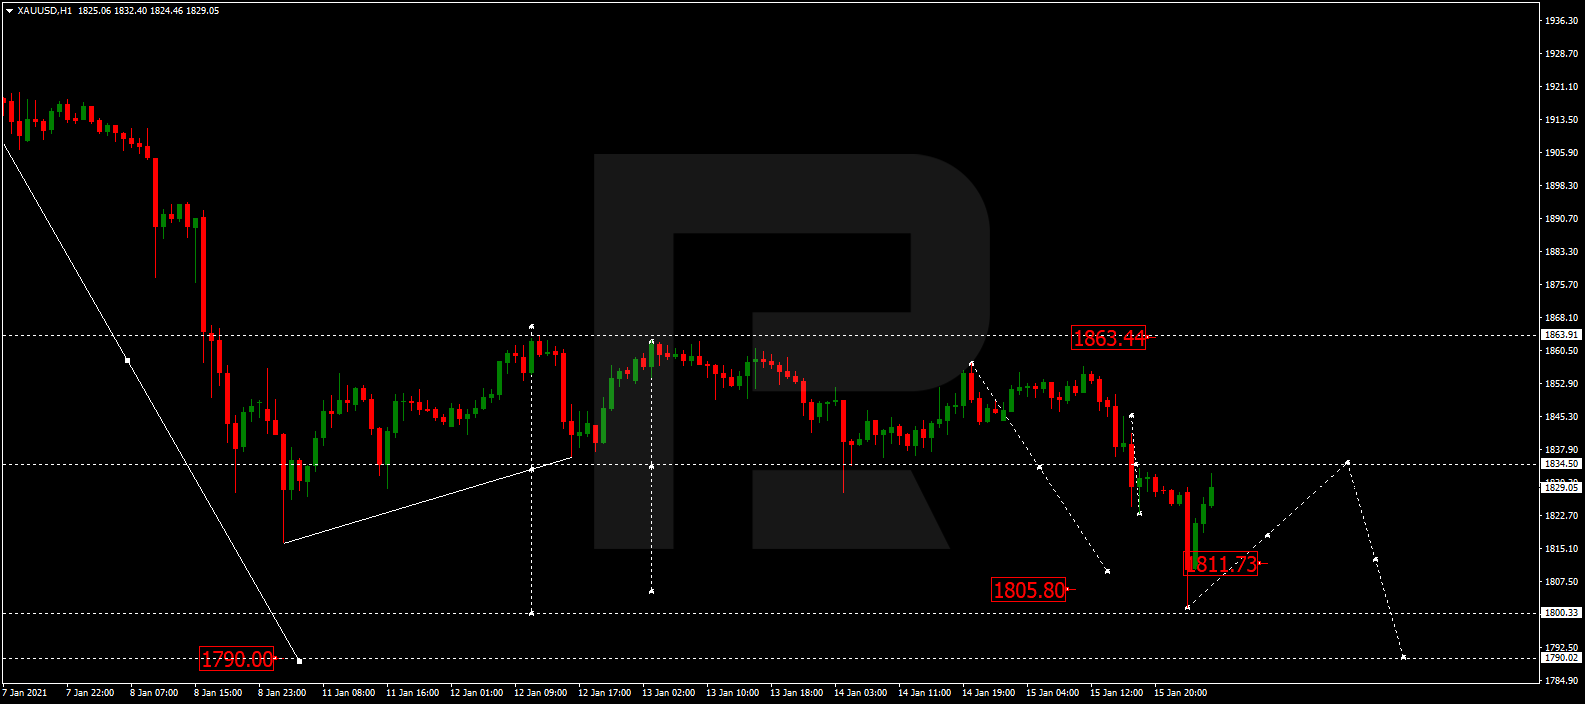
XAUUSD, “Gold vs US Dollar”
After forming another consolidation range above 1834.00 and breaking t to the downside, Gold has reached 1805.80; right now, it is growing to return to 1834.00 and test it from below. After that, the instrument may form a new descending structure with the target at 1790.00.
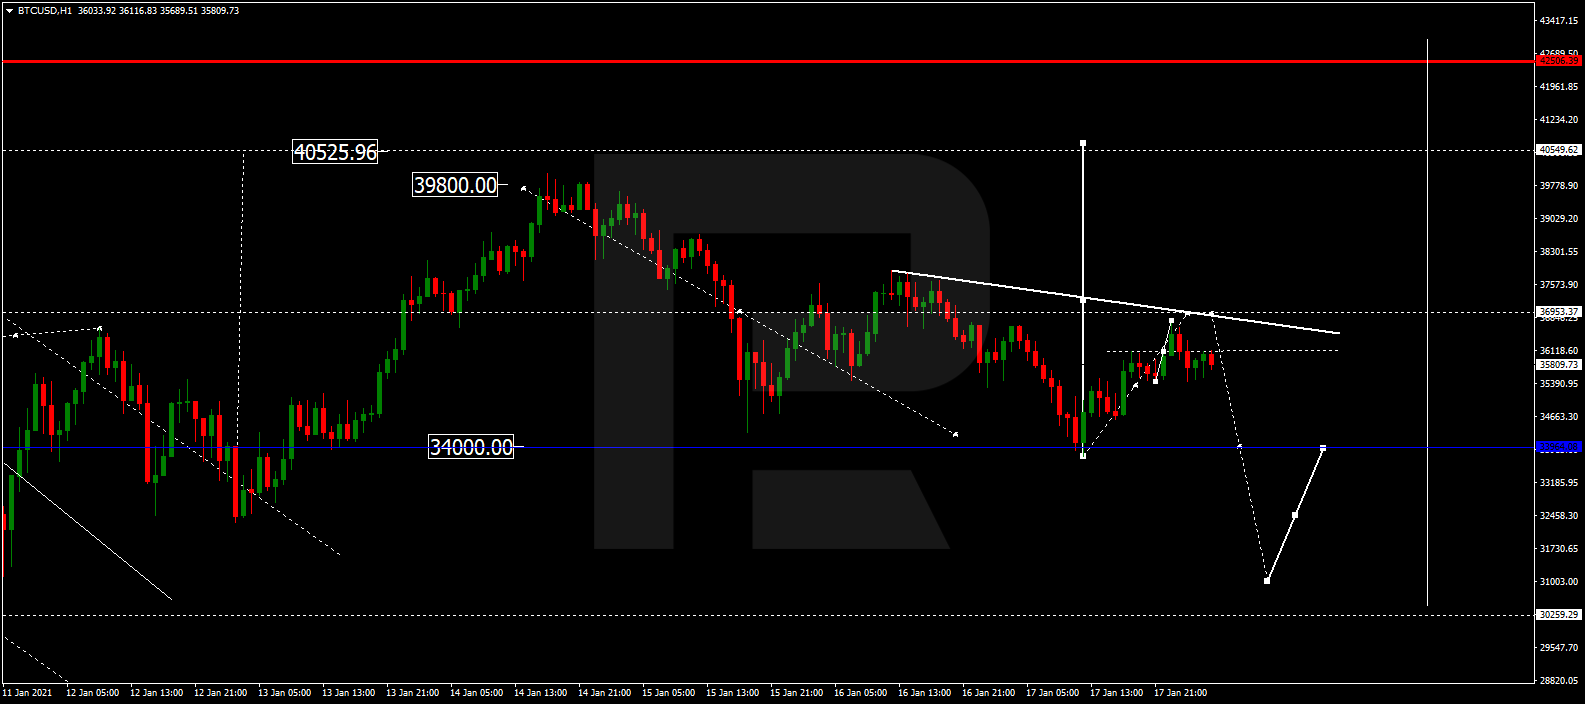
BTCUSD, “Bitcoin vs US Dollar”
After finishing the descending wave at 34000.00, BTCUSD is expected to correct towards 37000.00 and may later start a decline new growth to reach 35000.00, thus forming a new consolidation range around 37000.00. If the price breaks the range to the downside, the market may resume trading downwards to reach 30000.00; if to the upside – form one more ascending structure with the target at 40500.00.
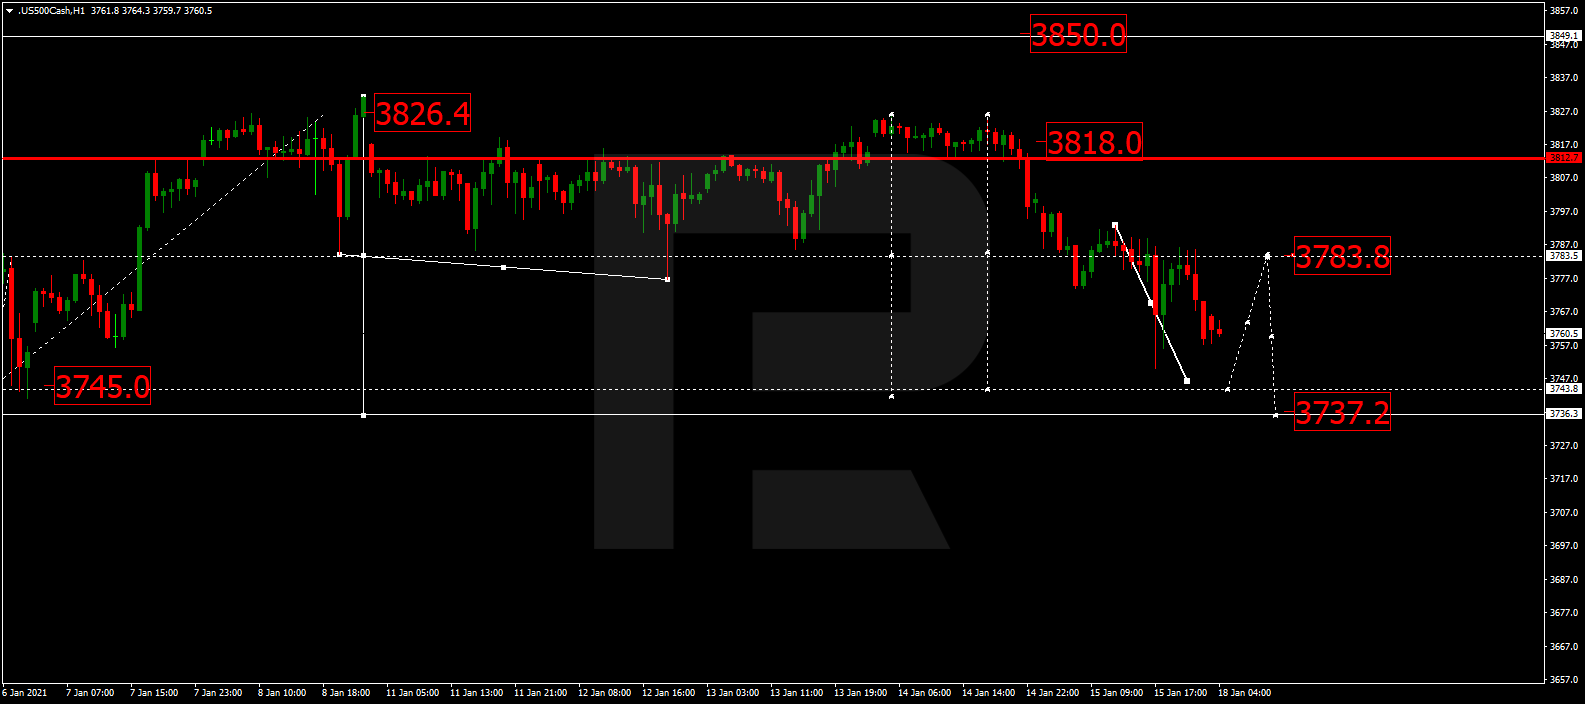
S&P 500
The S&P index is still falling to reach 3737.2 and may later correct towards 3783.8. After that, the instrument may resume trading downwards to break 3730.0 and then continue falling with the target at 3660.6.