rfxsignals January 30, 2021 No Comments

FSO_Harmonic Scanner

FSO_Harmonic Scanner


The FSO Harmonic Scanner System V2 has a sophisticated correlation engine that is able to show a projection about future price action to confirm the harmonic pattern, based on the correlations identified in the dealer trading history. Since correlation engine displays the future and not the past it has some pretty amazing effects on our psychology as a trader. The right moment to execute the order will be shown by a safety confirmation(arrow signal) on the chart. This security feature will prevent you to trade a not fully developed harmonic pattern since they need hours to establish completely before the swing initiates. The embedded prize grid is the best help to project TP & SL. Those very same prize grids are used by Market Maker/Dealer to calculate their moves since these guys having daily limits to push the prize.

If you want to trade accurately you need to know the moves of the Market Maker/Dealer before they start to move! My Mentor used to say, “when you move I move”! Steve, I love you man! The F50 Harmonic Scanner V2 including email Alerts is not just an ordinary Harmonic Scanner as you can find online a lot. In addition to the Harmonic Scanner you will have Harmonic Pattern Email Alerts which will fire on the 4h time frame only by scanning 27 currency pairs 24h/5 days a week. And very important you ONLY will be alerted if the following pattern starts to paint:
• Peak Formation False/Trap Move Week Beginning (swing trade)
• Peak Formation Mid Week Reversal (swing trade)
• Peak Formation False/Trap Move Week Ending (swing trade)


Free Download

rfxsignals January 30, 2021 No Comments

ProFx 4.0 Forex Trading Strategy

ProFx 4.0 Forex Trading Strategy


By forex21.com


Indicators :

ProFx Bar Close Time
Provides you with information when the actual bar will be closed. Font size and text color can be changed in the settings.

ProFx Moving Average
It’s a customized version of the well known Moving Average​ indicator. The MA is used to determine the short term momentum and best time to exit trades. Parameters which can be adjusted are Period, Shift, Method (Calculation Method), Applied Price (which price is used for calculation) and Bars Count. 
ProFx Heiken Ashi
Instead of regular candle sticks we use Heiken Ashi candles in ProFx because it helps to reduce the ’noise’ on the chart. ‘Bar Count’ can be changed in the settings.

ProFx Strength Oscillator
A proprietary indicator which shows how strong or weak the current up/down price move is. The following parameters can be changed: Period (1-3), Applied price (which price is used for calculation) and Bars Count.

ProFx Multi Analyzes
A proprietary indicator which combines GHL, Woodie CCI, TVI and T3 Slope in one indicator. The indicator is mainly used as confirmation indicator. The indicator is used for signal generation but is not part of the standard template.
ProFx Probability Cloud
A proprietary indicator which provides visual information about market direction. The indicator is used for signal generation and is also part of the ProFx Standard template.

ProFx Better Stochastic
A proprietary indicator which is based on the very popular work of Mr. Lane. The indicator is used to determine possible turning points and to optimize trade entries.
Trading Instruments
ProFx 4.0 is a very flexible trading system and can be used on many different instruments. This includes not only currency pairs but also Indices, Commodities, Virtual Currencies (Bit Coins, Lite Coins, etc.), Stocks and, of course, all sort of derivate instruments such as CFD’S and options. However, if you are new to trading or just started to use ProFx 4.0, it is highly recommended that you use GBPUSD or EURUSD for the first 30 – 90 days. It’s because these are major currency pairs which tend to trend very well. Besides, they offer very high liquidity and the low execution costs.

Money Management Rules
We recommend starting with a risk of 1% per trade. The advantage of using very low risk per trade is that even when to make a few wrong trading decisions, your draw down will be very low. As soon you are 100% familiar with the trading rules you can use a higher risk for trading to boost your profits.
Entry Rules
1) ProFx 4.0 signal arrow needs to be shown on the chart.
2) The signal needs to be confirmed by the ProFx 4.0 probability cloud.
3) The signal bar opened below/above the custom moving average.
4) Momentum increases.
5) Direction should be confirmed by higher timeframe chart. (H4 or D1)
6) Signals during the EU/US session are preferred.
7) Signals which occur during a tight price range should be ignored.


Exit Rules
1) Trades should be kept open as long all indicators confirm that the price will keep rising/falling.
2) When the signal lines of the Strength indicators are crossing (gray), and the heiken ashi candles change from blue to white or vice versa, the trade should be closed.
3) When the price turns quickly because of high impact news, indicators should be ignored, and the trade should be closed immediately. 
Timeframe Rules
ProFx 4.0 can be used on any time frames and with many different instruments. However, our experience is that the M30 TF in combination with the H4 TF (trend confirmation) is the best choice.

General Rules :

Do not place more than 1-2 trade per day.
This is also known as “One/Two strike(s) out rule.” It helps to reduce the monitoring time, keeps the psycho-logical pressure at very low level and acts as time filter during market periods with choppy market conditions.

Do not trade during holiday session.
During holidays markets are much more unpredictable. Therefore it is highly recommended not to trade dur-ing holiday sessions such as US, EU national holidays and shortly/after the new year.

Write a trade log for every trade.
Writing down why you entered and exited a trade will help you to increase your trading skills and help you to make the same mistake multiple times.

Decrease SL value before major news to protect your trading account.
Major news are often unpredictable. They can work for and against you. Whenever major news are about to be released, make sure you adjust your SL.

Accept that you cannot be always right.
We have no doubts that when you follow the trading rules that you will be able to generate constant profits  using ProFx 4.0. However, in order to succeed you have to accept that you will be not always right and that
there will be periods where you have to deal with draw downs. Only when you accept that and stick to the trading rules during difficult market conditions you will succeed as currency trader.

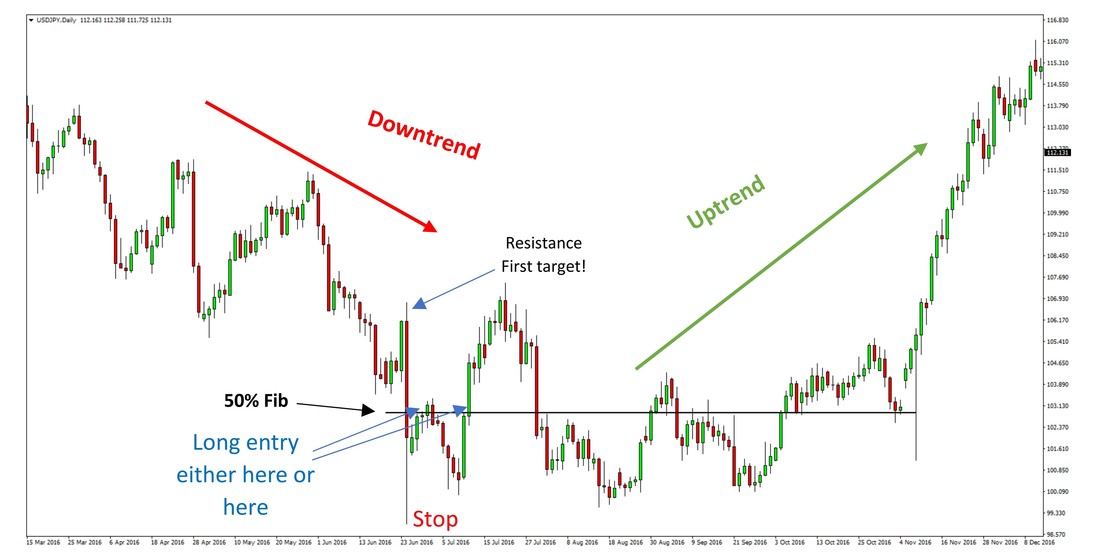
Trade with the Trend
Every trader knows the saying “The trend is your friend.”. Keep it in mind when placing a trade.


Free Download

rfxsignals January 30, 2021 No Comments

Lucky 5 forex system

Lucky 5 Russain forex system


Правила входа и выхода

• Один раз в час ставим отложенные ордера на ценовые 00, 0.1, 0.2, 0.3,0.4, 0.5,
0.6, 0.7, 0.8, 0.9
• Торгуем только в направлении свечи D1
• Входим только, если последняя свеча H1 совпадает по направлению с D1
• Начинаем торговать с открытием Франкфурта, заканчиваем спустя 2 часа
после открытия Нью-Йорка
• На открытии Франкфурта торгуем только уровни 0.4, 0.5, 0,6
• Не продаем на 0.1 и Не покупаем на 0.9
• Тейк-профит 5 пунктов, стоп-лосс 10 пунктов
• Переводим позицию в безубыток после 3,5 пунктов прибыли. Также на уровне
3,5 пунктов включается трейлинг стоп. Контроль выполняется автоматически с
помощью советников — см. видео
• До границ ADR должно быть хотя бы 10 пунктов
• Не торгуем за час до и полчаса после выхода важных новостей
• Цель — 10 пунктов в день, далее прекращаем торговлю (совет автора ТС)
• Если цена уже прошла adr , больше в этот день не торгуем
• Торгуем только первое пересечение уровня!

Indicators :
Daily open line.mql4
Grid_v2.mql4
Market Panel Clock.mql4
Market Panel Display Controller.mql4
M-Candles.mql4
SweetSpotsGOLD_TRO_MODIFIED_VERSION.mql4
Udinefx RN clear levels.mql4
UFX TREND multiMeter.mql4
UFX_FIFO RULES.mql4
xADR_0.2renko.mql4

experts :
Wheelbarrel Trailing_v1.2.ex4
WUKAR.ex4


Free Download

rfxsignals January 30, 2021 No Comments

TradeSeven Mystery Data System

TradeSeven Mystery Data System


By // tradeseven.com/mystery-data/

Mystery Data includes colorful buy-sell arrows which indicate the trend direction. It is powerful and unique to predict top and bottom points. It can be used for Forex, Binary Options, Stock Markets.

First tool is including arrows which are not repainting and not recalculating. Once arrows are appeared in the chart, they will not wink in the current candle. Arrows do not vanish in future. It has an advantage of that it does not make traders confused. Second tool named Histox is the confirmation of arrows.  Lost trades are minimized.

The arrows are including alerts of all signal messages, push and email.

After an arrow provides a signal, trader should wait for the second tool which is histogram. If both tools indicate same direction, the trader can safely open a position in trading.


Attached :
_Histox.ex4
_Mystery Data.ex4
Mystery Code System.tpl
Mystery Data manual.pdf


Free Download

rfxsignals January 30, 2021 No Comments

Stochastic Maestro 5 system

Stochastic Maestro 5 system


Take the signal from crossing the MA and confirm it with Stochastic.
Works for all forex Pairs and all time frames.

Why Moving Averages are important ?

Moving Averages smooth the collected price data from a given instrument and form a line on the chart. Traders call the MA a trend-following indicator. The most important thing to understand is that MA really does not predict the future price direction. The MA’s main purpose is to define
the current trend direction with a little bit of a lag. Of course this lag is more than normal because we are using data from history and plotting it on the chart.
The two most popular versions of the MA indicators are the EMA (Exponential Moving Average) and the SMA (Simple Moving Average).

Indicators and Template:
HeikenAshi_DM.ex4
Candle-Closing-Time-Remaining-(CCTR).mq4
KEN_fast_sBar_mtf.ex4
MA_in_Color.ex4
oT_S_Ra-Signal_Line.ex4
precision_trend_histo_2.ex4
Murrey_Math_Modified1.ex4
Signal_Bars_v3_Daily.ex4
Stochastic-Maestro.tpl


Free Download

rfxsignals January 30, 2021 No Comments

Cougar FX System

Cougar FX System

By // cougarfx.com

How to put this information to practical use?

Firstly, ‘Today Range’ indications tell us how much “space” left there is on a  given instrument until the maximum is reached for the day. If, for example, TR shows 50pips, and ADR (5) and ADR (30) indicate 100pips, it’s very likely the instrument you’re observing will get closer to these values, providing additional 50pips of movement.

Another very important piece of information from the indications of ADR is the change of the market’s sentiment and dynamics, which can be derived from the mutual relation of ADR 30 and ADR 5.  If ADR 5 is lower than ADR 30, it means the volatility prevalent on the market is currently decreasing, and a smaller price range for each day can be expected.  If ADR 5 is higher than ADR 30, it means dynamics on the market are growing by the day, so you can count on greater movement range.

When to use a break even order?

An open order that generate profit can be secured by a BE order. For example, if your trade generates profit of 1R and the price moves very dynamically, you can use a BE order which will secure this transaction in case the price reversal.
A handful of advice:

– glance through the calendar of economic news before each day of trade. If  there are some important ‘red’ news, it is best to wait until they are announced.

– pay particular attention to days in the calendar where the most important news are, like: non-farm payrolls, ECB press conference, FOMC. These news are crucial to the market and sometimes investors will wait outside of the market for their announcement.

– do not worry if you are late for a signal. It is better to wait for another trade  than get into one that has already been on its way a long time and may very well turn back.

– As is the case with any system, trading during ‘dead’ hours is not recommended, (after European session close or bank holidays.)

– Trading should be well thought out, and our entrances supported by at least simple analysis. Please take note of the nearest support and resistance areas.

– I advise to spend the first days with the system trading on a demo account to get accustomed to its principles, learn how things work and how to use it appropriately.


Take note of individual days of the week. This is usually how a week goes:

Monday – investors get back to work and perform initial analysis (possible low dynamics).
Tuesday – an exchange of information between banks and investors gets underway,  movement becomes more dynamic.
Wednesday – the market has settled for a direction and follows it.
Thursday – movement reaches its maximum level, everyone attempts to join it.
Friday – profit realization and partial position closure before the weekend (possible sudden and unpredictable movements).


Free Download

rfxsignals January 30, 2021 No Comments

Fibonacci Golden Zone Strategy

Fibonacci Golden Zone Strategy

Leonardo Pisano developed a simple series of numbers that created ratios describing the natural
proportions of things in the universe. And these numbers have been used by traders now for
many years! 

 
Your charting software should come with a standard Fibonacci retracement tool; however, you
are the 
one that puts this on your chart.  The bottom line is that many traders use this tool which
is why it is highly important to have a trading strategy that uses this. 

You are going to need to know where to apply these fibs. You will need to place them on
the swing high/swing low. 

 
A Swing High is a candlestick with at least two lower highs ​on both the left and right of  itself.  A Swing Low is a candlestick with at least two higher lows ​on both the left and right of itself. 

A quick thing to remember about this: if it is an uptrend you want to start with the swing low and
drag 
your Fibonacci level all the way up to the swing high. If it’s a downtrend you start with the
swing high 
and drag your cursor all the way down to the swing low. 
Now, what if we told you there is a simple way to draw the Fibonacci retracement levels on your price chart. 
 
What if everything is done automatically? 
 
Well, our team at Trading Strategy Guides has developed a proprietary Fibonacci Golden Zone
indicator that once placed on the chart it will instantly plot the Fibonacci retracement levels of
the last swing. 

You’ll not need to pick by yourself the swing high/low levels as the Fibonacci Golden Zone
indicator will do the job for you. 

Forex traders identify the Fibonacci retracement levels as areas of support and resistance. 
Because of this, the levels are watched by many traders, which is why the Fibonacci Golden Zone
strategy could be a difference maker to your trading success

 
The Golden Zone is represented by the price area between the 38.2% and 61.8% Fibonacci
retracement. Obviously, the 61.8% is the most critical number in our strategy. 

 
Now that we’ve learned the importance of the Fibonacci retracement levels and why they work
in 
analyzing the financial market let’s have a look at the rules of the Fibonacci Golden Zone
Strategy. 


Attached :
Fibonacci Golden Zone DashBoard.ex4

Fibonacci Golden Zone.ex4
Fibonacci Golden Zone.tpl
Fibonacci Golden Zone manual.pdf
Available for Mt4 , Mt5 , NinjaTrader 7 , NinjaTrader 8


Free Download

rfxsignals January 30, 2021 No Comments

50 Pips A Day Forex Strategy by Damir Laurentiu

50 Pips A Day Forex Strategy by Damir Laurentiu


Price Trends
You surely know what a trend is and you know that you see them on your charts over and over again. The trend is a core principle of the forex market or any market for that matter and should always be taken into account when constructing your trading system. It is always easier to trade with the trend than against it. A trend signifies that the majority of traders decided to push the price in one direction. You must always know what that direction is and trade in line with it. If you want to know everything there is to know about forex trends, how to spot them by reading the price action, how to recognize when the trend is changing without the help of any technical indicators, you can check out the book Follow Price Action Trends that explains this in great detail, with many chart illustrations, and puts it together into a complete forex price action trading system that can yield thousands of pips by trading these changes in trend.


Support and Resistance
Support and resistance levels are also a key component of the forex market; a large number of traders out there emphasizes them on their charts and base their trading decisions on them. Therefore, it is advisable when you decide how to construct your trading system that you take them into account.

Fibonacci Retracements
Fibonacci ratios are another forex tool that works extremely well in the forex market. Just pull up any chart and draw your Fibonacci Retracements levels from the start to the end of any big move in one direction or another. You will see how many times these levels act as strong support and resistance zones where price bounces back to resume the previous trend.


Patterns
Price patterns and candlestick patterns are also very popular with the vast majority of traders therefore, they too have a great rate of success. Price patterns are used as signals that price is preparing for a move in a direction and candlestick patterns are used mainly as a confirmation when entering a trade. If you want to learn in great detail about all of these above powerful trading tools and master them, you can take a look at the Trade the Price Action book that explains them very well with many chart illustrations and puts them together in the form of an extremely powerful price action trading system. In conclusion, these are the things that you should include in your trading system because there are by far the most successful tools to trade the forex market. It is completely up to you to decide if you combine them all in your system or just use some of them. There will be more about these powerful tools in a later section where you will learn how to avoid making trading mistakes when working with them.

200 EMA
From my experience, this moving average is the only indicator that is worth incorporating in your trading system. It is the most important moving average of them all, all retail and professional traders keep an eye on it therefore price tends to bounce when it touches it. However, it is best to use it in your trading system as guidance, as a confirmation of what price action tells you and not as a tool to base trading decisions on. For example, if your system is designed for the 4h chart, you will want to read the price action on that chart to know what the trend is.
After you do that and see that the current trend is up or down, you can then look at the 200 EMA on the same chart to confirm and enforce your price action reading. Let us say the price action trend on that chart is up. If that specific forex pair trades above the 200 EMA at that time on the same chart then you have a confirmation of your price action reading. You can check out the Trade the Momentum book for a complete trading system that uses this moving average along with some other powerful concepts of trading to make 200 pips per week or more.


Free Download

rfxsignals January 30, 2021 No Comments

Forex Kijun Fluction Indicator

Forex Kijun Fluction Indicator


About The System 

Forex Kijun Fluction Indicator is a manual trading strategy that you can use to generate profits from forex market every day. You don’t have to be an experienced trader to be able to use it. In fact, even if you have no trading experience at all you would still make a lot of money from it just like pro traders.
There are many people that sign up to trade Forex that don’t understand or take the time to learn how and why to trade Forex.
There are many risks involved in trading any kind of asset, whether it is stocks, bonds or currencies. If you are interested in trading, make sure you understand Forex risks. One of the biggest Forex risks is a leveraged buy. Some Forex brokerages allow you to hold a certain amount of money in your account but leverage that amount to up to 100 times its worth.
While this can be good if you are on the winning side of a trade, this can be devastating if you lose your entire accounts worth plus many times more. So please, before you start trading .. make sure that you understand and apply money management rules. No matter how powerful the trading system is, without money management .. it will become a time bomb! We recommend not to risk more than 2% of your initial capital per trade.


System Rules
Go Long:
The long signal occurs when Forex Kijun Fluction Indicator lineturns into green color.

Go Short:
The long signal occurs when Forex Kijun Fluction Indicator line
turns into red color.

Exit rules:
Exit trade when Forex Kijun Fluction Indicator turns against your trade direction!


Free Download

rfxsignals January 30, 2021 No Comments

Rapid Cash Accumulator by Nicola Delic

Rapid Cash Accumulator by Nicola Delic


By: Nicola Delic

In this special trading system you will learn how to trade another one of my most powerful trading systems. This is a system that I developed and traded on a wide variety of accounts, and it has proven to be a genuinely profitable method capable of delivering spectacular returns.
I’ve been trading this system for a while now, and it has worked very well for me. I have spent a lot of time fine tuning and tweaking the custom indicators to provide the most accurate trading signals. As you may already know, I love programming my own custom indicator and trading tools. So, I spent countless hours working on the indicators ensure that everything works as expected.
The system itself can be traded on all currency pairs. I personally monitor and trade a wide variety of currency pairs, so you can be sure that this system will provide you with many tradeable signals.
The system can be traded on all time frames, but I would suggest that you start trading it on the M15 or the M5 timeframes for the best results. The system can be traded at any given time, but I would suggest that while you are still learning the system that you stick to the most active trading sessions.
Over the course of this report, I will walk you through the different components of the system. We’ll start by looking at the different indicators you will use. It’s important that you understand what they do and how to read them, so you can spot Buy and Sell trades when they appear on your charts. I’ll then walk you through the rules for identifying both Buy and Sell trading signals and show you a few examples so that you can get up and running with the system as quickly as possible.

Buy and Sell Trade Rules :

Here are the rules for identifying and entering Buy and Sell trades using the Rapid Cash Accumulator system. The rules are followed by a few examples to help you grasp the rules.
REMEMBER! All conditions must be met before any trades may be considered.
Buy Trade Rules :
1. The Direction indicator must show “Trade Bullish Setups”.
2. Wait to spot a breakout of Green Resistance on the SupRes indicator.
3. Confirm the move – the Histogram indicator must be Green and StoRSI must be above 65.
4. If all the above conditions have been met, proceed to enter the market with a Buy trade immediately. You do not need to wait for the candle to close.
5. Place your Stop Loss at the most recent Support line.
6. Place your Take Profit at double the number of pips away from your entry as your Stop Loss (1:2 Risk/Reward Ratio).

The rules for identifying and entering Sell trades using the Rapid Cash
Accumulator is simply the reverse of the Buy trades.
Sell Trade Rules :
1. The Direction indicator must show “Trade Bearish Setups”.
2. Wait to spot a breakout of Red Support on the SupRes indicator.
3. Confirm the move – the Histogram indicator must be Red and StoRSI must be below 35.
4. If all the above conditions have been met, proceed to enter the market with a Sell trade immediately. You do not need to wait for the candle to close.
5. Place your Stop Loss at the most recent Resistance line.
6. Place your Take Profit at double the number of pips away from your entry as your Stop Loss (1:2 Risk/Reward Ratio).


Free Download