rfxsignals January 27, 2021 No Comments

Fibonacci Retracements Analysis 27.01.2021 (GBPUSD, EURJPY)

Fibonacci Retracements Analysis 27.01.2021 (GBPUSD, EURJPY)

27.01.2021

GBPUSD, “Great Britain Pound vs US Dollar”

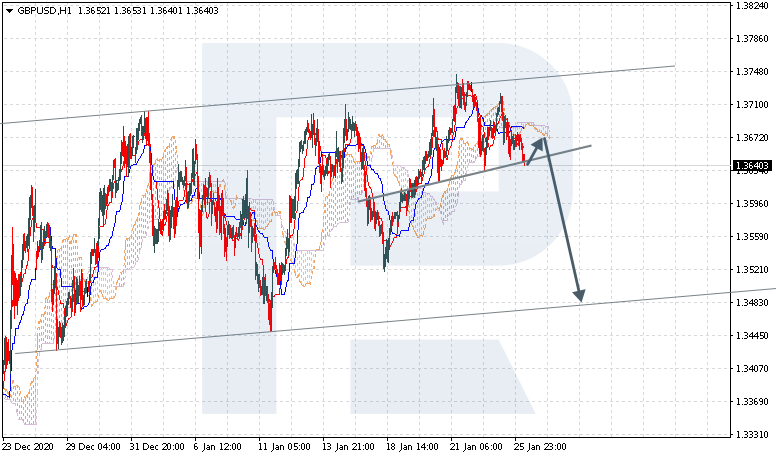
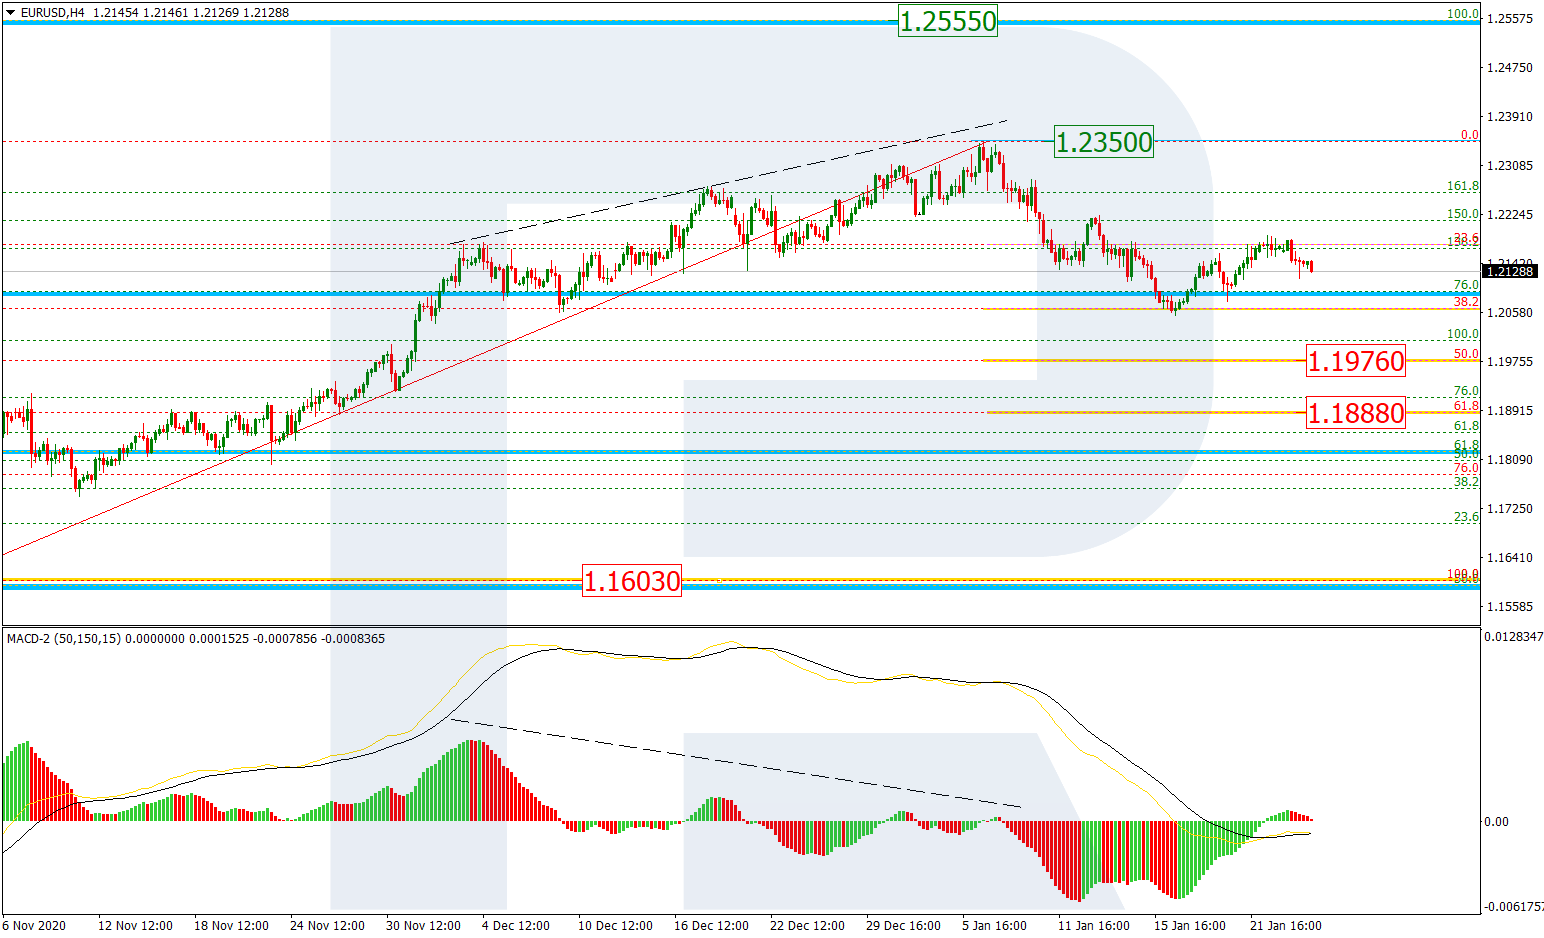
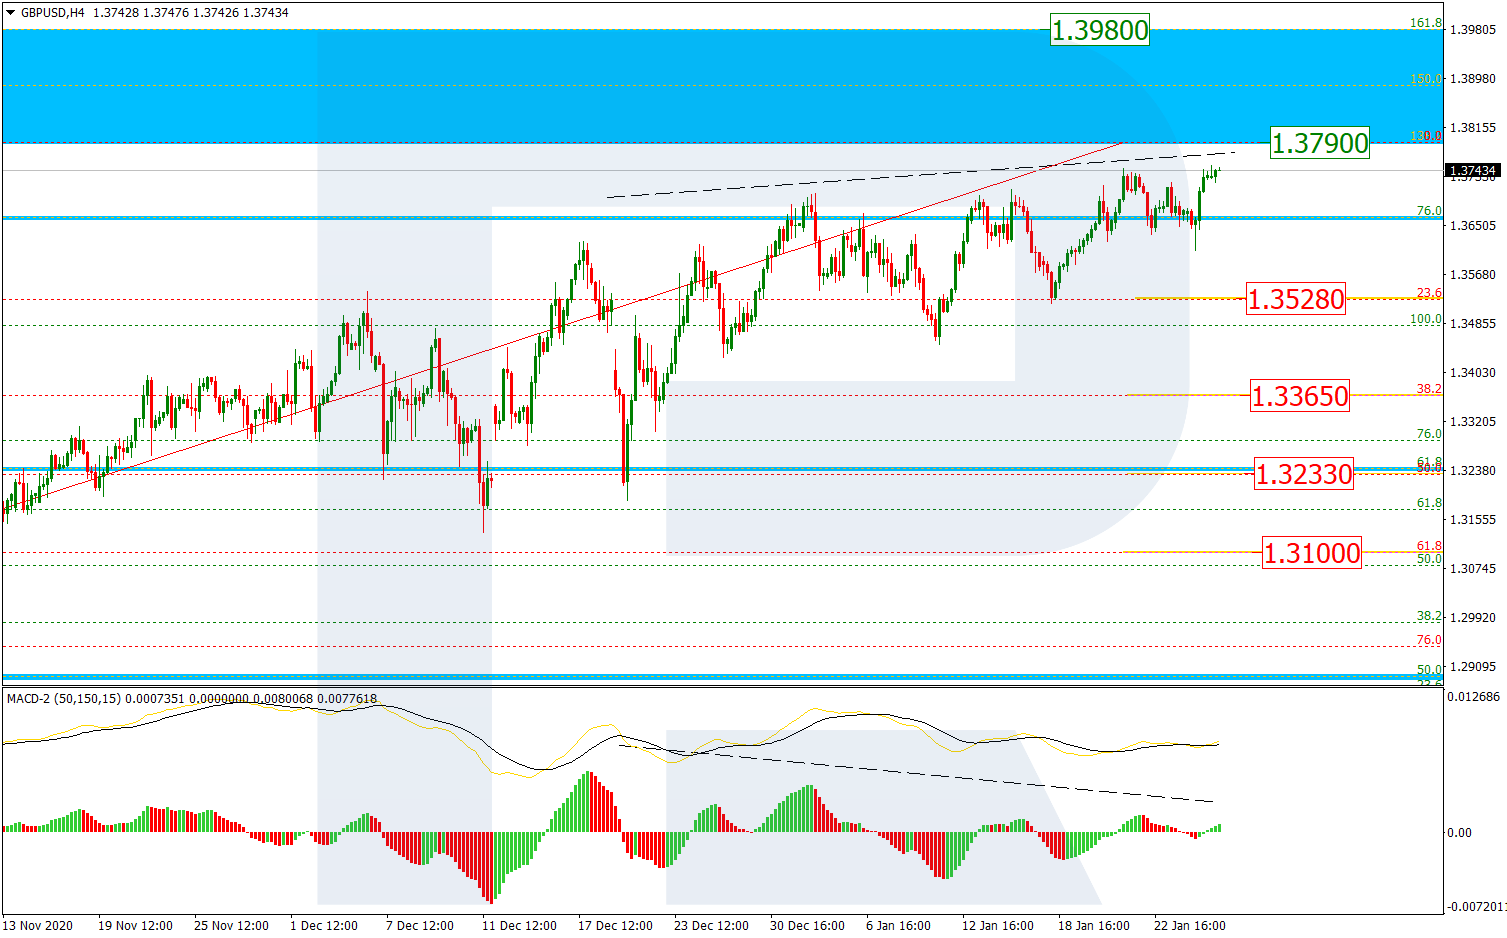
As we can see in the H4 chart, after finishing the pullback, GBPUSD is still forming another rising impulse to reach the post-correctional extension area between 138.2% and 161.8% fibo at 1.3790 and 1.3980 respectively. However, a divergence on MACD implies a possible descending correction towards 23.6%, 38.2%, 50.0%, and 61.8% fibo at 1.3528, 1.3365, 1.3233, and 1.3100 respectively after the price reaches the area’s downside border.

GBPUSD_H4
Risk Warning: the result of previous trading operations do not guarantee the same results in the future

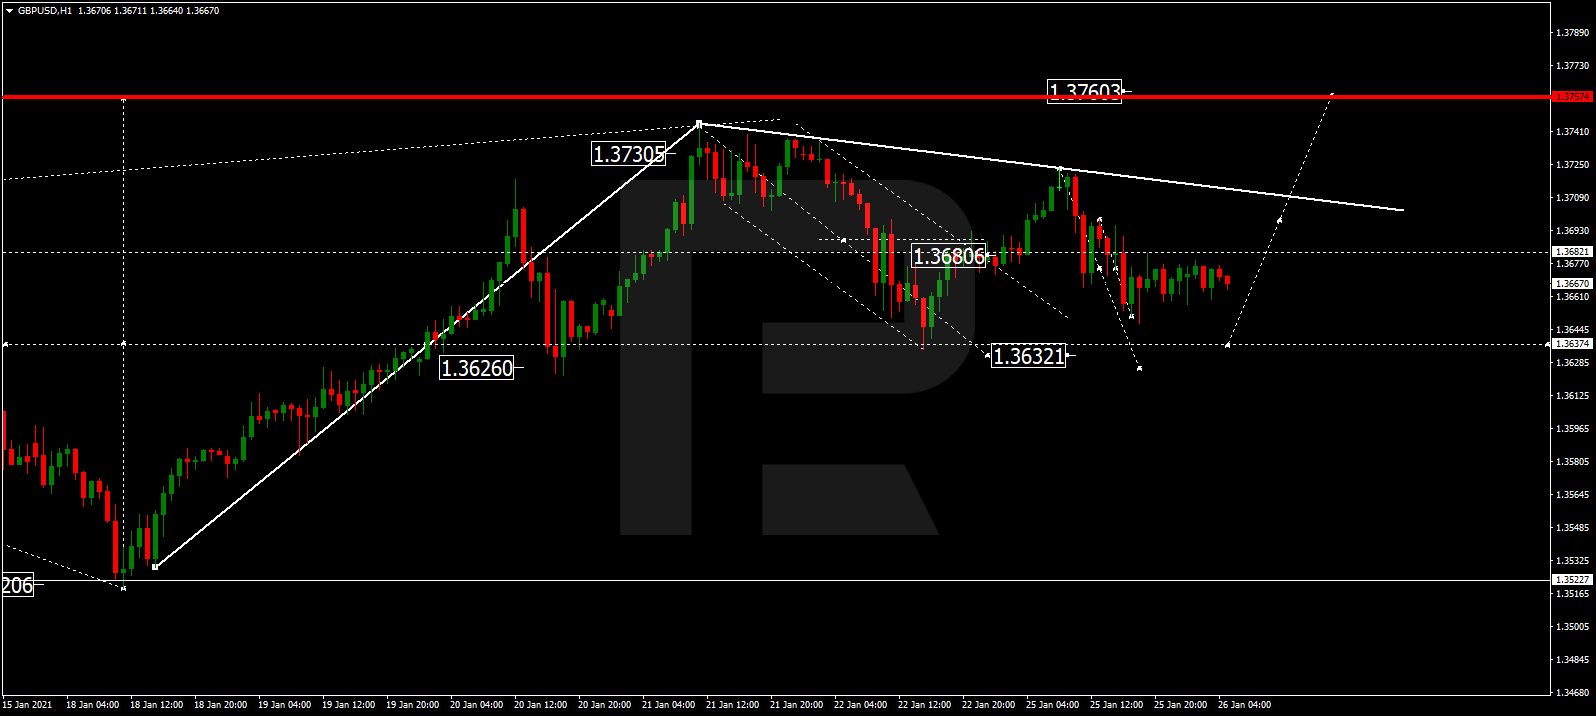
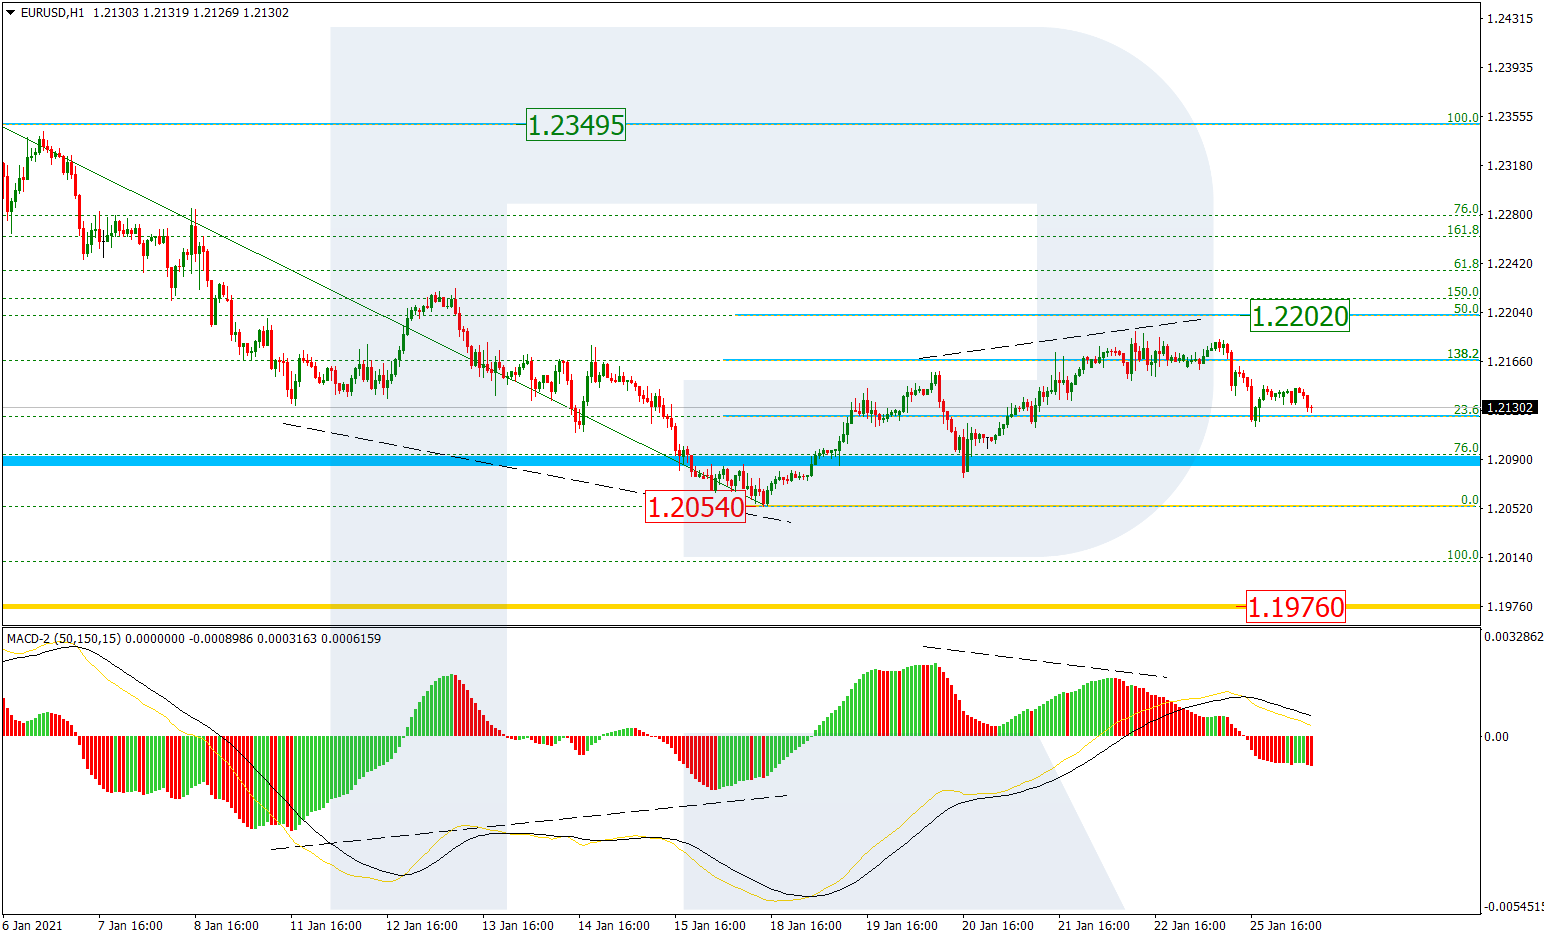
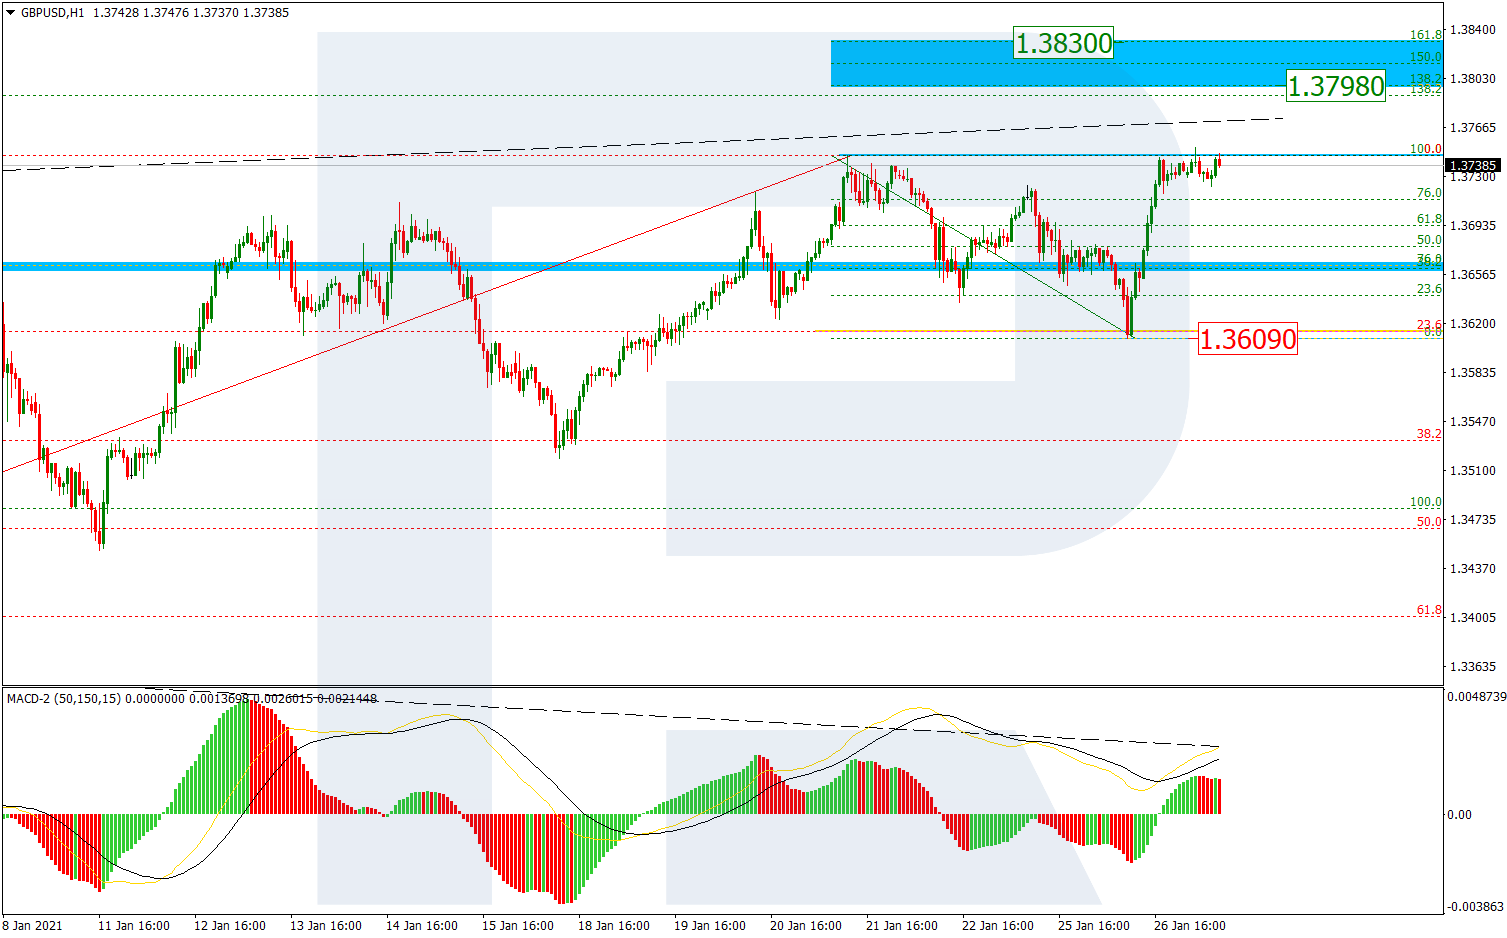
In the H1 chart, after correcting by 23.6%, pair is trying to update its high again. If the price does break and fixes above it, the asset may continue growing towards the post-correctional extension area between 138.2% and 161.8% fibo at 1.3798 and 1.3830 respectively. The support is the local low at 1.3609.

GBPUSD_H1
Risk Warning: the result of previous trading operations do not guarantee the same results in the future

EURJPY, “Euro vs. Japanese Yen”

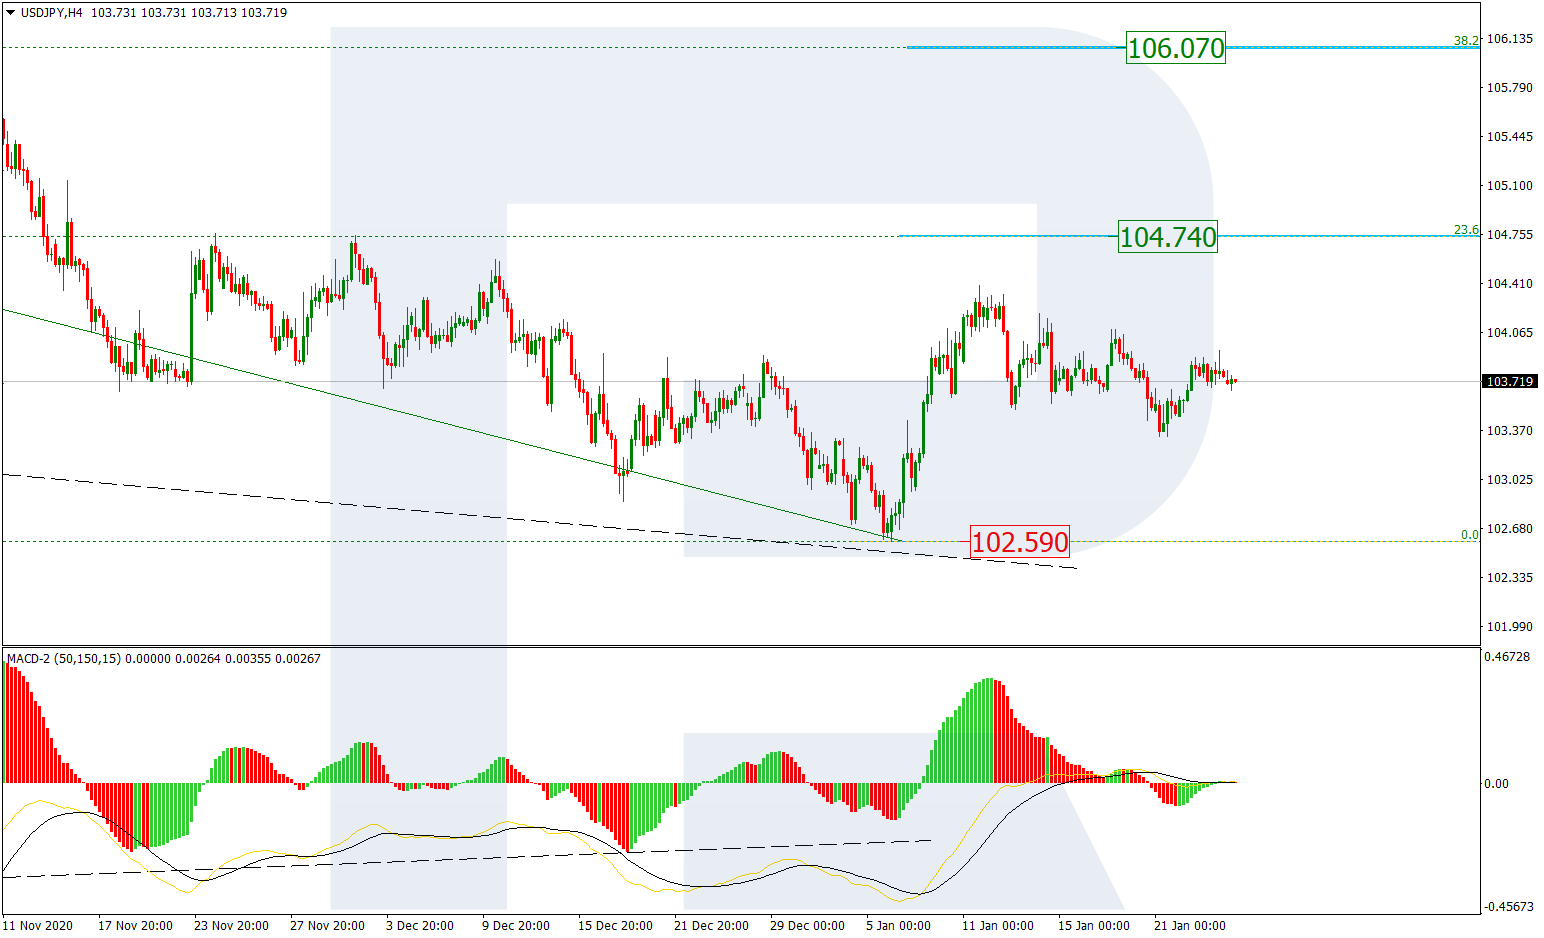
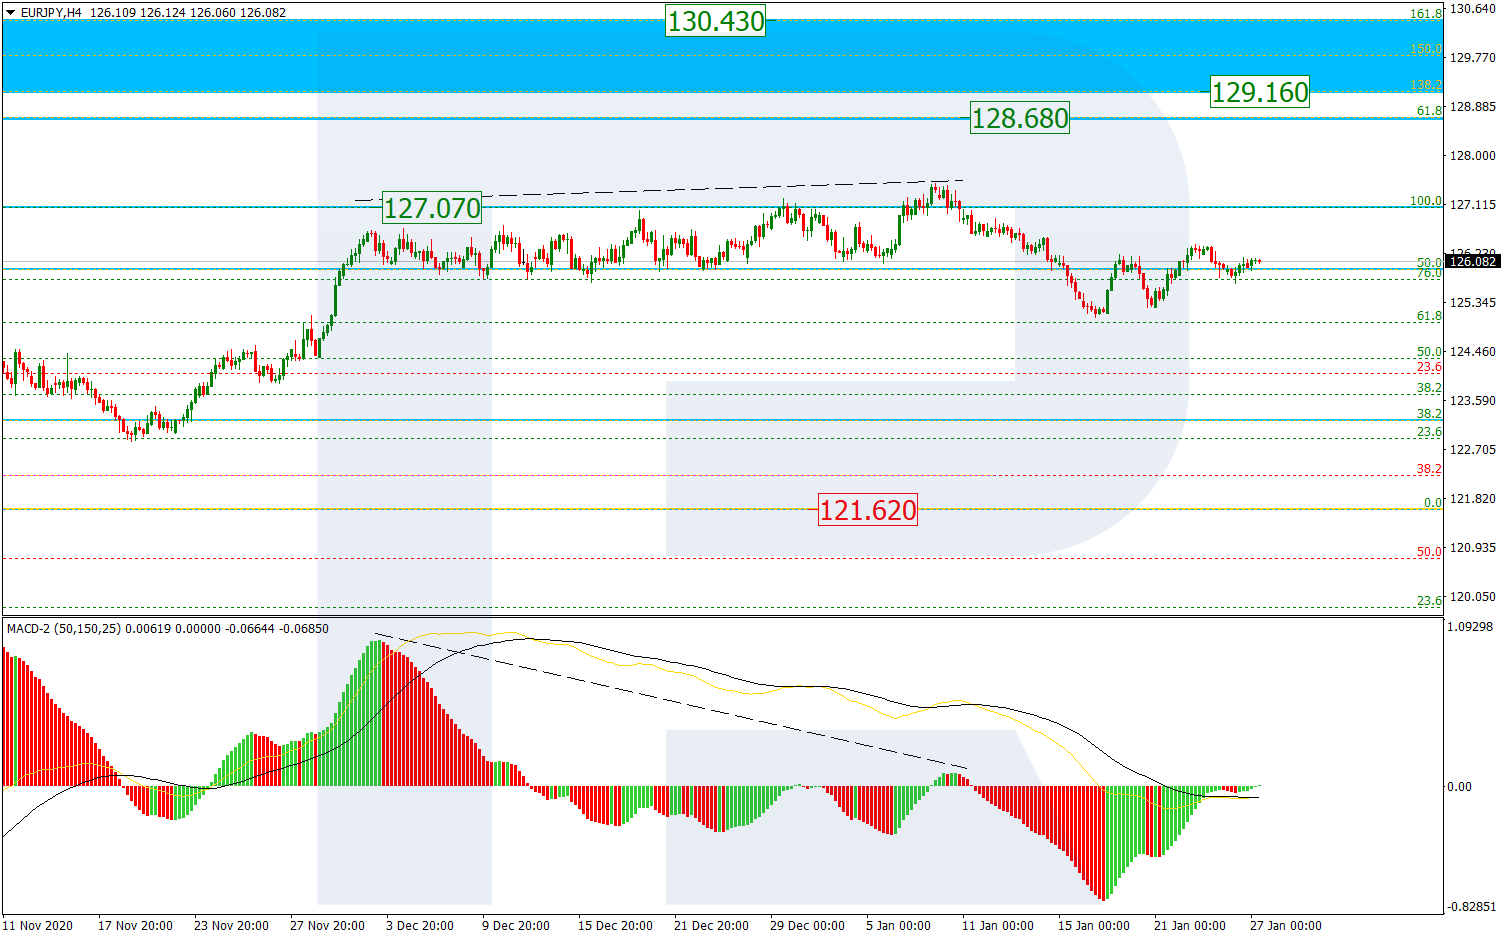
In the H4 chart, EURJPY has completed its correctional decline after another divergence on MACD; right now, it is moving upwards. The structure of the current movement may be considered as a correction after the previous descending wave and this implies a new decline within the correction. After completing the correction, the pair may resume growing to break the mid-term 61.8% fibo at 128.65 and then continue moving to reach the post-correctional extension area between 138.2% and 161.8% fibo at 129.16 and 130.43 respectively.

EURJPY_H4
Risk Warning: the result of previous trading operations do not guarantee the same results in the future

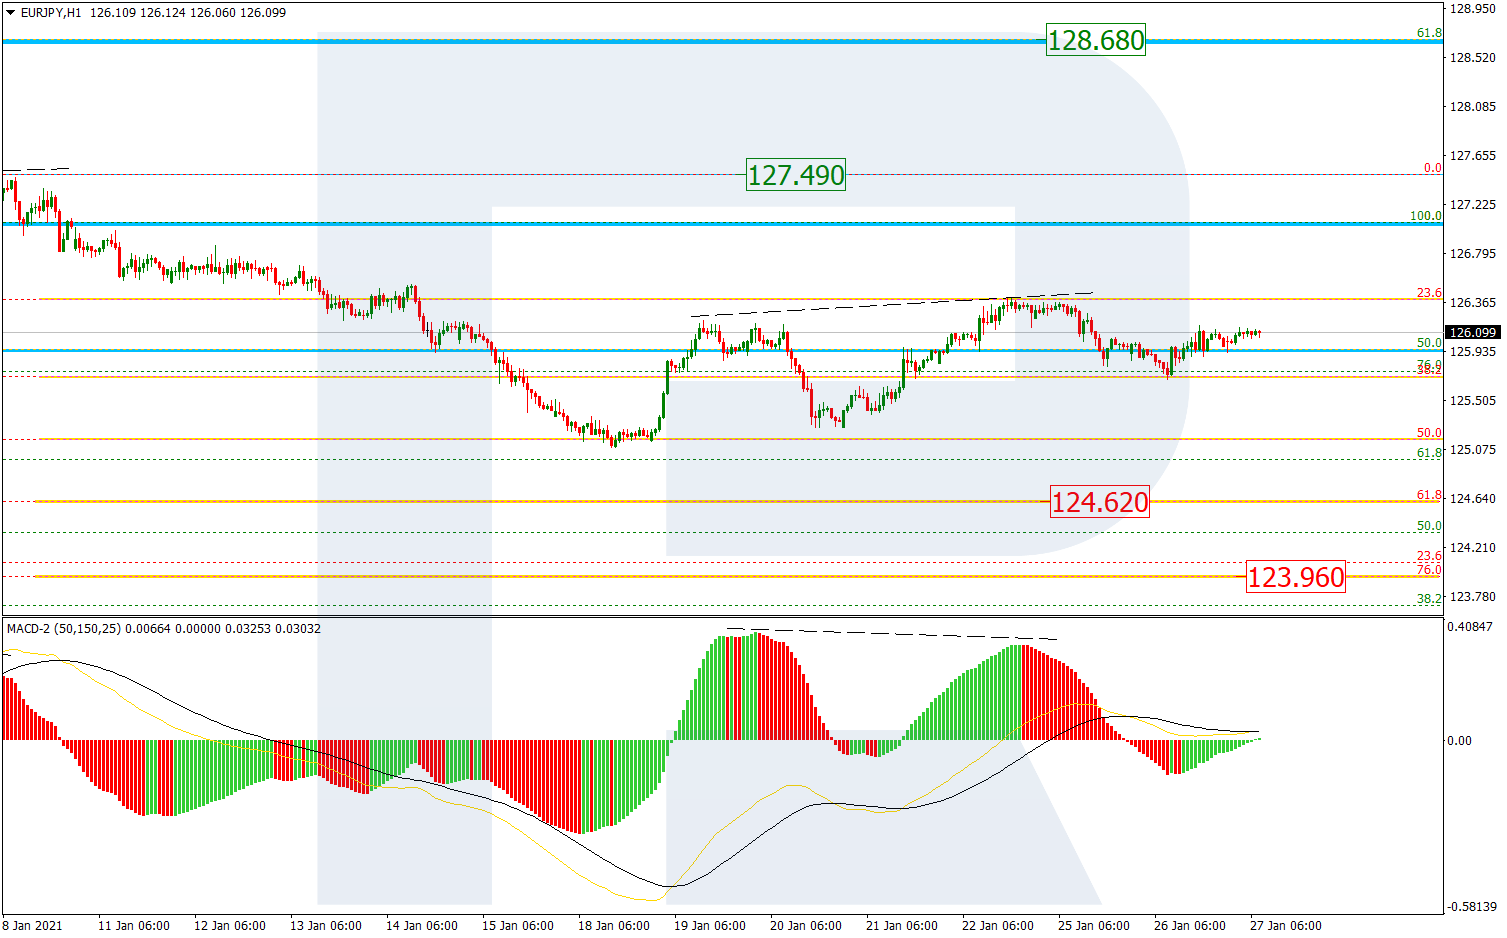
As we can see In the H1 chart, the pair is moving upwards to return to the local resistance at 23.6% fibo. At the same time, there is a divergence on MACD, which may hint at a new decline. The first descending wave has reached 50.0% fibo, while the next one may be heading towards 61.8% and 76.0% fibo at 124.62 and 123.96 respectively. The resistance is the high at 127.49.

EURJPY_H1

rfxsignals January 27, 2021 No Comments

Daily Free Forex Signals For 27/01/2021

Here your going to see Daily Free Forex Signals For 27/01/2021 to free forex signal alert from our kitkat trading system and other trading logic’s .we provide like this free forex signals from 2012 on wards with more than 50,000 traders around the world .The free forex signals have 70 to 85% quality always .we give for you a note as maximum focus take profit 1 as your target and must use stop loss values .if you have any other query’s please visit our live chat or email option


GBGPUSD SELL-1.372651
SL-1.37777
TP1-1.370965
TP2-1.369109


EURUSD SELL-1.215517
SL-1.219574
TP1-1.214018
TP2-1.21252


CADJPY SELL-81.53515
SL-81.941423
TP1-81.373888
TP2-81.208357


CADCHF SELL-0.697003
SL-0.700512
TP1-0.695436
TP2-0.693869


USDCAD BUY-1.272079
SL-1.266844
TP1-1.273631
TP2-1.275276


GBPCAD BUY-1.746201
SL-1.741309
TP1-1.747605
TP2-1.749144


USDJPY BUY-103.746052
SL-103.307375
TP1-103.900361
TP2-104.063487


NZDUSD SELL-0.723056
SL-0.727652
TP1-0.721442
TP2-0.719975


AUDCHFSELL-0.685803
SL-0.689564
TP1-0.684199
TP2-0.68254


USDCHF SELL-0.887201
SL-0.891367
TP1-0.88561
TP2-0.884057


EURGBP SELL-0.884956
SL-0.889441
TP1-0.883375
TP2-0.881697


AUDUSD SELL-0.773265
SL-0.777951
TP1-0.771673
TP2-0.770126


AUDJPY SELL-80.191383
SL-80.532144
TP1-80.036293
TP2-79.874649


GBPNZD BUY-1.899305
SL-1.895885
TP1-1.900821
TP2-1.902423


EURNZD BUY-1.681326
SL-1.677555
TP1-1.682881
TP2-1.684475


NZDCHF SELL-0.640761
SL-0.644322
TP1-0.639246
TP2-0.637681


rfxsignals January 27, 2021 No Comments

The Pound is not giving up on its plans to grow. Overview for 27.01.2021

The Pound is not giving up on its plans to grow. Overview for 27.01.2021

27.01.2021

GBPUSD is still rising and ready to update its local highs.

The British Pound is looking pretty confident and challenging against the USD on Wednesday. The current quote for the instrument is 1.3742.

The statistics published by the United Kingdom yesterday showed that the Unemployment Rate in the country rose from 4.9% in October to 5.0% in November, while the expected reading was worse, 5.1%. However, the negative unemployment report was partially compensated by the Average Earnings Index, which added 3.6% 3m/y in November after expanding by 2.8% 3m/y in the previous month and against the expected reading of +2.9% 3m/y. A slight decrease in the first indicator resulted in a slight growth in the second one, thus making conditions in the segment more competitive.

By the way, the November reading on unemployment was the highest since 2016.

The Claimant Count Change showed 7K in December after being 38.1K the month before and against the expected reading of 47.5K.

At the moment, there is a government program in the United Kingdom that is focused on keeping the number of jobs in the country. The program is one of the measures intended to fight the coronavirus pandemic consequences. It’s quite expensive and will last until May of 2021 or maybe longer, depends on the government and internal conditions.

Earlier, the Bank of England said that the real state of affairs in the employment sector might be much worse than the numbers showed.

The Pound is not paying attention to such statements so far because the statistics are positive in many ways. No one knows how the British economy will feel after exiting the alliance, that’s why all positive information is taken into account, just in case. Another thing that supports the Pound is the fact that the “greenback” is getting weaker.

rfxsignals January 27, 2021 No Comments

The Aussie is looking up. Overview for 27.01.2021

The Aussie is looking up. Overview for 27.01.2021

27.01.2021

AUDUSD is not very active but still moving within the mid-term rising channel.

The Australian Dollar is quite calm against the USD but the major trend remains bullish. The current quote for the instrument is 0.7736.

The statistics published today showed that the Consumer Price Index in Australia was 0.9% q/q in the fourth quarter of 2020, which is less than the third-quarter reading, 1.6% q/q. On YoY, the indicator showed 0.9% against the expected reading of 0.7%.

The key trigger for the inflation growth was the tax increase on tobacco, as well as the expenditures on stimulating the country’s economy. In addition to that, there was a surge in expenses on children’s products and relating services in the fourth quarter of 2020, which probably happened after the government canceled its program that implied childcare subsidy.

After the program was canceled, the above-mentioned products and services went up by almost 38%, so it’s not surprising that taken together with the increased tax on tobacco they forced an inflation surge.

The Aussie is somewhat supported by the weakness of the USD, which partially compensates for th

rfxsignals January 26, 2021 No Comments

Forex Technical Analysis & Forecast 26.01.2021

Forex Technical Analysis & Forecast 26.01.2021

26.01.2021

EURUSD, “Euro vs US Dollar”

After failing to fix above the upside border of the consolidation range at 1.2170 and then breaking the downside one at 1.2150, EURUSD has reached 1.2117; right now, it is still consolidating around 1.2150. Possibly, the pair may expand the range down to 1.2108 and then form one more ascending structure to return to 1.2170.

EURUSD
Risk Warning: the result of previous trading operations do not guarantee the same results in the future

GBPUSD, “Great Britain Pound vs US Dollar”

GBPUSD is still consolidating around 1.3680; right now, it is correcting to expand this range down to 1.3636. After that, the instrument may start another growth with the target at 1.3760.

GBPUSD
Risk Warning: the result of previous trading operations do not guarantee the same results in the future

USDRUB, “US Dollar vs Russian Ruble”

USDRUB is still correcting towards 75.90. Later, the market may fall to break 74.58 and then continue trading downwards with the target at 73.30.

USDRUB
Risk Warning: the result of previous trading operations do not guarantee the same results in the future

USDJPY, “US Dollar vs Japanese Yen”

USDJPY is still consolidating above 103.66. Possibly, today the pair may expand the range up to 103.98 and then start a new decline with the target at 103.22.

USDJPY
Risk Warning: the result of previous trading operations do not guarantee the same results in the future

USDCHF, “US Dollar vs Swiss Franc”

USDCHF is still correcting towards 0.8894. After that, the instrument may form a new descending structure to reach 0.8833 and then resume trading upwards with the target at 0.8900.

USDCHF
Risk Warning: the result of previous trading operations do not guarantee the same results in the future

AUDUSD, “Australian Dollar vs US Dollar”

AUDUSD is still falling towards 0.7670. Later, the market may start another growth to break 0.7736 and then continue trading within the uptrend with the target at 0.7790.

AUDUSD
Risk Warning: the result of previous trading operations do not guarantee the same results in the future

BRENT

Brent is still consolidating above 55.35. Today, the asset may break the range to the downside and complete the correctional wave at 54.10. After that, the instrument may form one more ascending structure to break 55.50 and then continue trading upwards with the target at 56.60.

BRENT
Risk Warning: the result of previous trading operations do not guarantee the same results in the future

XAUUSD, “Gold vs US Dollar”

Gold is still consolidating around 1854.30. Possibly, the metal may expand the range down to 1833.50 and then grow towards 1854.40. Later, the market may form a new descending structure to break 1830.00 and then continue falling with the target at 1800.00.

GOLD
Risk Warning: the result of previous trading operations do not guarantee the same results in the future

BTCUSD, “Bitcoin vs US Dollar”

After rebounding from 34600.00, BTCUSD is falling towards 31000.00. After that, the instrument may form one more ascending structure to reach 36000.00 and then resume trading downwards with the target at 30000.00.

BITCOIN
Risk Warning: the result of previous trading operations do not guarantee the same results in the future

S&P 500

After completing the descending wave at 3800.0 along with the correction towards 3859.0, the S&P index is consolidating around 3836.2. If later the price breaks this range to the upside, the market may start another growth to expand the range up to 3875.5; if to the downside – resume trading downwards with the target at 3790.0.

S&P 500
Risk Warning: the result of previous trading operations do not guarantee the same results in the future

rfxsignals January 26, 2021 No Comments

Murrey Math Lines 26.01.2021 (AUDUSD, NZDUSD)

Murrey Math Lines 26.01.2021 (AUDUSD, NZDUSD)

26.01.2021

AUDUSD, “Australian Dollar vs US Dollar”

In the H4 chart, AUDUSD is moving between 7/8 and 6/8. In this case, the price is expected to break 6/8 and then continue the correction within the uptrend to reach the support at 5/8. However, this scenario may be canceled if the price breaks the resistance at 7/8 to the upside. After that, the instrument may reverse and grow towards 8/8.

AUDUSD_H4
Risk Warning: the result of previous trading operations do not guarantee the same results in the future

As we can see in the M15 chart, the pair has broken the downside line of the VoltyChannel indicator and, as a result, may continue trading downwards.

AUDUSD_M15
Risk Warning: the result of previous trading operations do not guarantee the same results in the future

NZDUSD, “New Zealand Dollar vs US Dollar”

As we can see in the H4 chart, after failing to fix above 6/8, NZDUSD is moving downwards. In this case, the price is expected to continue falling to return to 5/8. However, this scenario may no longer be valid if the price tries to break 6/8 to the upside again. If it succeeds, the instrument may reverse and continue growing to reach the resistance at 8/8.

NZDUSD_H4
Risk Warning: the result of previous trading operations do not guarantee the same results in the future

In the M15 chart, the price may break the downside line of the VoltyChannel indicator and, as a result, continue falling.

NZDUSD_M15
Risk Warning: the result of previous trading operations do not guarantee the same results in the future

rfxsignals January 26, 2021 No Comments

Japanese Candlesticks Analysis 26.01.2021 (EURUSD, USDJPY, EURGBP)

Japanese Candlesticks Analysis 26.01.2021 (EURUSD, USDJPY, EURGBP)

26.01.2021

EURUSD, “Euro vs. US Dollar”

As we can see in the H4 chart, the correction within the ascending tendency continues. Right now, after forming several reversal patterns, such as Engulfing, close to the resistance level, EURUSD may reverse in the form of another pullback. In this case, the correctional target may be at 1.2020. After that, the pair may rebound from the support level and resume trading upwards. However, an alternative scenario implies that the price may start a new growth to reach 1.2180 without testing 1.2020.

EURUSD
Risk Warning: the result of previous trading operations do not guarantee the same results in the future

USDJPY, “US Dollar vs. Japanese Yen”

As we can see in the H4 chart, after rebounding from the channel’s upside border and forming a Shooting Star pattern, the pair has reversed. The downside target is still the support area at 102.85. After completing another correction, USDJPY may resume trading downwards. At the same time, an opposite scenario implies that the price may continue its growth to return to 104.00 before resuming its decline.

USDJPY
Risk Warning: the result of previous trading operations do not guarantee the same results in the future

EURGBP, “Euro vs. Great Britain Pound”

As we can see in the H4 chart, after forming several reversal patterns, such as Hammer, not far from the support level, EURGBP is reversing and may start another pullback. In this case, the correctional target may be the resistance area at 0.8935. However, judging by previous movements, the pair may yet continue its decline to reach 0.8785 without testing the resistance area.

EURGBP
Risk Warning: the result of previous trading operations do not guarantee the same results in the future

rfxsignals January 26, 2021 No Comments

Ichimoku Cloud Analysis 26.01.2021 (AUDUSD, GBPUSD, USDCAD)

Ichimoku Cloud Analysis 26.01.2021 (AUDUSD, GBPUSD, USDCAD)

26.01.2021

AUDUSD, “Australian Dollar vs US Dollar”

AUDUSD is trading at 0.7678; the instrument is moving below Ichimoku Cloud, thus indicating a descending tendency. The markets could indicate that the price may test the cloud’s downside border at 0.7705 and then resume moving downwards to reach 0.7565. Another signal in favor of a further downtrend will be a rebound from the rising channel’s downside border. However, the bearish scenario may no longer be valid if the price breaks the cloud’s upside border and fixes above 0.7765. In this case, the pair may continue growing towards 0.7855. To confirm further decline, the asset must break the downside border of the Triangle pattern and fix below 0.7645.

AUDUSD
Risk Warning: the result of previous trading operations do not guarantee the same results in the future

GBPUSD, “Great Britain Pound vs US Dollar”

GBPUSD is trading at 1.3640; the instrument is moving below Ichimoku Cloud, thus indicating a descending tendency. The markets could indicate that the price may test the cloud’s downside border at 1.3675 and then resume moving downwards to reach 1.3485. Another signal in favor of a further downtrend will be the formation of a Head & Shoulders reversal pattern. However, the bearish scenario may no longer be valid if the price breaks the cloud’s upside border and fixes above 1.3715. In this case, the pair may continue growing towards 1.3805.

GBPUSD
Risk Warning: the result of previous trading operations do not guarantee the same results in the future

USDCAD, “US Dollar vs Canadian Dollar”

USDCAD is trading at 1.2771; the instrument is moving above Ichimoku Cloud, thus indicating an ascending tendency. The markets could indicate that the price may test the cloud’s upside border at 1.2745 and then resume moving upwards to reach 1.2895. Another signal in favor of a further uptrend will be a rebound from the descending channel’s upside border. However, the bullish scenario may no longer be valid if the price breaks the cloud’s downside border and fixes below 1.2645. In this case, the pair may continue falling towards 1.2565. To confirm further growth, the asset must break the descending channel’s upside border and fix above 1.2815.

USDCAD
Risk Warning: the result of previous trading operations do not guarantee the same results in the future

rfxsignals January 26, 2021 No Comments

EURUSD is saving strengths. Overview for 26.01.2021

EURUSD is saving strengths. Overview for 26.01.2021

26.01.2021

EURUSD is consolidating on Tuesday; investors are waiting for the news.

The major currency pair is barely moving on Tuesday morning in anticipation of the news. The current quote for the instrument is 1.2130.

The “greenback” managed to get much stronger yesterday amid increasing market volatility everywhere. Apart from this, the published statistics indicate problems with business activities in some European countries that are directly connected to lockdowns.

According to the European Central Bank Governor Christine Lagarde, the European economy may take more time to recover than expected earlier but it will recover. She believes that state authorities must continue stimulus programs, both fiscal and monetary. The European economy, as Lagarde sees, will be different after the pandemic and she thinks it will be good.

The ECB Governor is sure that the GDP reading for the fourth quarter of 2020 will be zero but in 2021 it will be positive as the region’s economy recovers.

Today’s economic calendar features the report of the Consumer Confidence from the Conference Board in the USA for January, which is expected to improve up to 88.9 points. The stronger the reading, the better for the USD.

rfxsignals January 26, 2021 No Comments

Fibonacci Retracements Analysis 26.01.2021 (EURUSD, USDJPY)

Fibonacci Retracements Analysis 26.01.2021 (EURUSD, USDJPY)

26.01.2021

EURUSD, “Euro vs US Dollar”

As we can see in the H4 chart, the correctional uptrend is about to finish and may later be followed by a new descending wave. While the first descending wave earlier reached 38.2% fibo, the next one may fall towards 50.0% and 61.8% fibo at 1.1976 and 1.1888 respectively. After the correction is over, the asset may start a new mid-term rising wave to break the high at 1.2350 and then continue growing towards the long-term fractal high at 1.2555.

EURUSD_H4
Risk Warning: the result of previous trading operations do not guarantee the same results in the future

The H1 chart shows that after breaking 38.2% fibo, the correctional uptrend has failed to reach 50.0% fibo at 1.2202. A local divergence on MACD may hint at a further decline towards the low. If EURUSD breaks the low at 1.2054, the asset may continue trading downwards to reach the mid-term 50.0% fibo at 1.1976.

EURUSD_H1
Risk Warning: the result of previous trading operations do not guarantee the same results in the future

USDJPY, “US Dollar vs. Japanese Yen”

As we can see in the H4 chart, the pair is still trying to complete the local correction and resume its growth. The closest target of a new rising impulse may be the mid-term 23.6% fibo at 104.74, a breakout of which will lead to a further growth towards 38.2% fibo at 106.07. On the other hand, if the asset breaks the low at 102.59, the instrument may continue falling to reach the fractal low at 101.18.

USDJPY_H4
Risk Warning: the result of previous trading operations do not guarantee the same results in the future

In the H1 chart, a divergence on MACD made the pair start a new pullback to the downside, which, after breaking 50.0% fibo, has failed to reach 61.8% fibo at 103.28. However, a local divergence on MACD hints at a possible descending impulse that may finally reach the latter level. The resistance is the local high at 104.40.

USDJPY_H1
Risk Warning: the result of previous trading operations do not guarantee the same results in the future