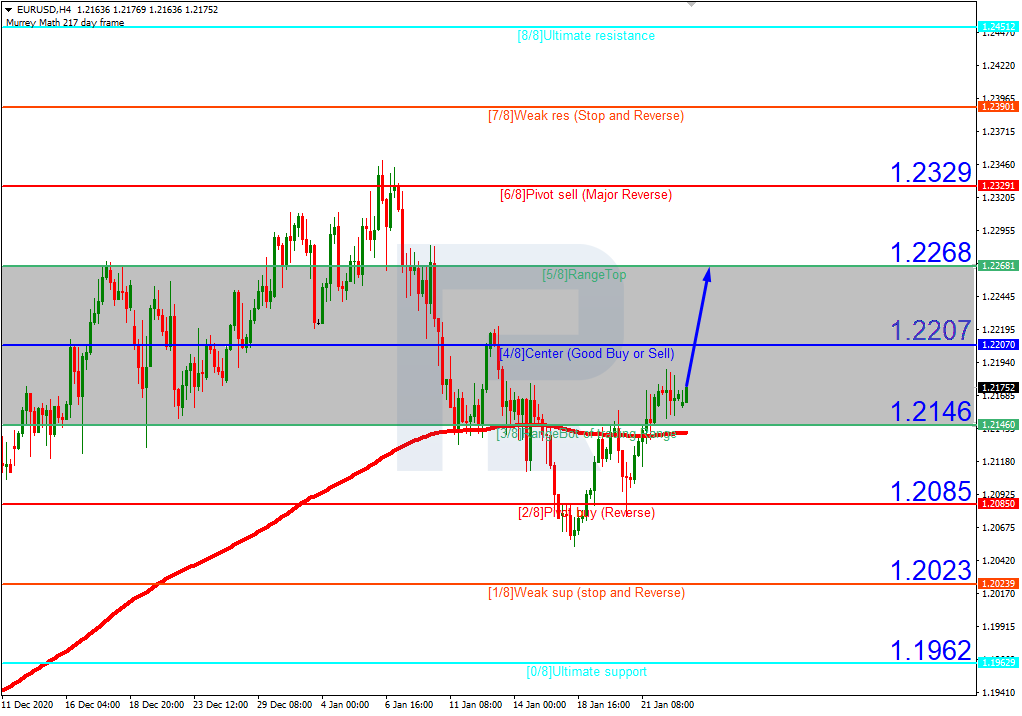
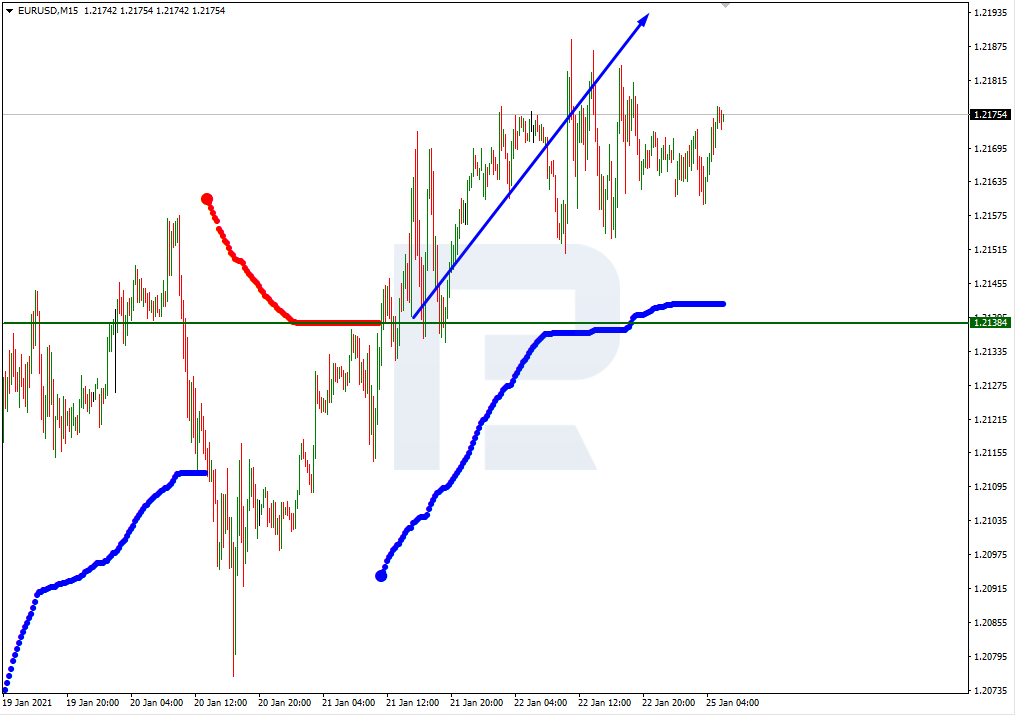
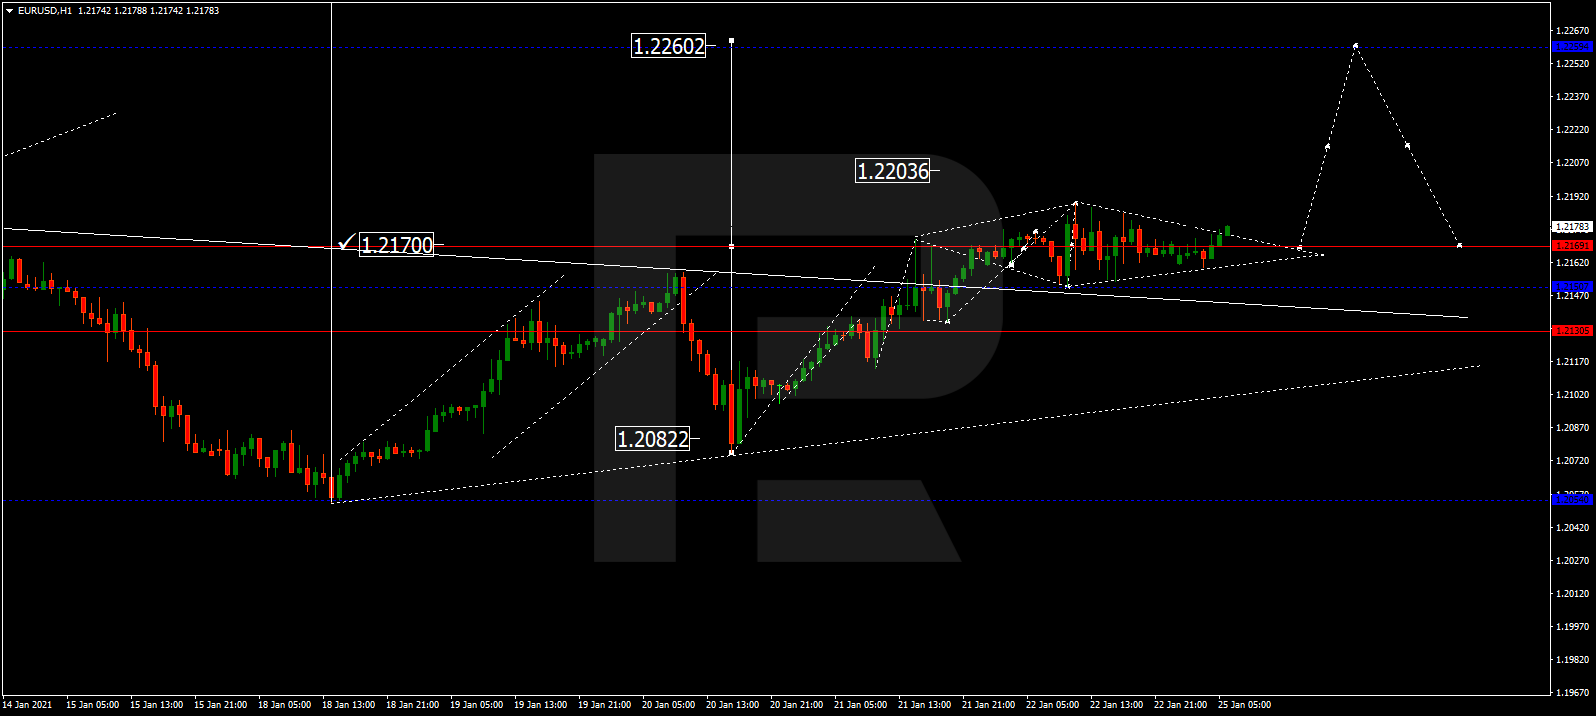
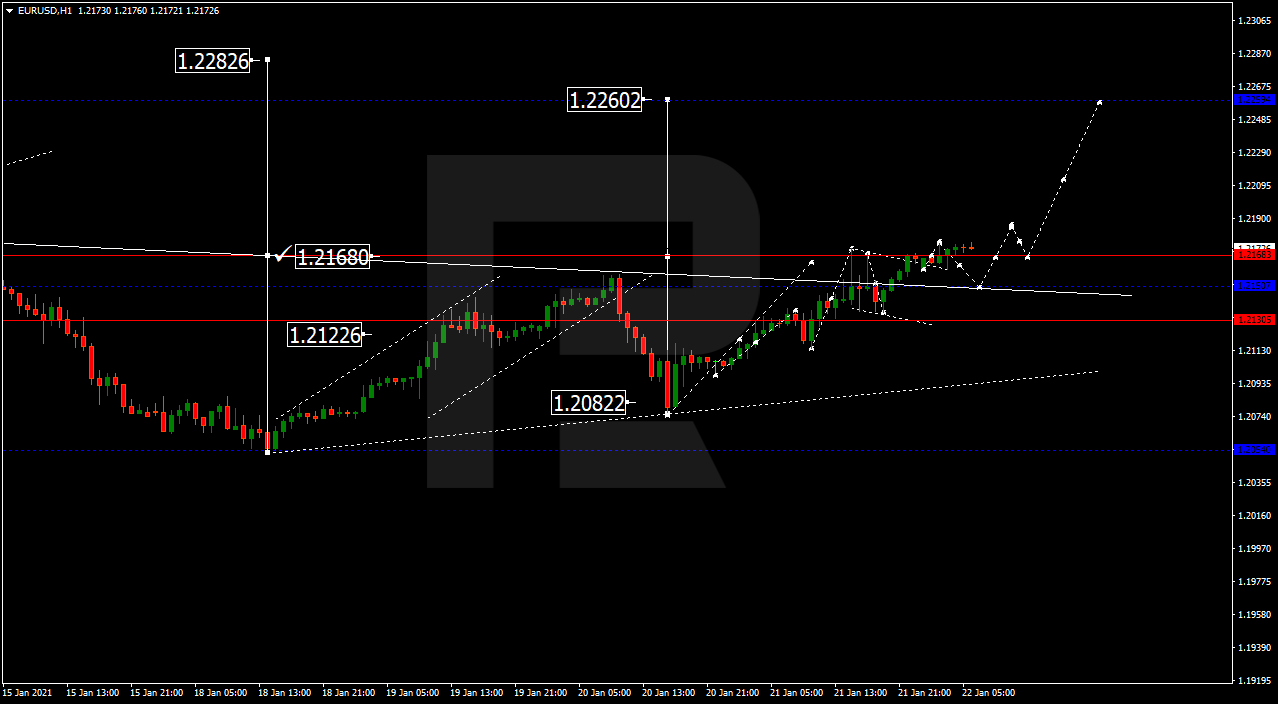
EURUSD, “Euro vs US Dollar”
EURUSD has completed ascending wave at 1.2170 along with the correction towards 1.2135; right now, it is returning to break 1.2170 to the upside. Possibly, today the pair may grow to reach 1.2203 and then fall to get back to 1.2170, thus forming a new consolidation range between these two levels. If later the price breaks this range to the upside, the market may resume trading within the uptrend with the short-term target at 1.2260.

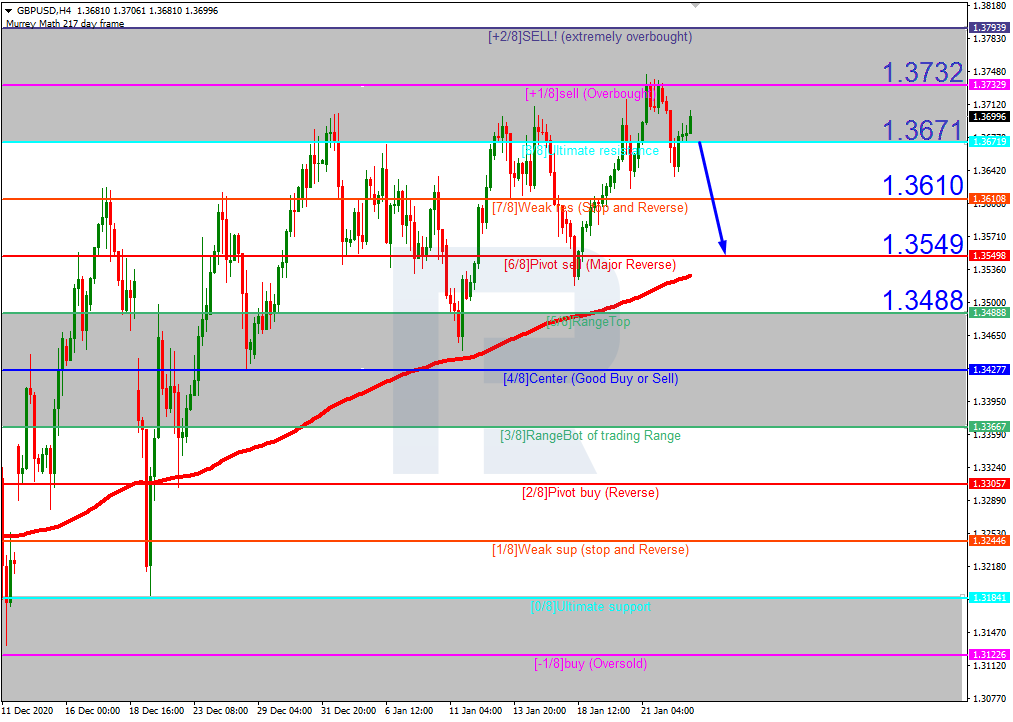
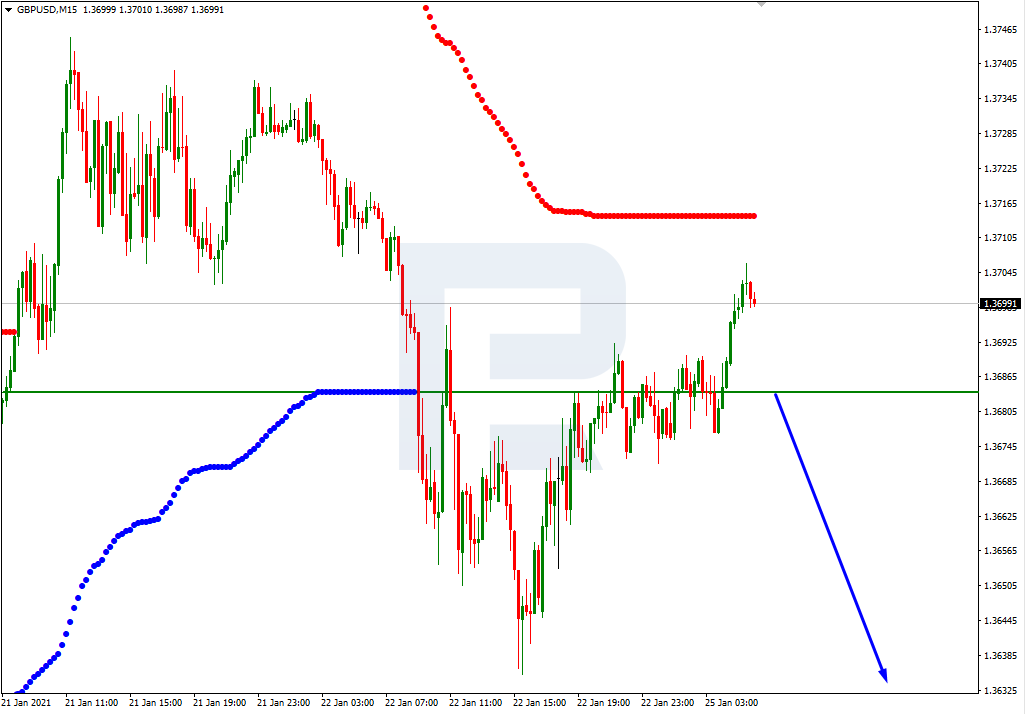
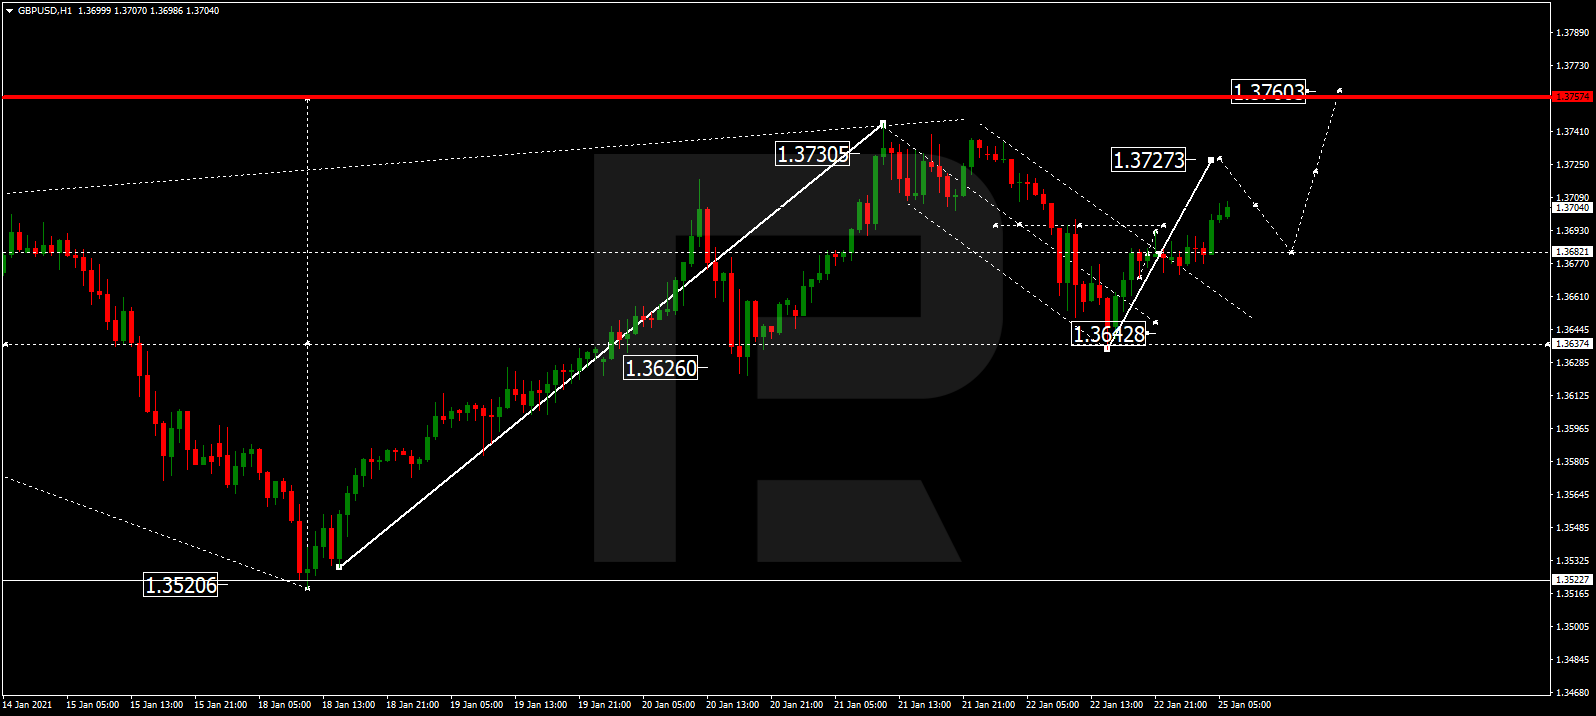
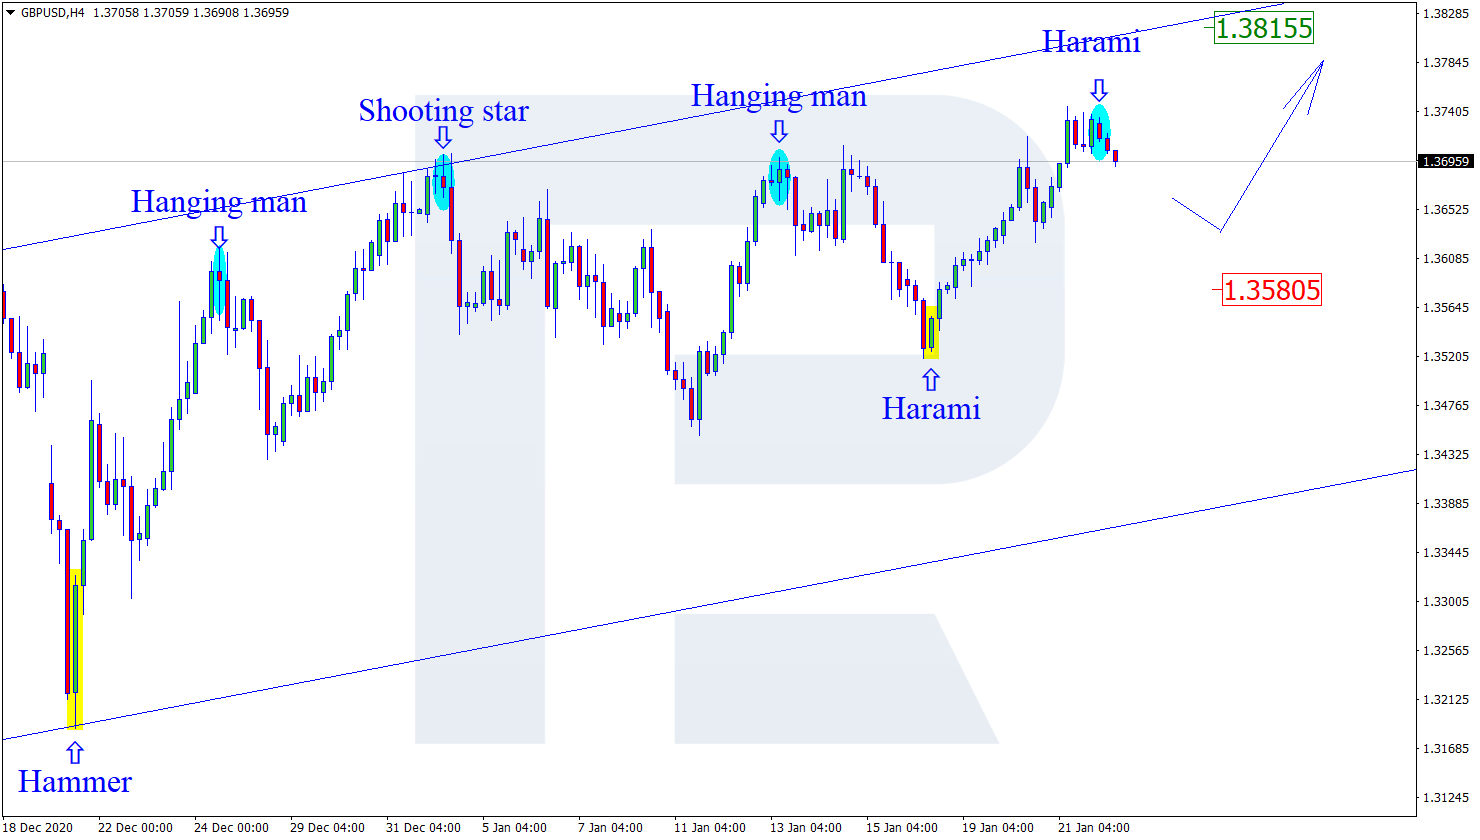
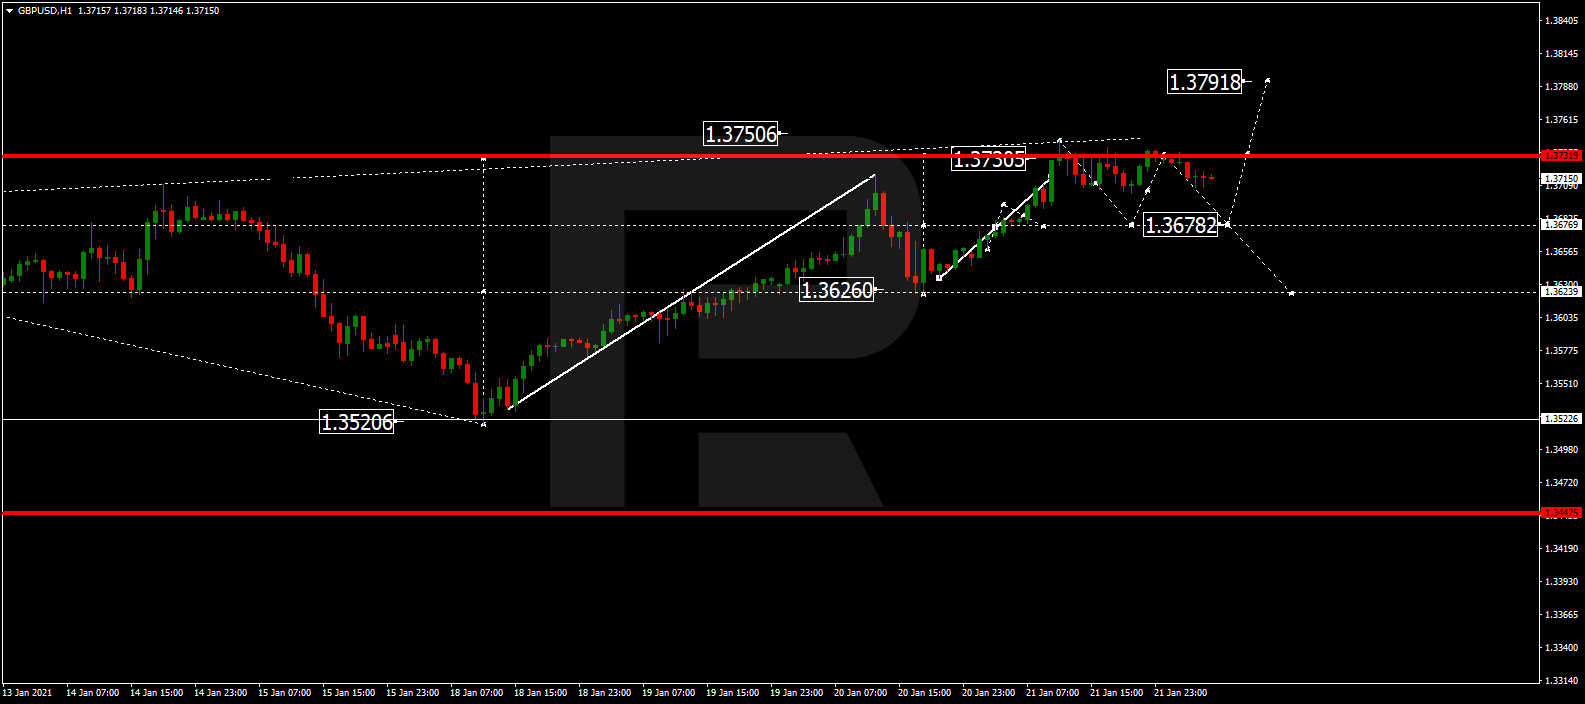
GBPUSD, “Great Britain Pound vs US Dollar”
After finishing the ascending wave at 1.3744, GBPUSD is consolidating below this level. Possibly, the pair may fall to reach 1.3678 and form a new consolidation range there. If later the price breaks this range to the downside, the market may start a new correction with the target at 1.3624; if to the upside – resume trading upwards to reach 1.3791.
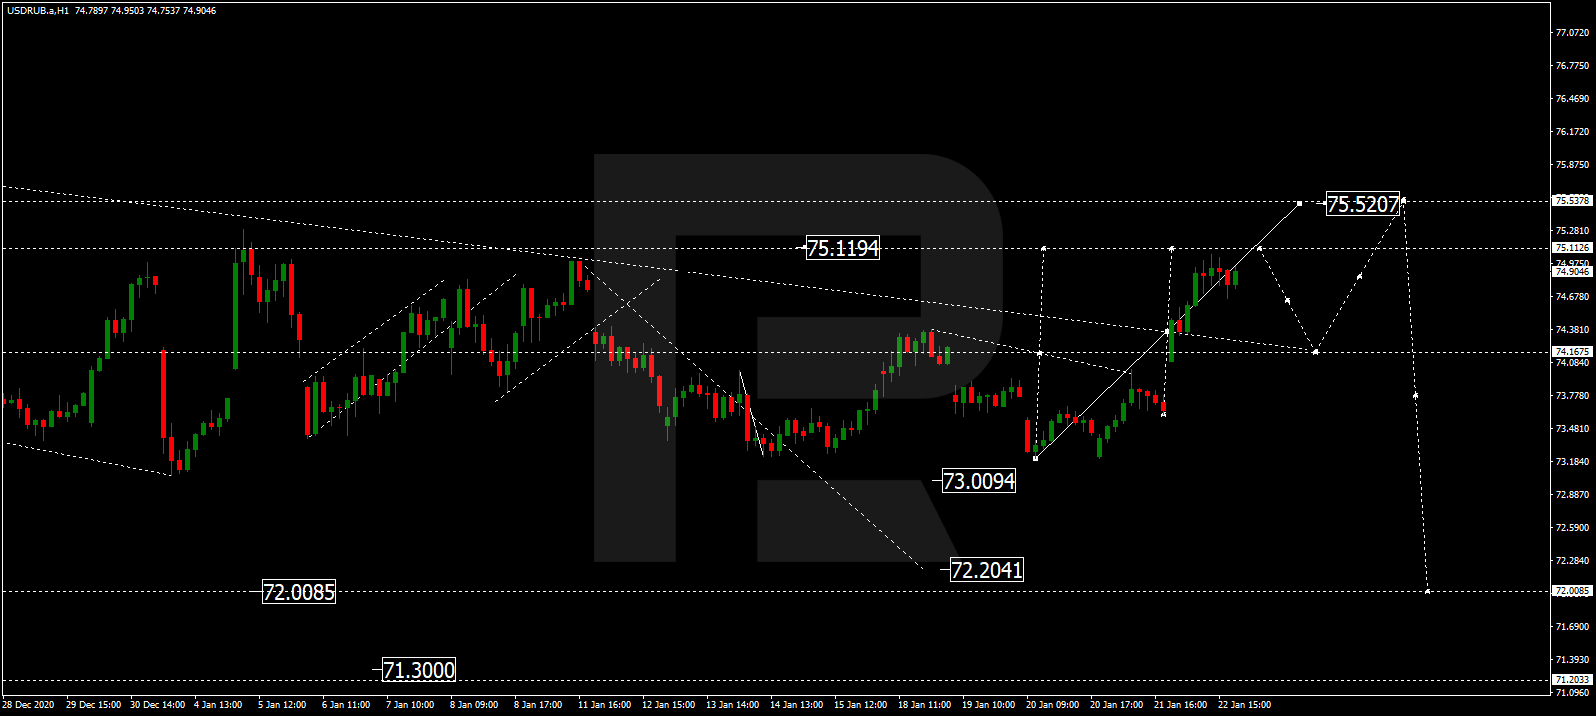
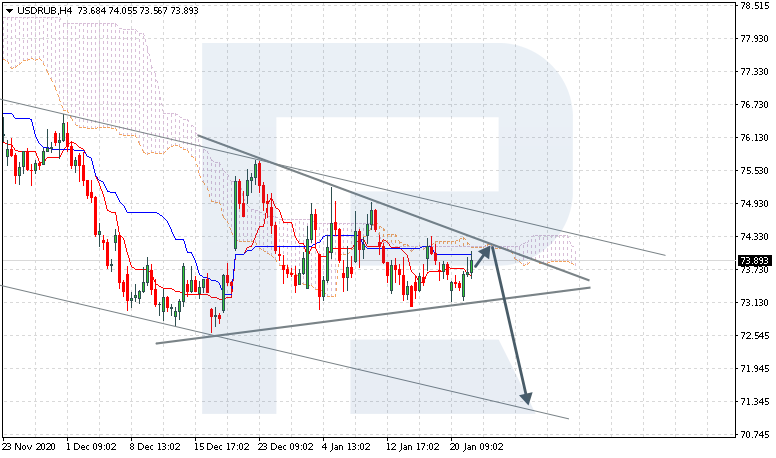
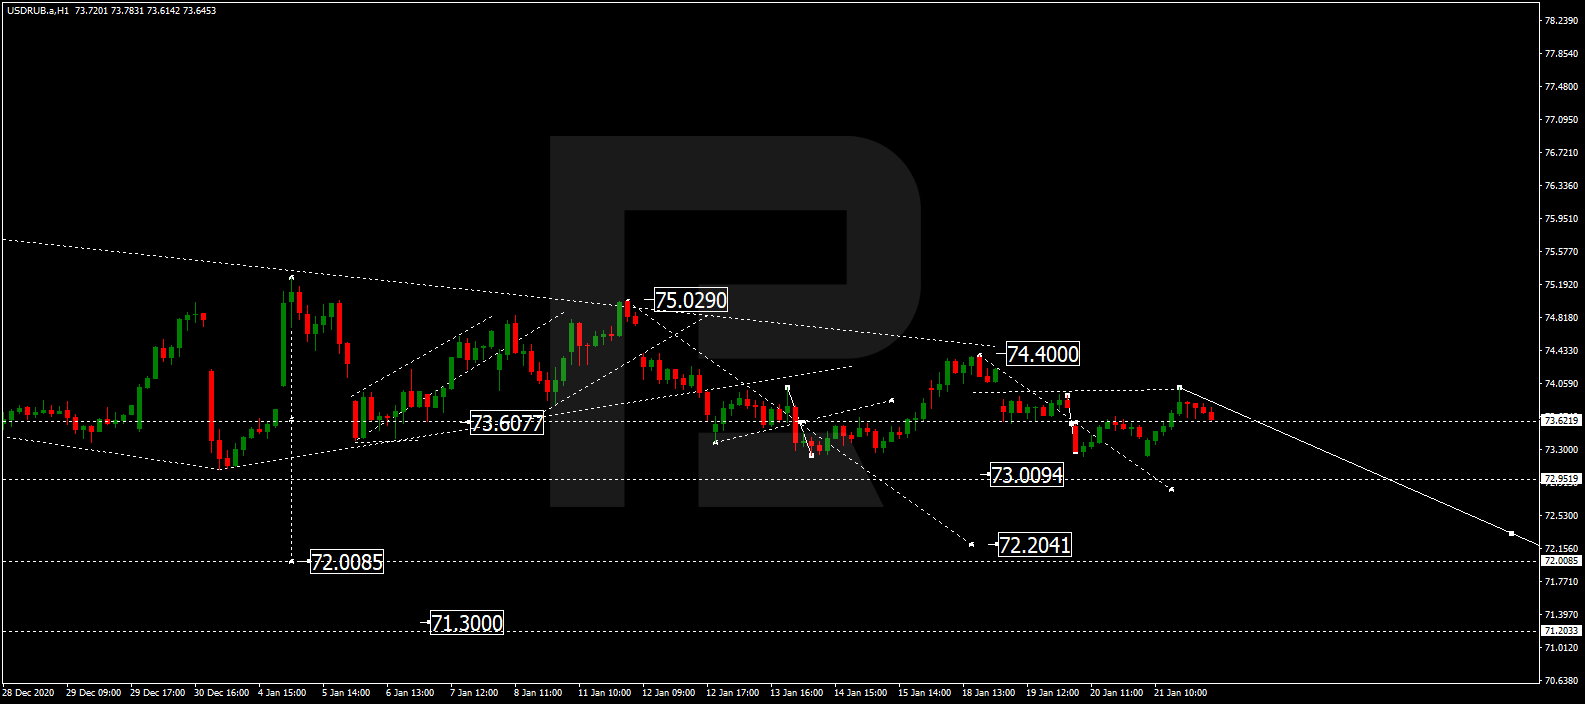
USDRUB, “US Dollar vs Russian Ruble”
USDRUB is still consolidating around 73.30. Today, the pair may fall to break 73.00 and then continue moving within the downtrend with the short-term target at 72.20.
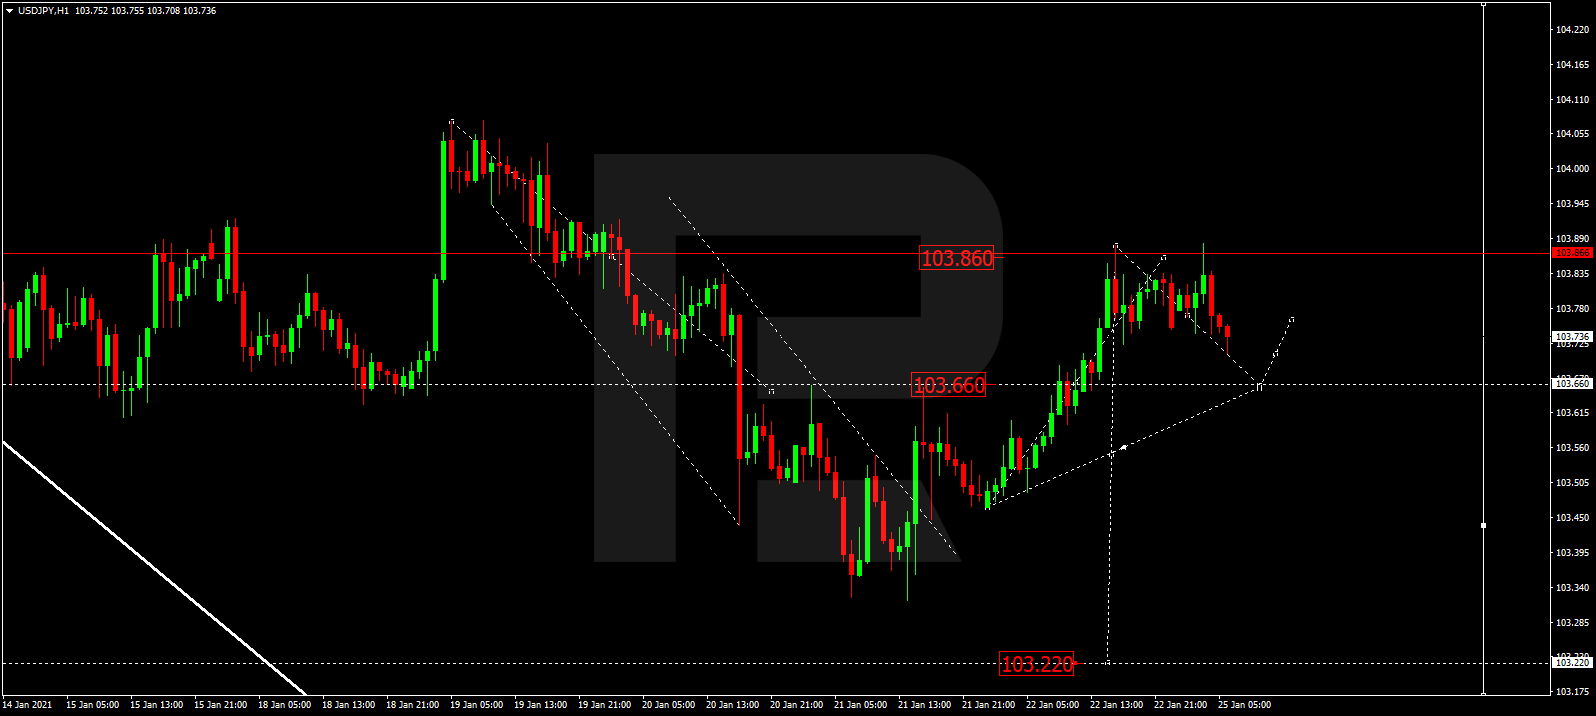
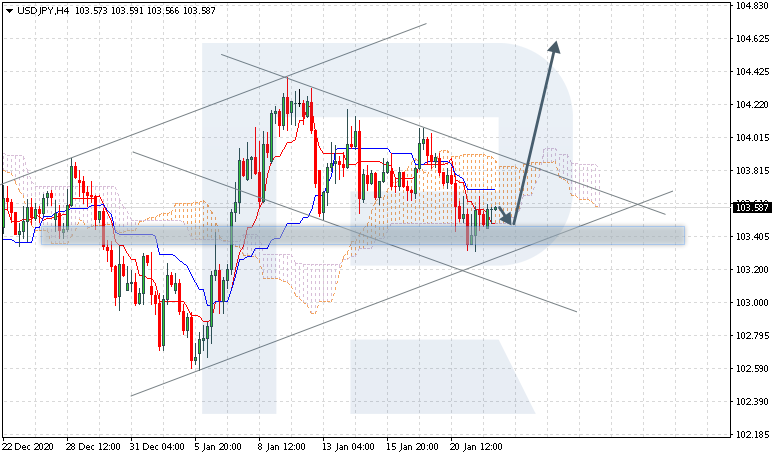
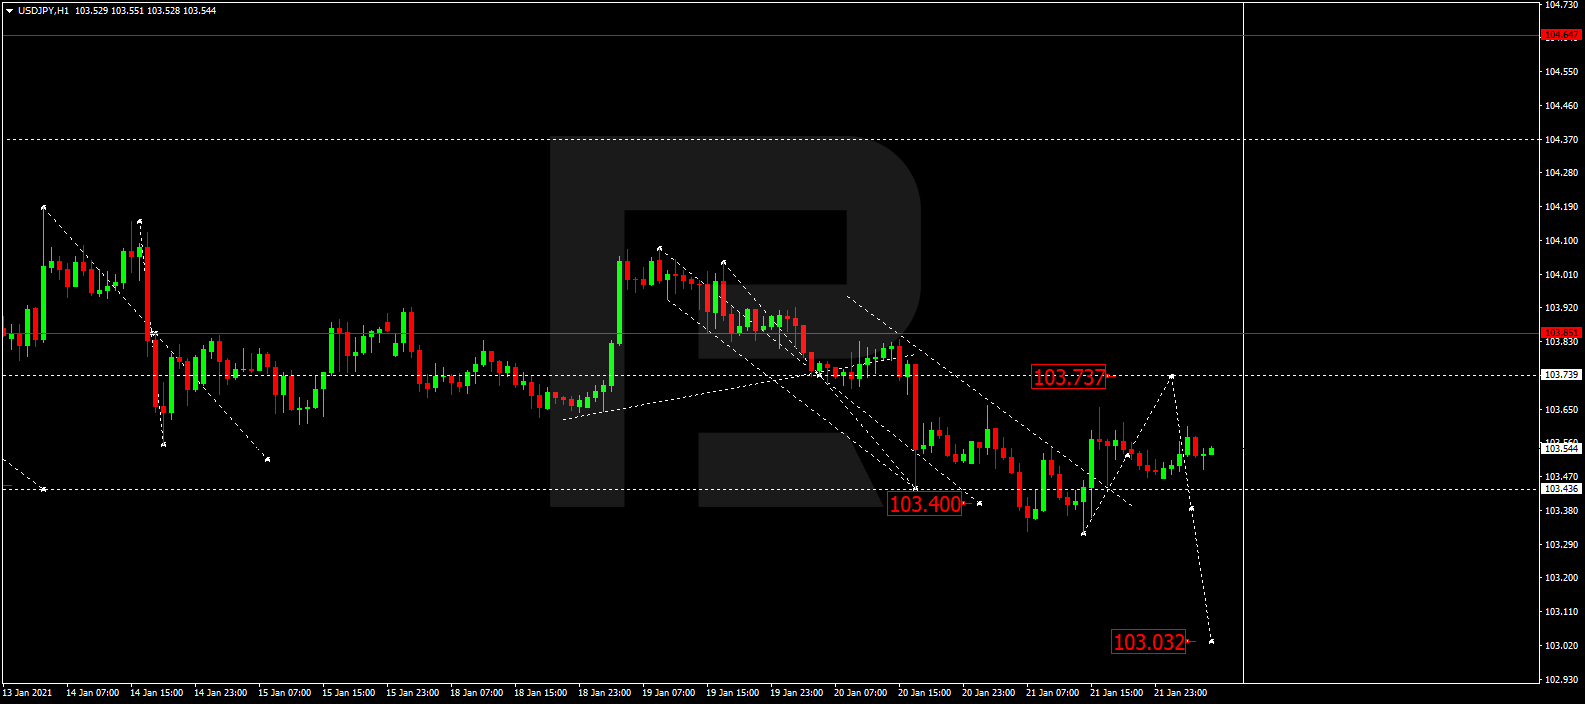
USDJPY, “US Dollar vs Japanese Yen”
After finishing the descending wave at 103.40, USDJPY is consolidating above this level. Possibly, the pair may correct towards 103.73 and then start a new decline with the target at 103.03.
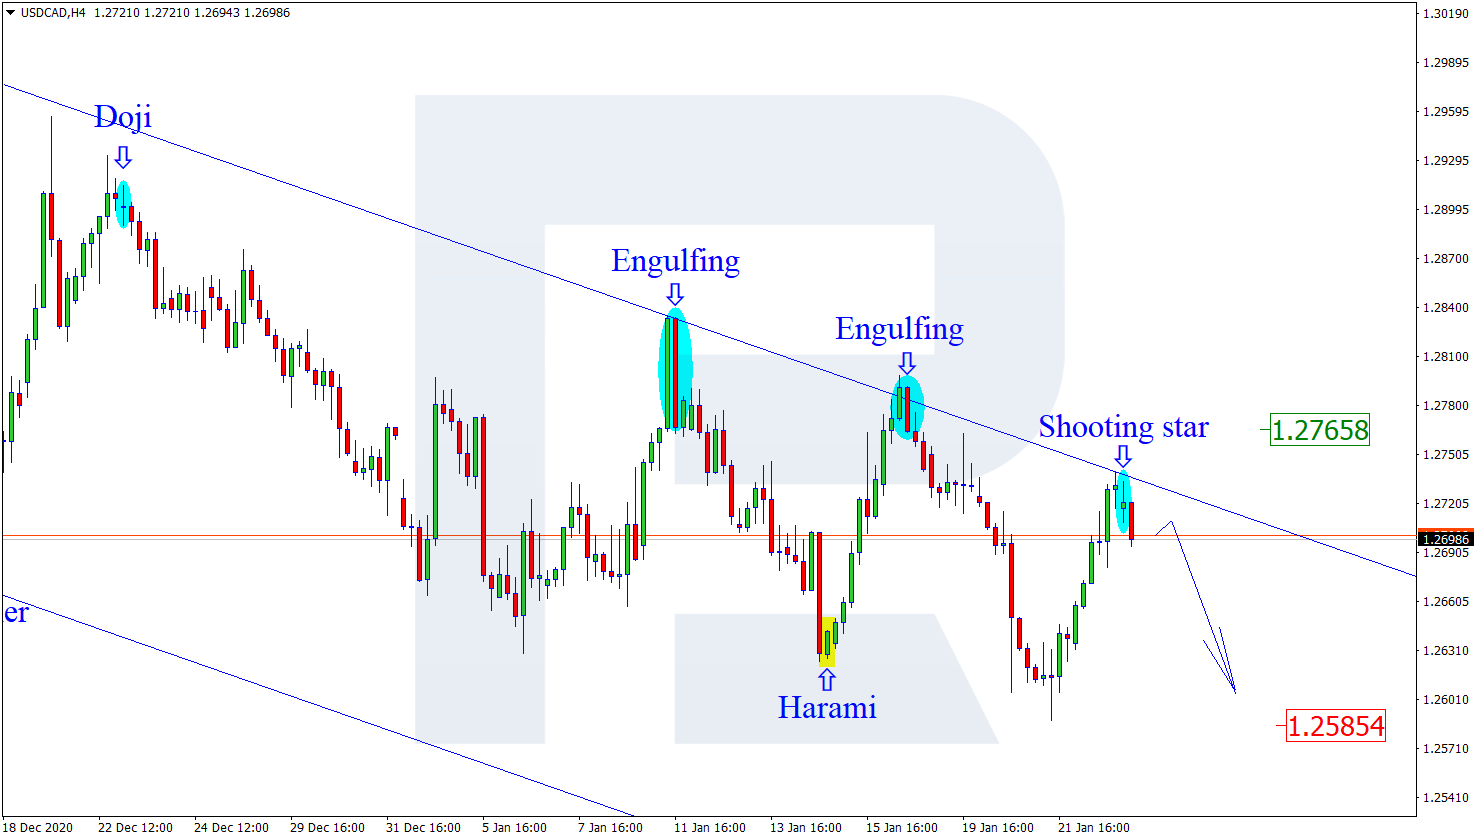
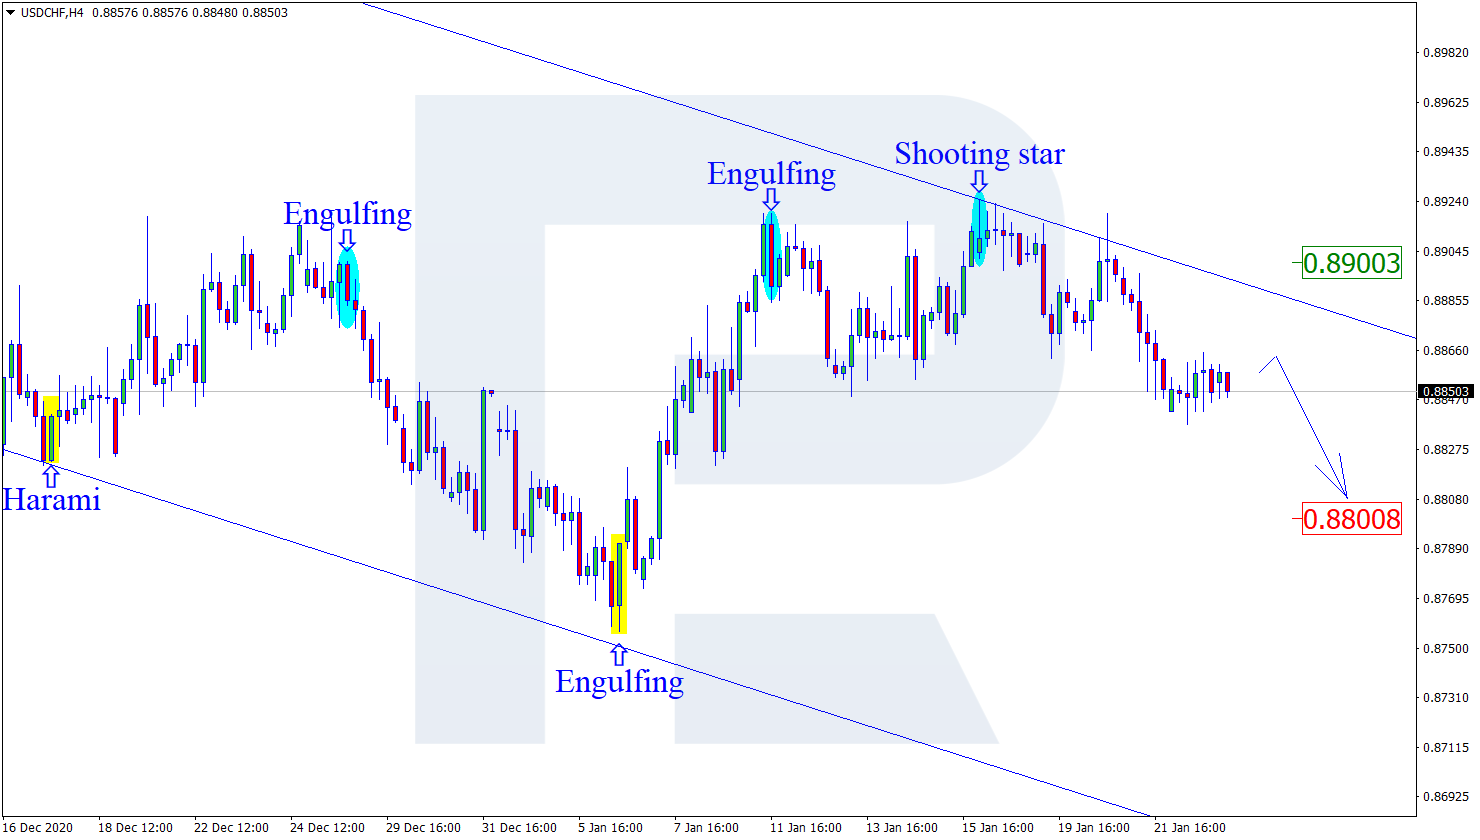
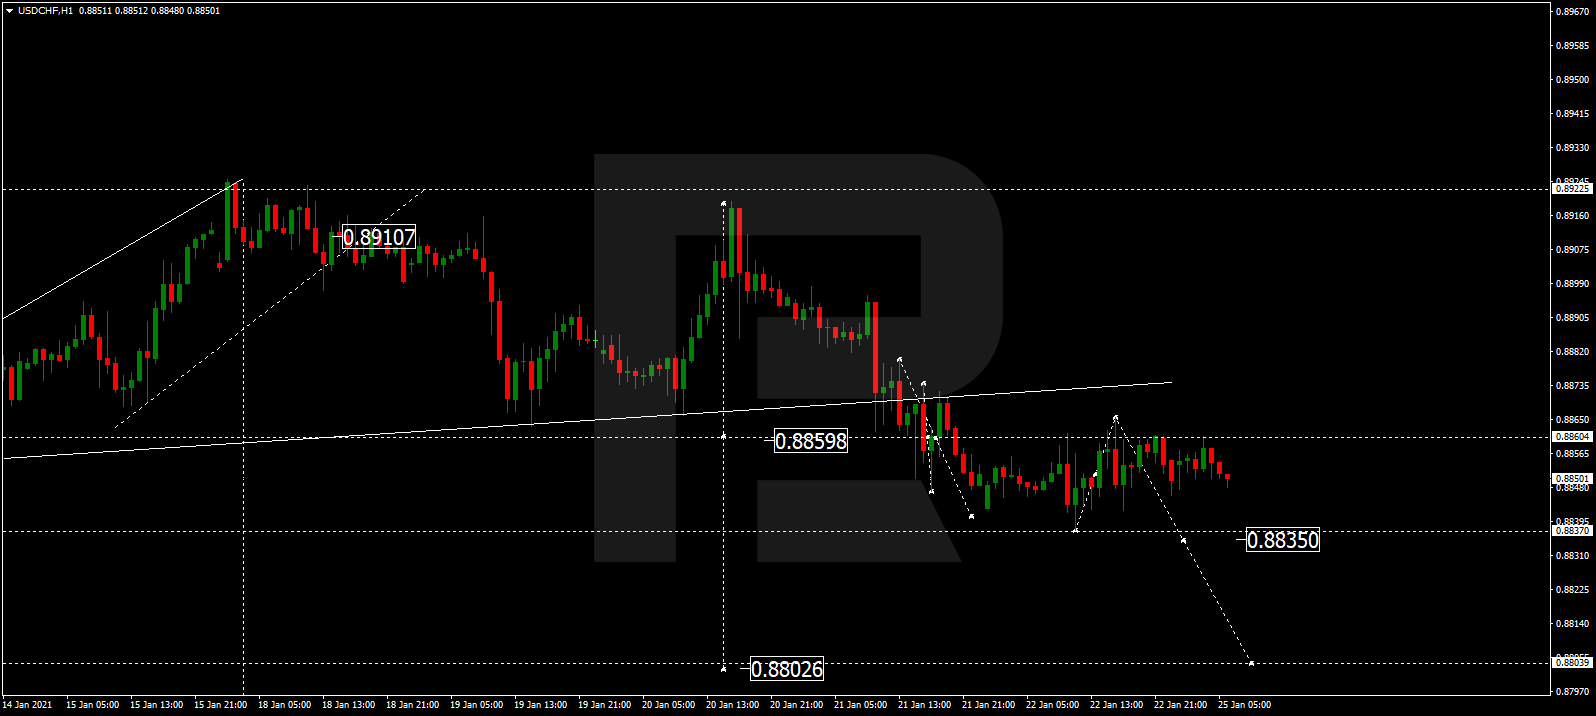
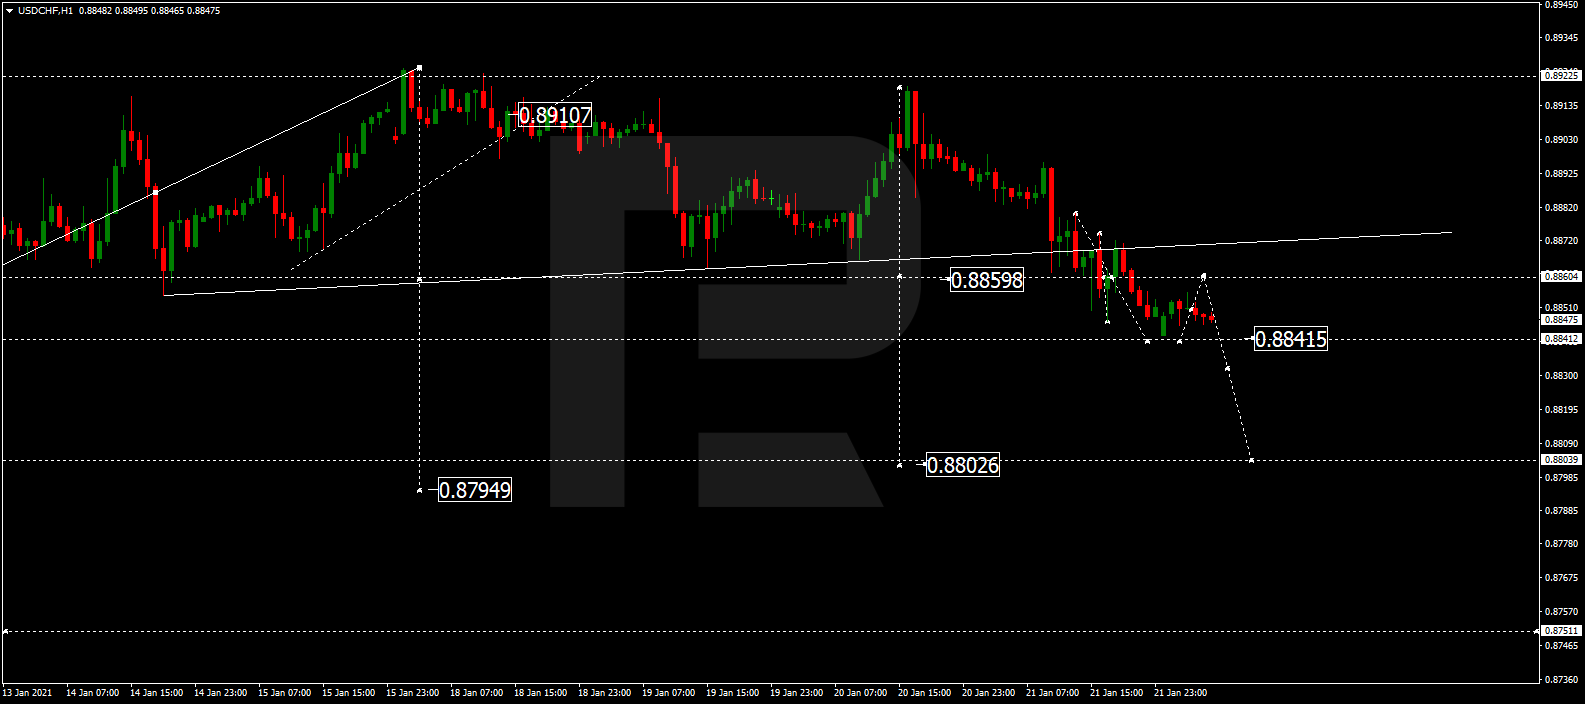
USDCHF, “US Dollar vs Swiss Franc”
USDCHF has finished the descending wave at 0.8859; right now, it is consolidating around this level. Possibly, today the pair may fall to reach 0.8841 and then grow towards 0.8860. Later, the market may fall to break 0.8841 and then continue trading downwards with the short-term target at 0.8802.
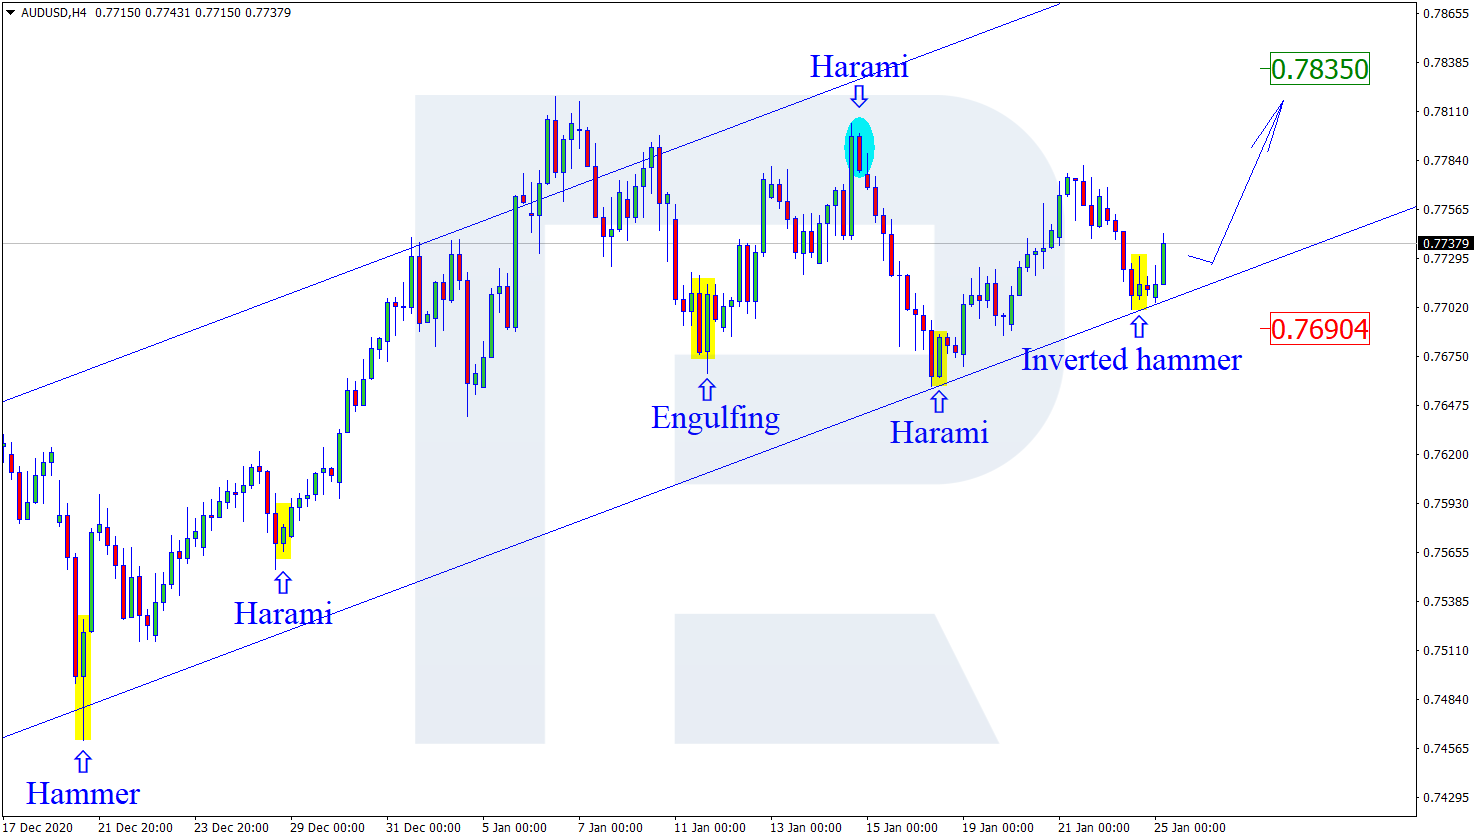
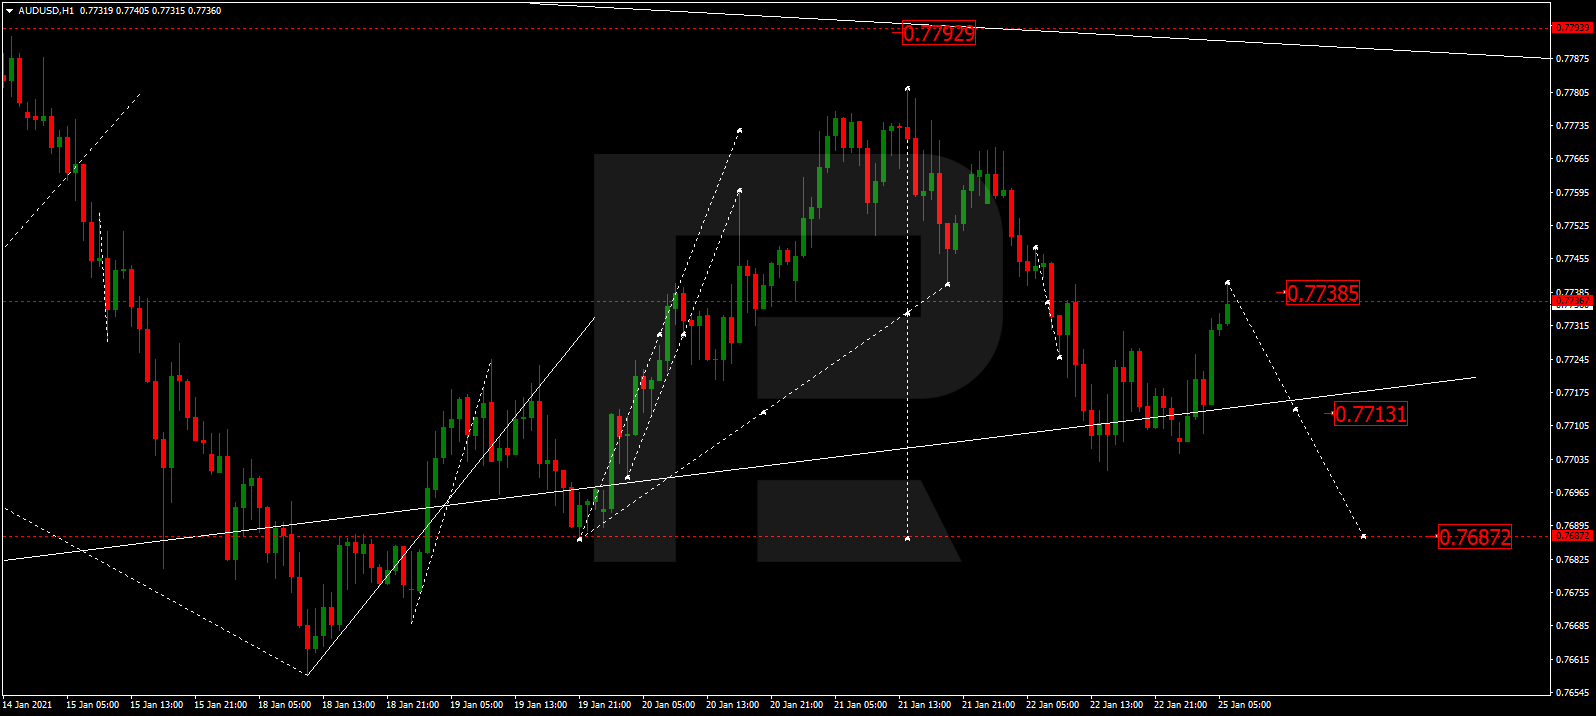
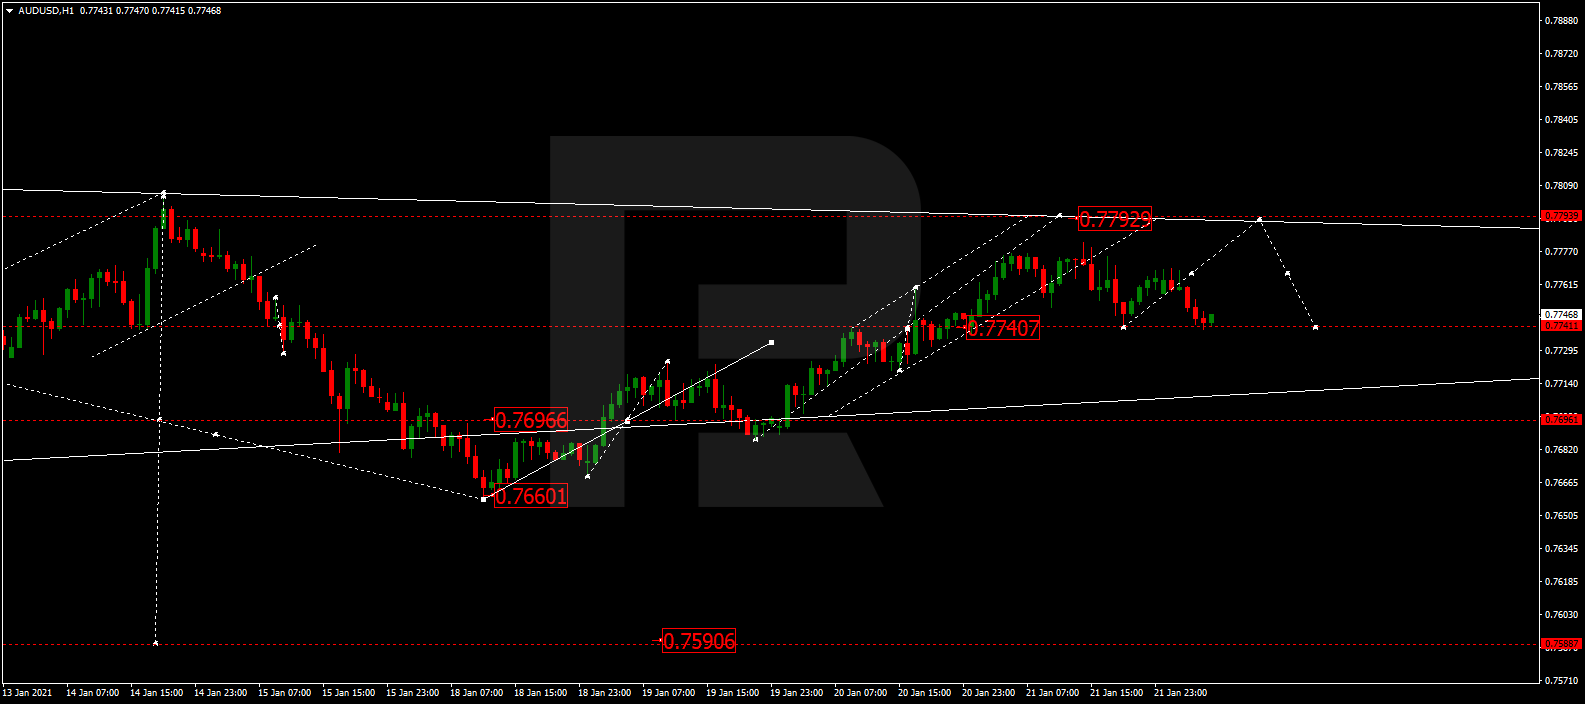
AUDUSD, “Australian Dollar vs US Dollar”
AUDUSD is still consolidating around 0.7740. Today, the pair may start another growth to reach 0.7792 and then form a new descending structure to return to 0.7740.
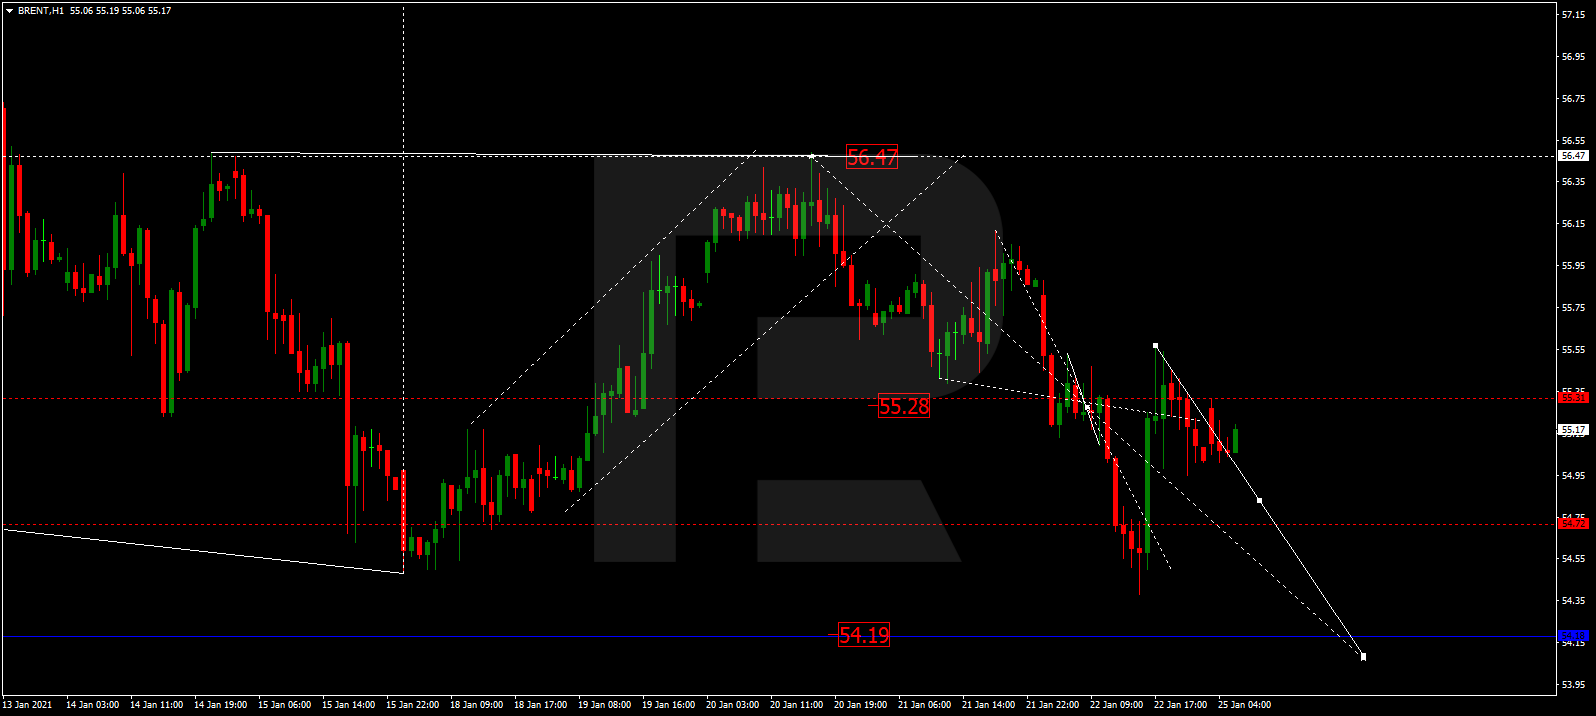
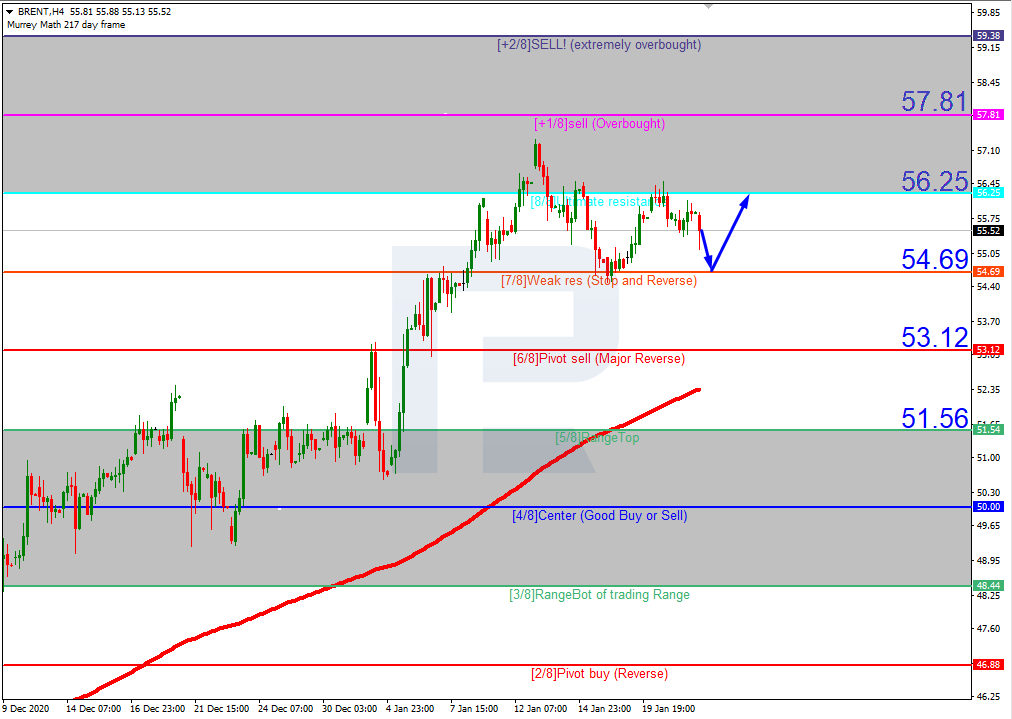
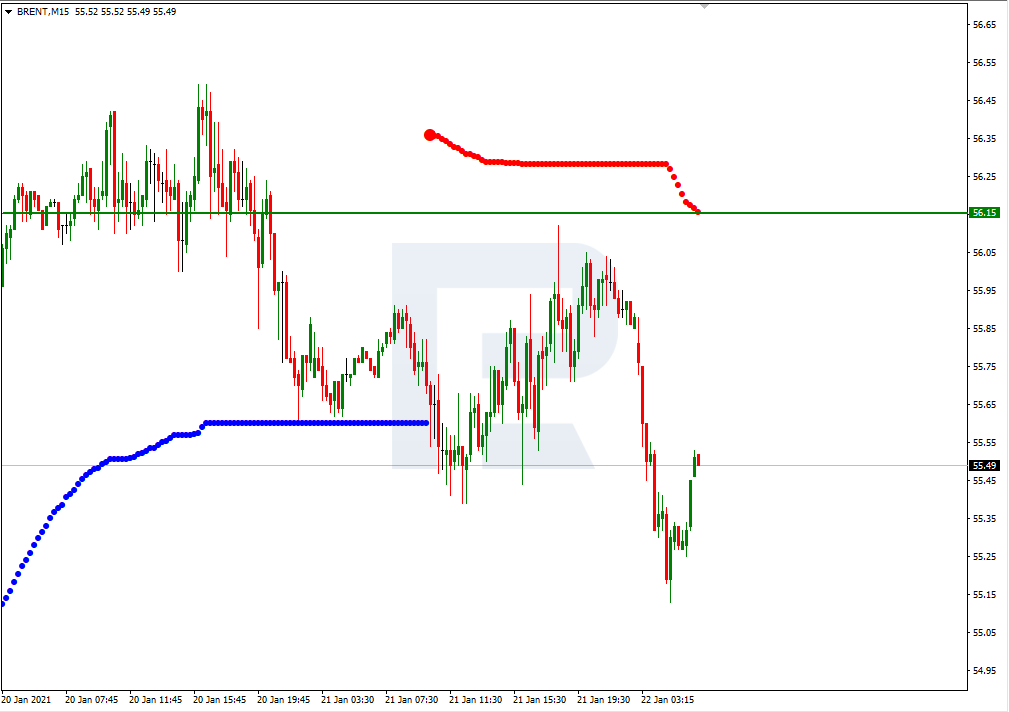
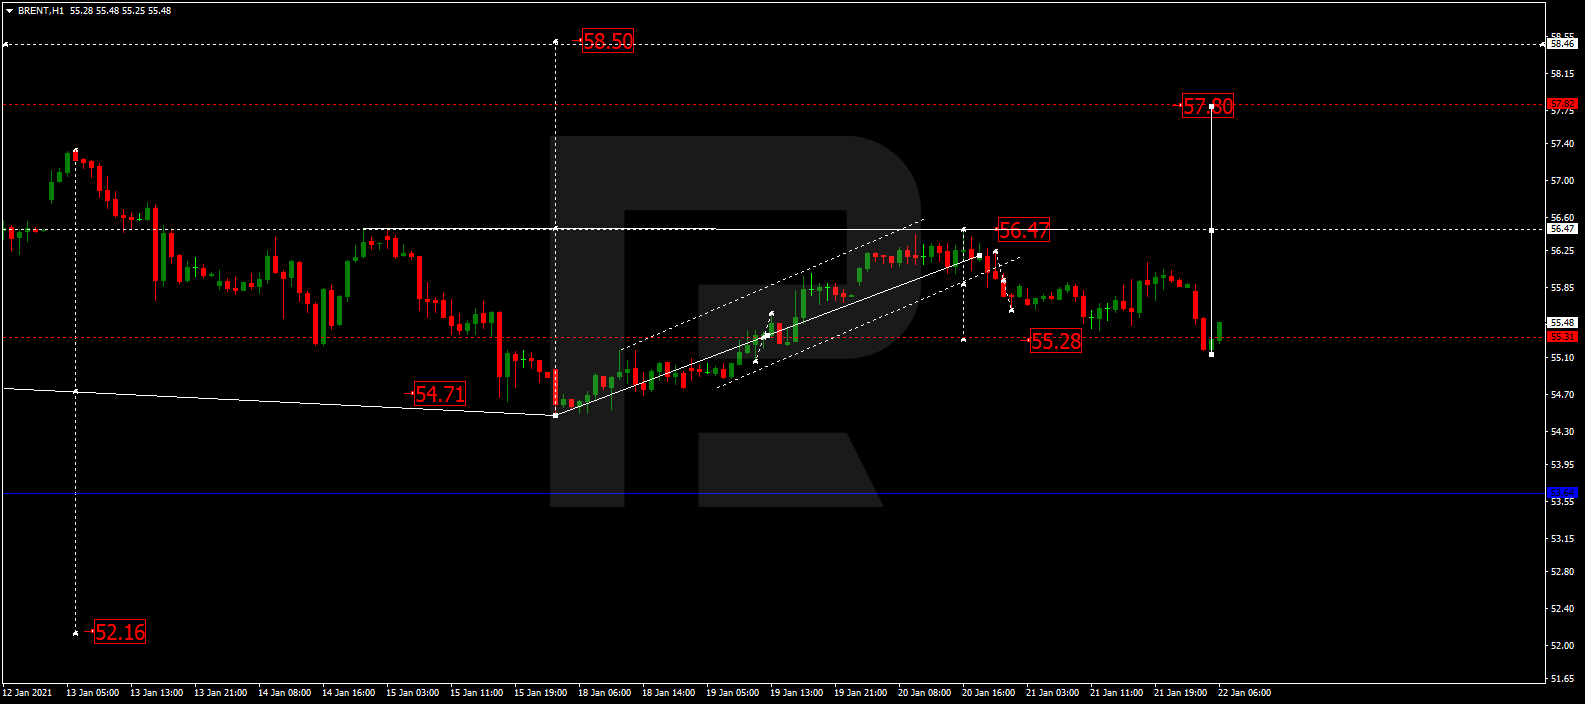
BRENT
Brent has finished the correction at 55.28. Possibly, today the asset may consolidate above this level. If later the price breaks this range to the downside, the market may resume trading downwards with the target at 56.47; if to the upside – form one more ascending wave to reach 57.80.
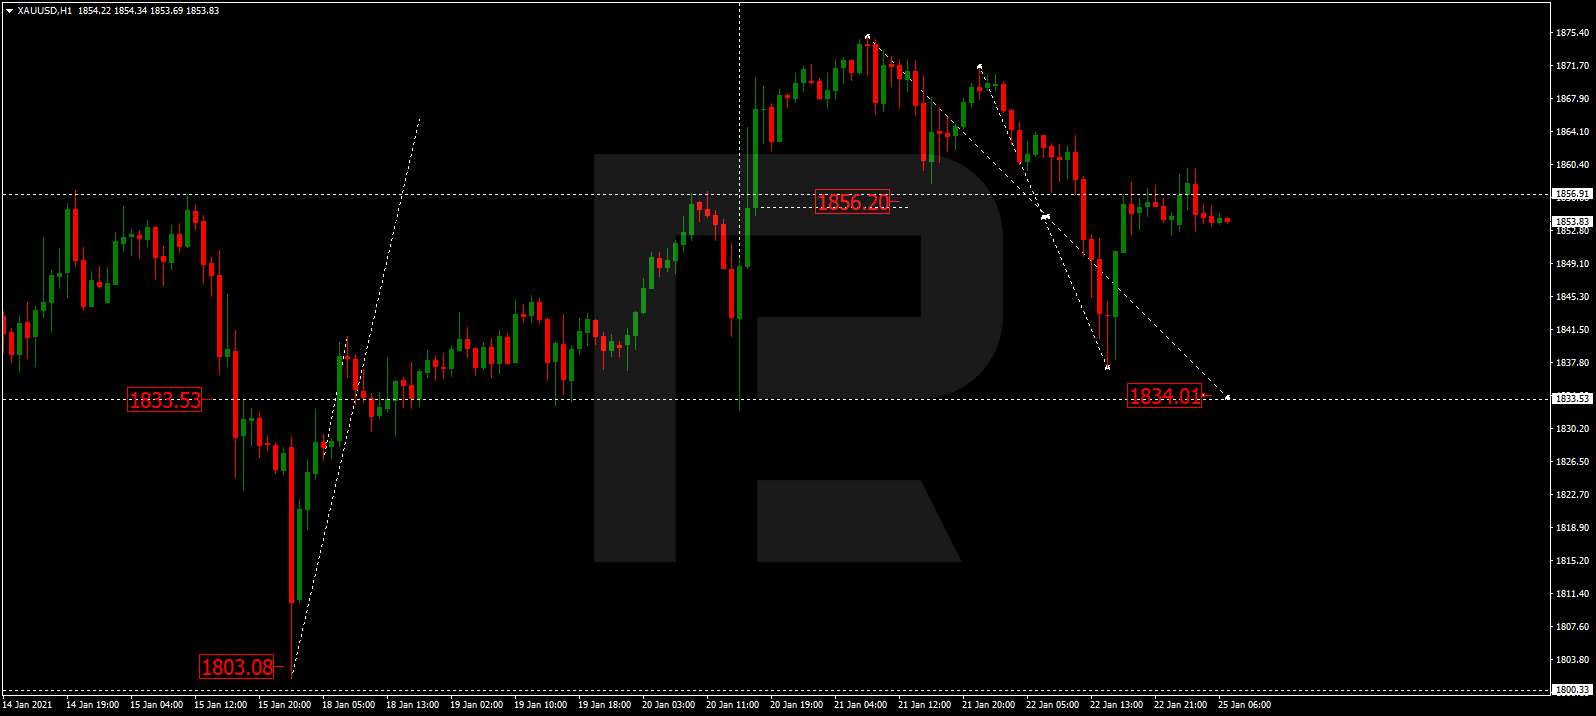
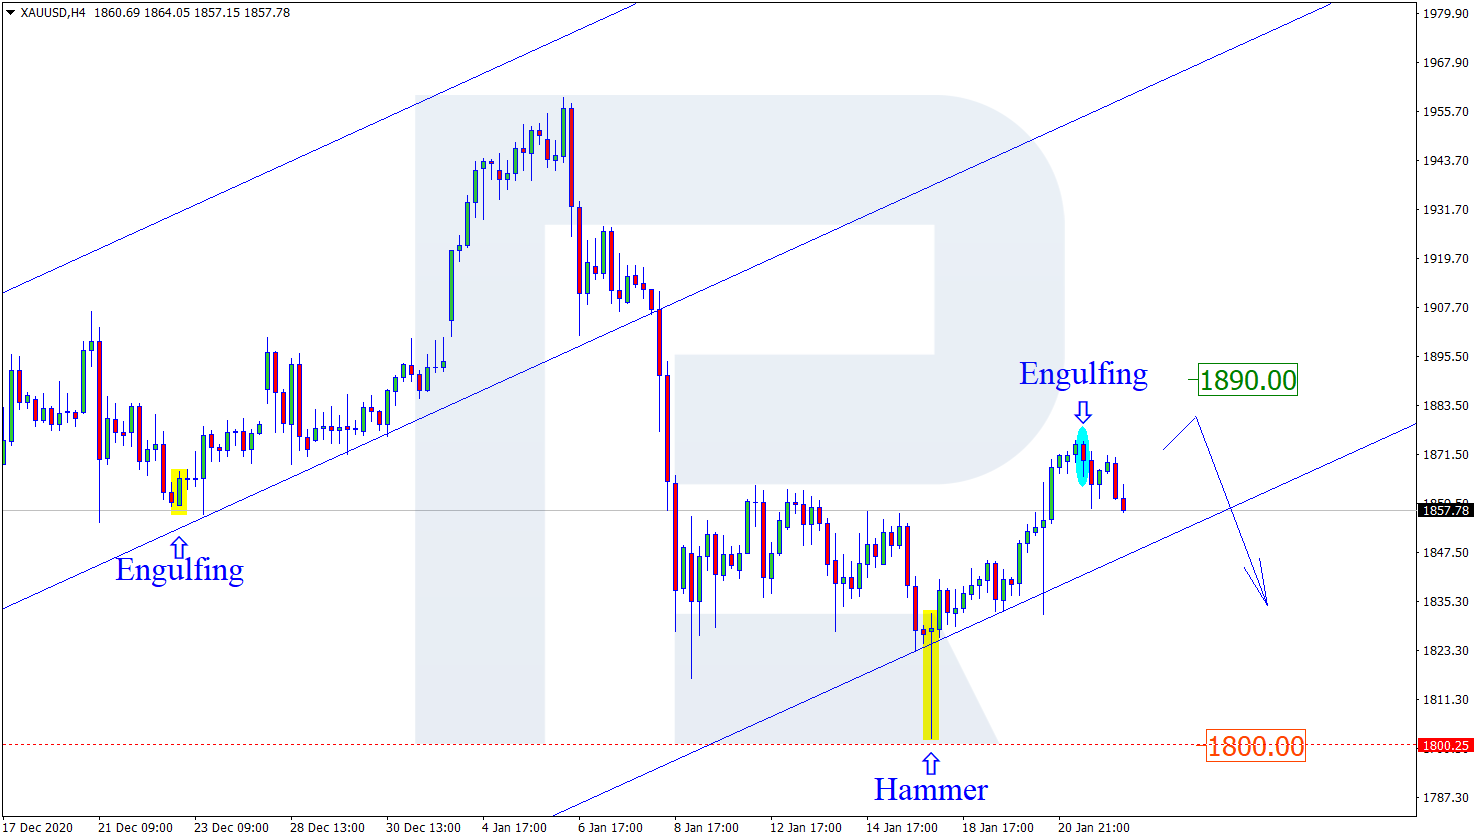
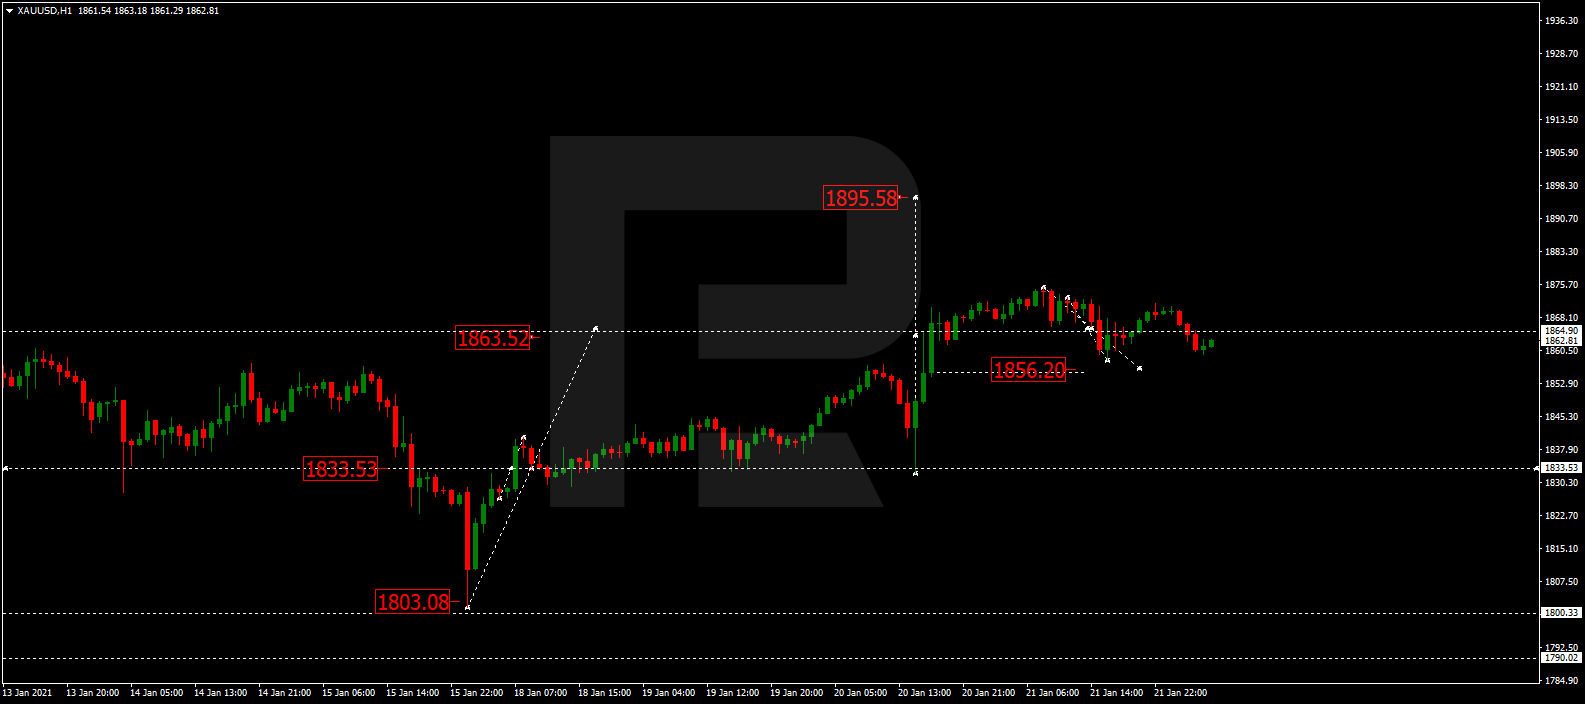
XAUUSD, “Gold vs US Dollar”
Gold is still consolidating around 1864.80. Today, the asset may fall to reach 1856.20. If later the price breaks this range to the downside, the market may resume trading downwards with the target at 1811.50; if to the upside – start another growth towards 1895.58.
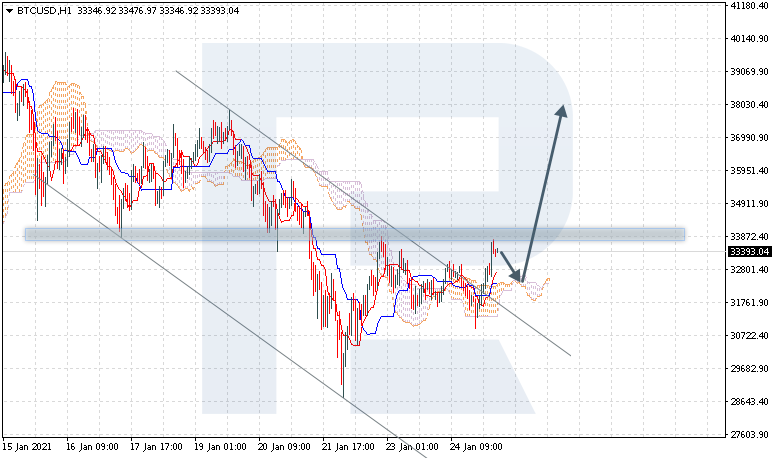
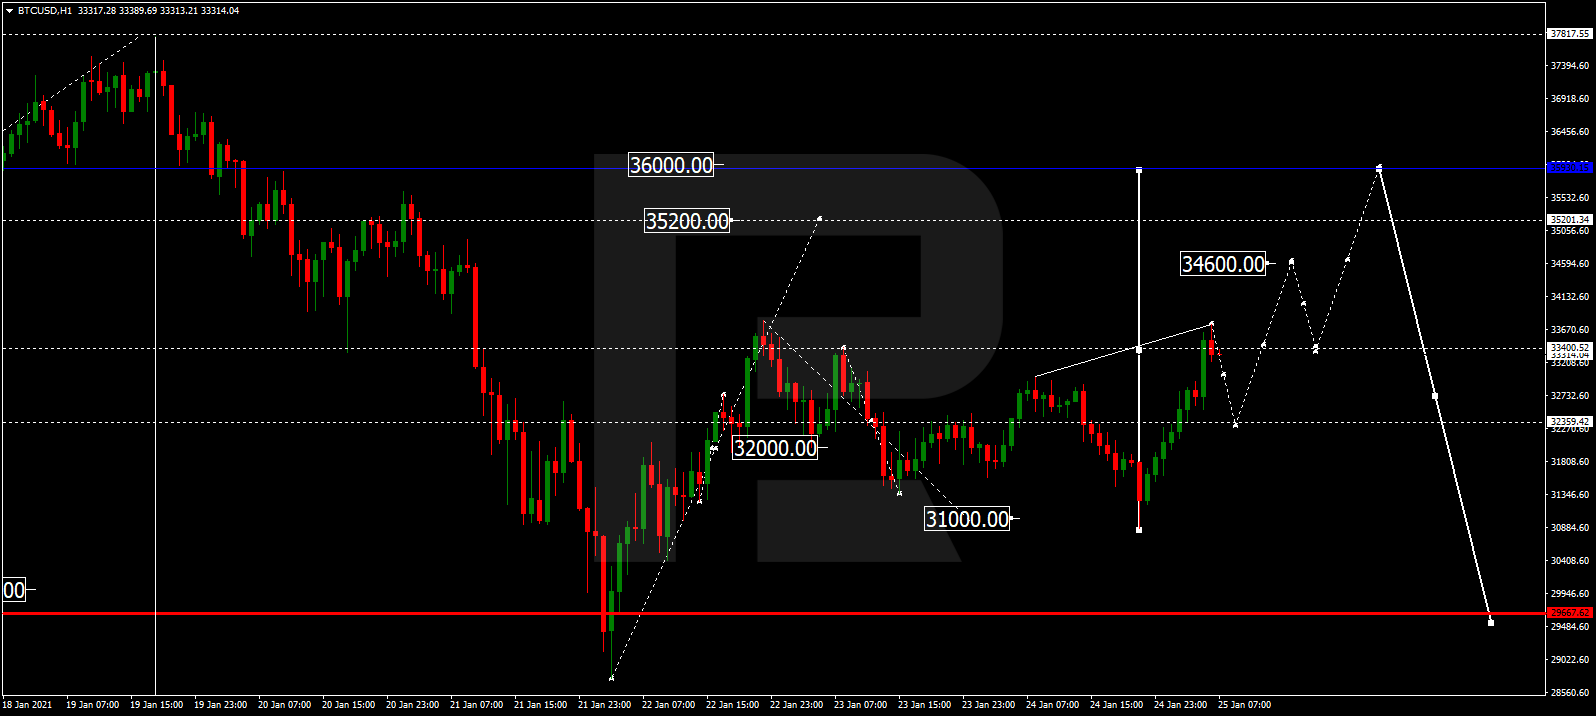
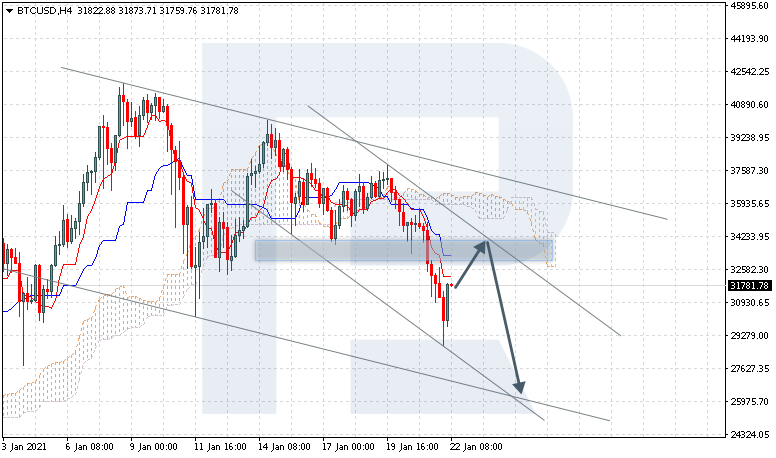
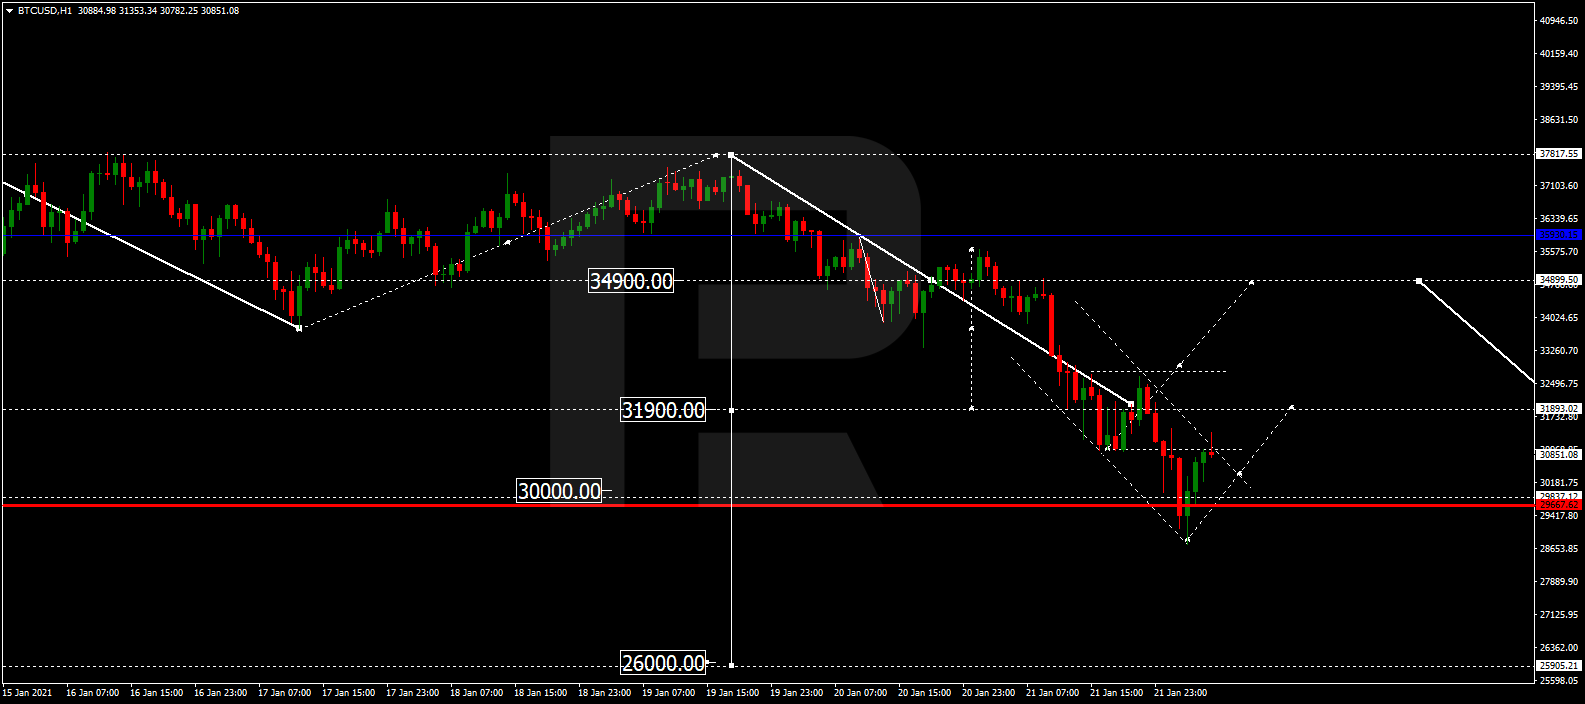
BTCUSD, “Bitcoin vs US Dollar”
After finishing the descending wave at 30000.00, BTCUSD is consolidating above this level. If later the price breaks this range to the downside, the market may resume trading within the downtrend with the target at 26000.00; if to the upside – form one more ascending structure to reach 32000.00.
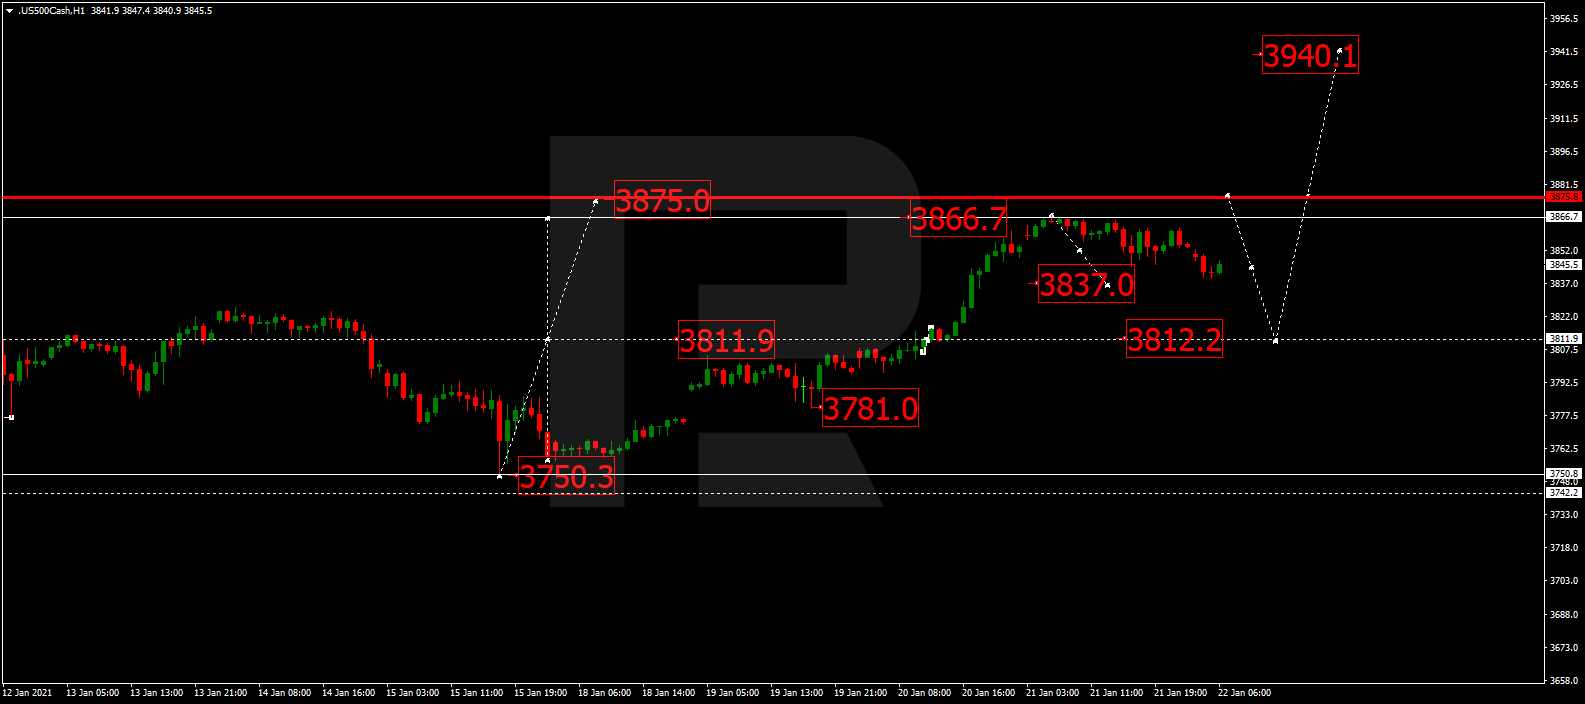
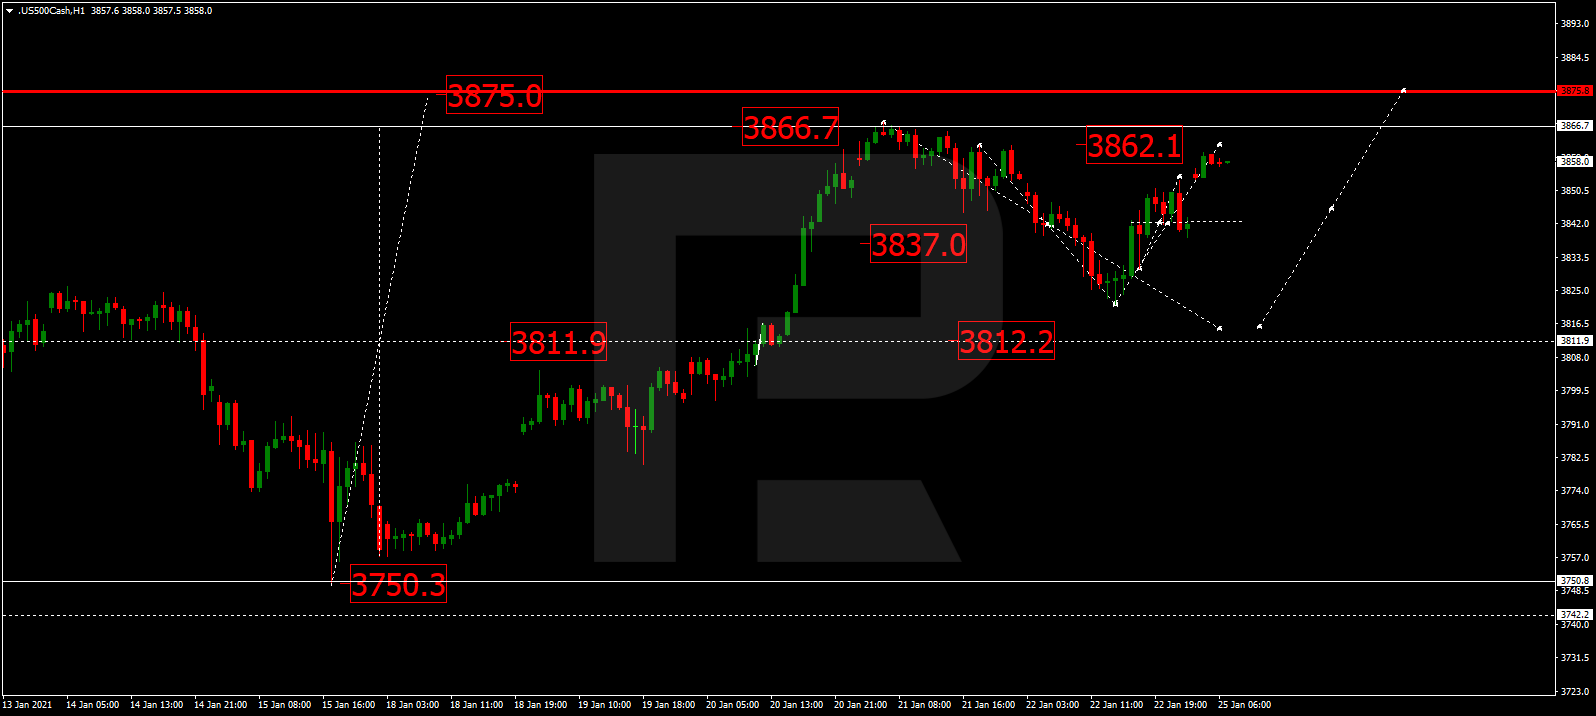
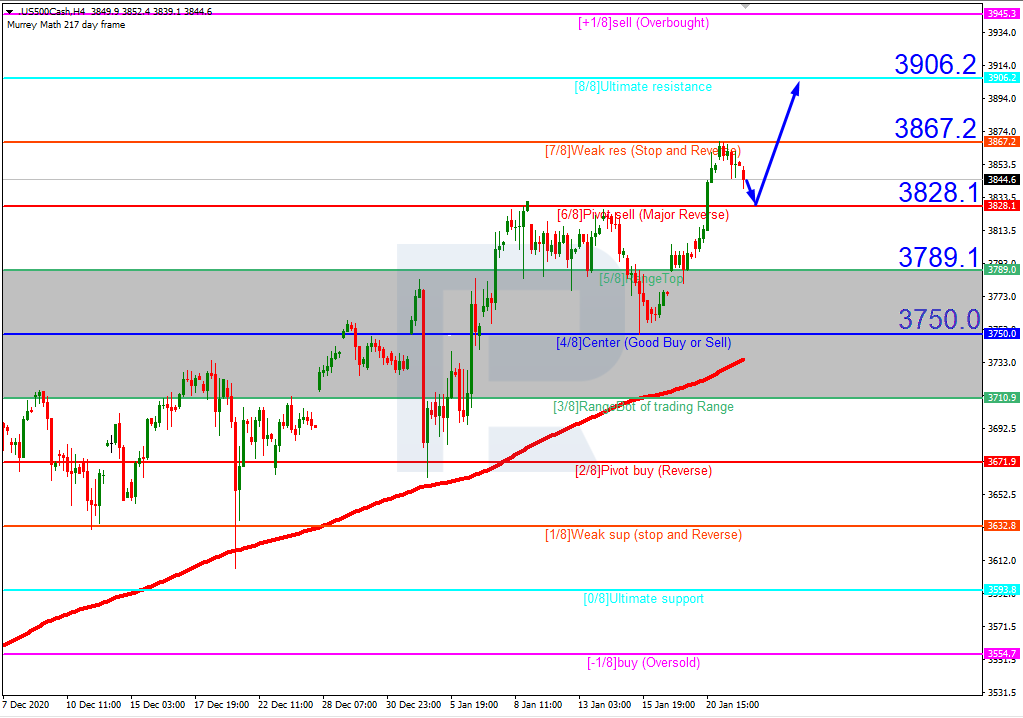
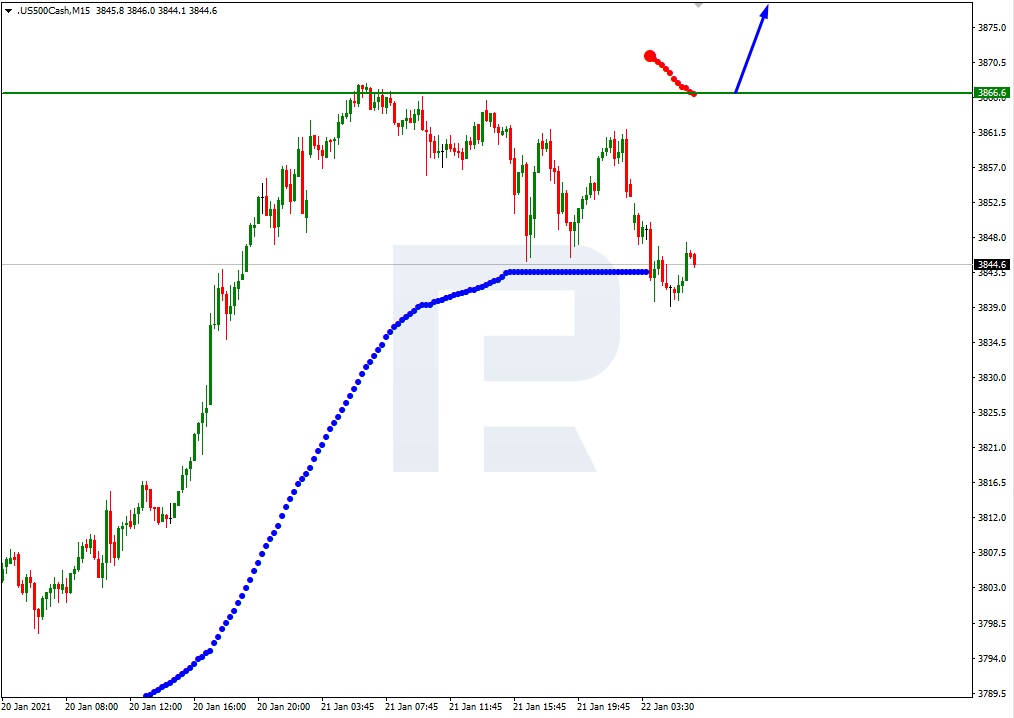
S&P 500
After completing the ascending wave at 3866.7, the S&P index is correcting towards 3837.0. After that, the instrument may start another growth to reach 3875.0 and then correct towards 3812.2. Later, the market may resume trading upwards with the target at 3940.1.