rfxsignals January 21, 2021 No Comments

The Yen is back to growing. Overview for 21.01.2021

The Yen is back to growing. Overview for 21.01.2021

21.01.2021

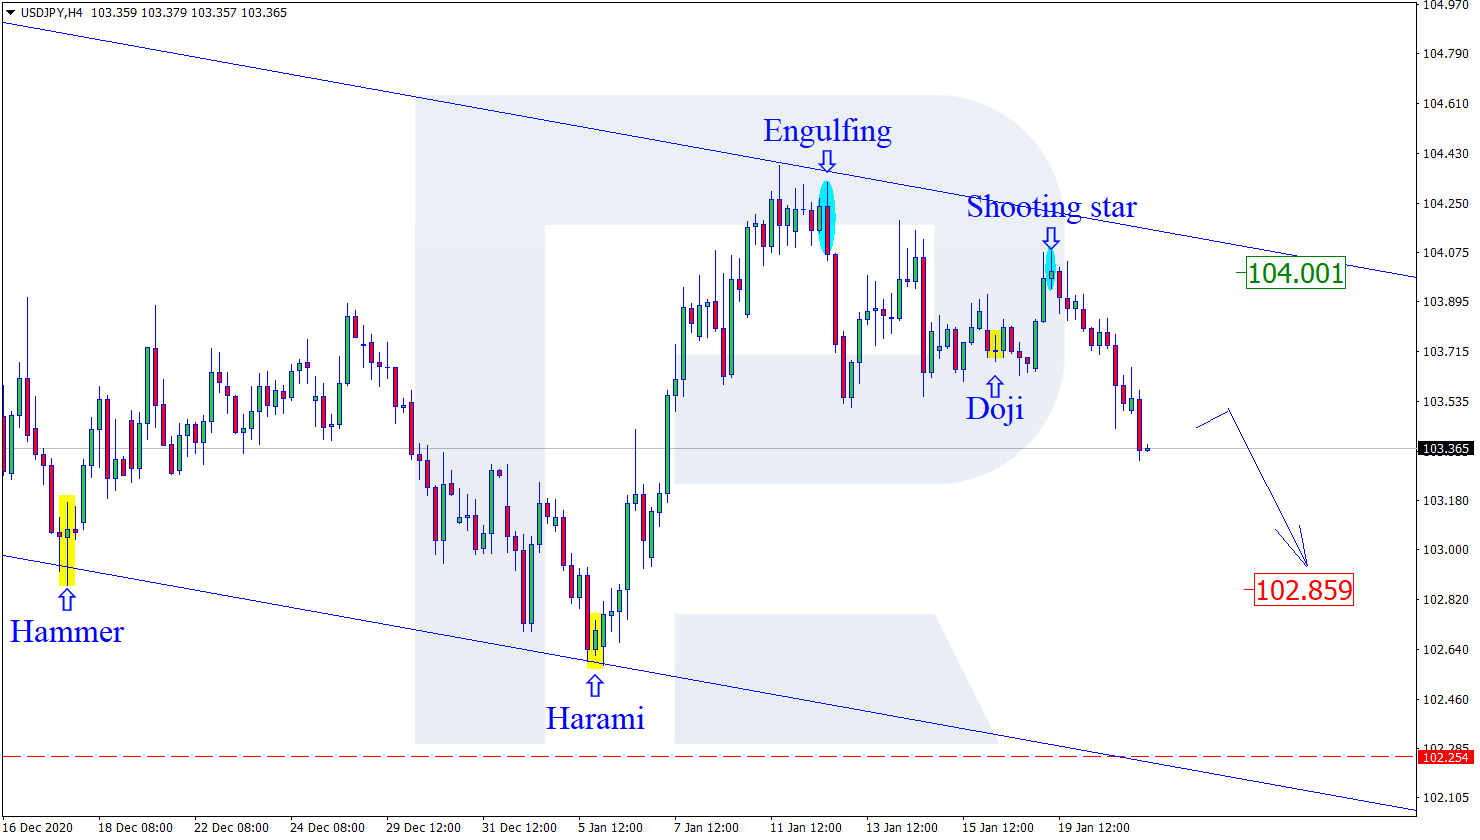
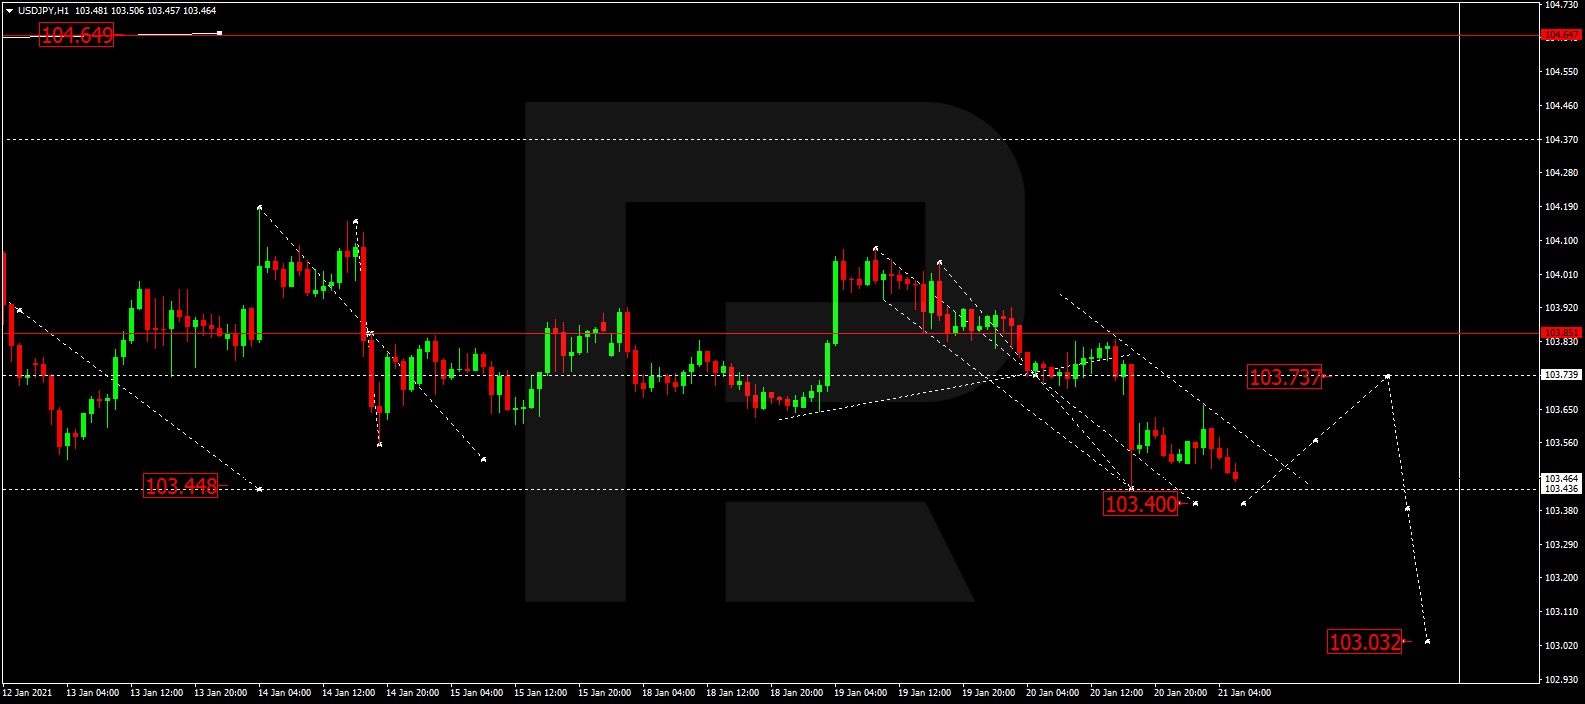
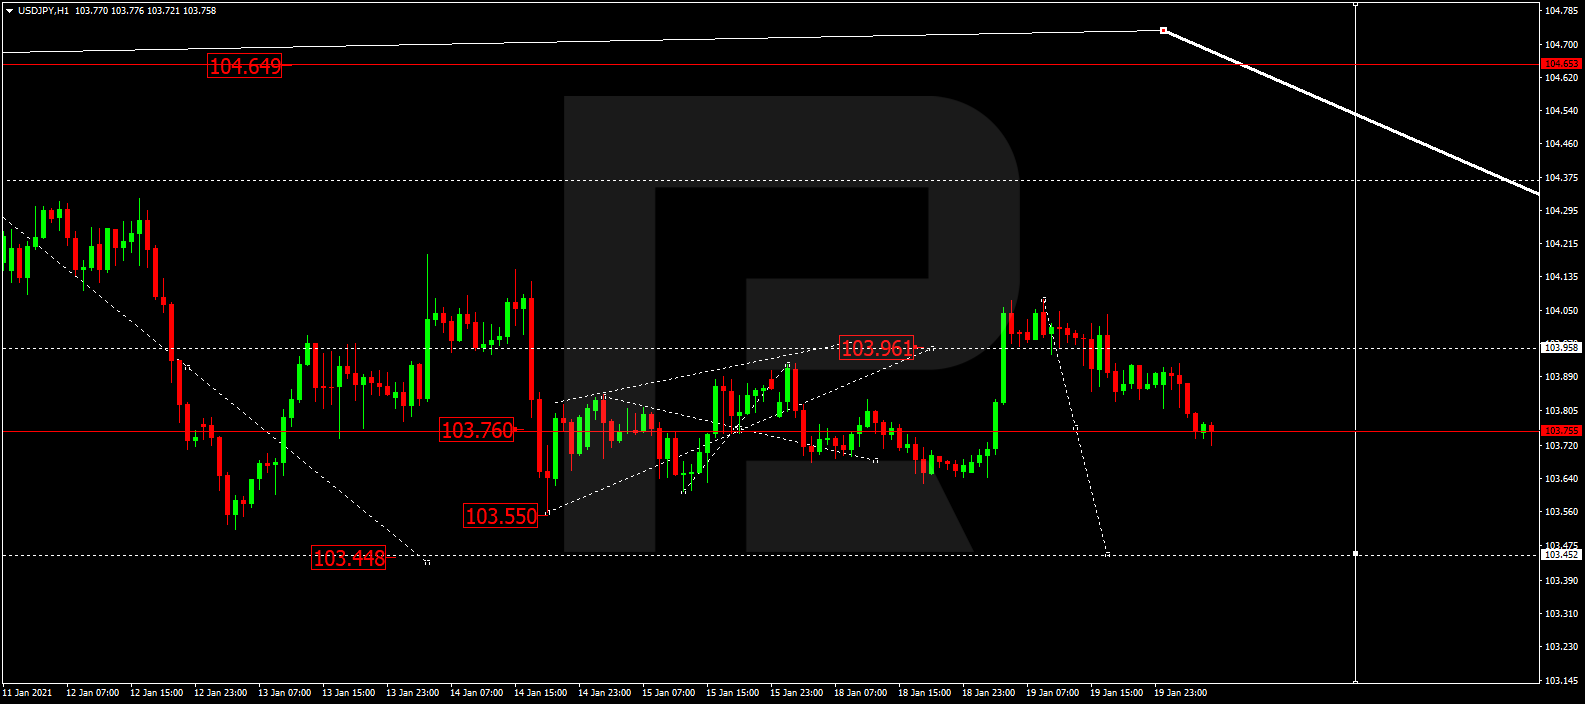
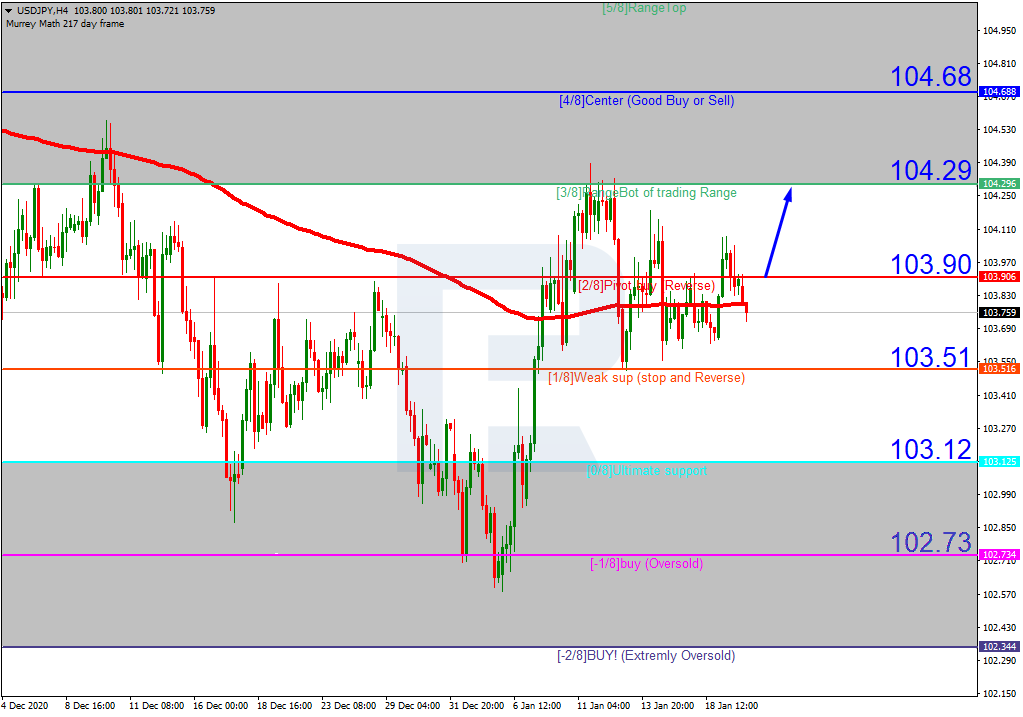
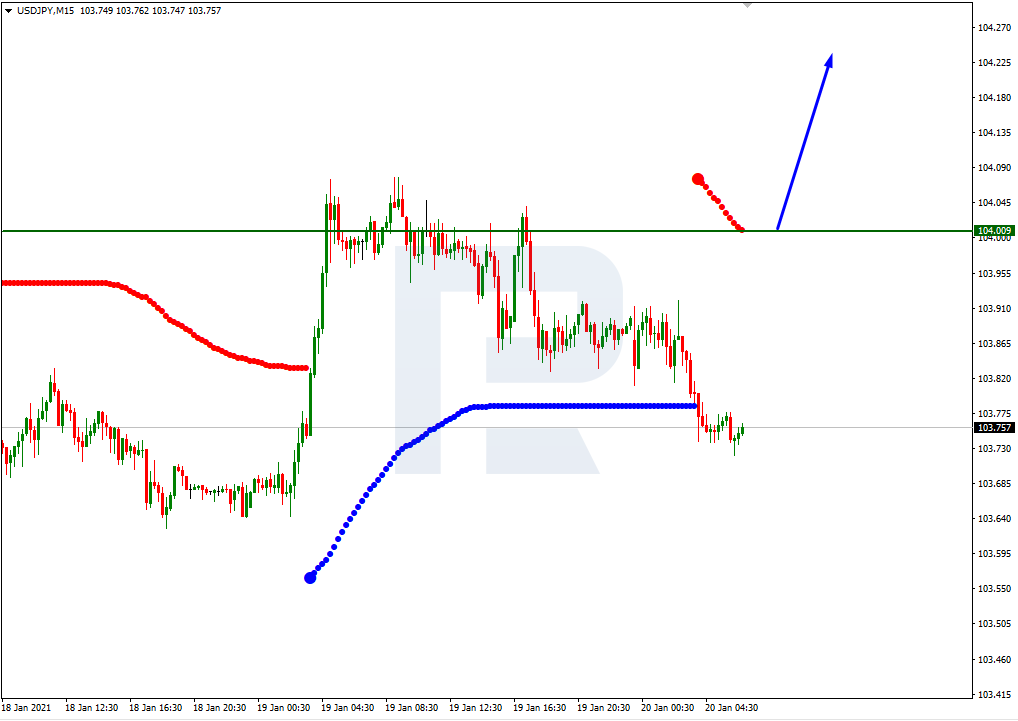
USDJPY started moving downwards yesterday and this decline is looking quite confident today.

The Japanese Yen is significantly rising against the USD on Thursday afternoon. The current quote for the instrument is 103.41.

As a rule, the demand for the Japanese currency grows when financial markets require “safe haven” assets. Probably, this is what happening right now – the pandemic isn’t over, the coronavirus continues spreading.

On Thursday, the Bank of Japan had its first meeting this year and kept the interesting rate unchanged at -0.1%. No one expected any revisions – the Japanese regulator is very conservative in its monetary moves and believes that the country’s economy has some underlying strength.

At the same time, the BoJ revised its expectations relating to the GDP in 2020, from 3.6% to 3.9%. the regulator is obviously waiting for a positive effect of the stimulus program implemented by the government.

On the other hand, the regulator sees a possibility of risk aggravation for the Japanese economy. First of all, it’s about the implementation of new quarantine restrictions aimed at fighting the coronavirus pandemic in the future. They may wreck the economic recovery plan and lead the economic system deeper into a recession.

The Yen usually doesn’t respond to politics, statistics, or fiscal news but the current strengthening may somehow be connected to the specific tone of the BoJ.

rfxsignals January 21, 2021 No Comments

Fibonacci Retracements Analysis 21.01.2021 (AUDUSD, USDCAD)

Fibonacci Retracements Analysis 21.01.2021 (AUDUSD, USDCAD)

21.01.2021

AUDUSD, “Australian Dollar vs US Dollar”

As we can see in the H4 chart, AUDUSD is forming a new local correction after a divergence on MACD. The current rising impulse is heading towards the high at 0.7820, a breakout of which will lead to a further growth to reach the long-term 50.0% fibo at 0.8292. However, if the price rebounds from the high, the asset may resume falling to reach 23.6%, 38.2%, and 50.0% fibo at 0.7625, 0.7503, and 0.7405 respectively.

AUDUSD_H4
Risk Warning: the result of previous trading operations do not guarantee the same results in the future

The H1 chart shows that the current ascending movement has already broken 61.8% fibo and is getting close to 76.0% fibo at 0.7781. If the price grows and breaks the high, the asset may continue trading upwards to reach the post-correctional extension area between 138.2% and 161.8% fibo at 0.7881 and 0.7919 respectively. The support is at 0.7659, a breakout of which may hint at a new mid-term decline.

AUDUSD_H1
Risk Warning: the result of previous trading operations do not guarantee the same results in the future

USDCAD, “US Dollar vs Canadian Dollar”

As we can see in the daily chart, after a thorough test of 76.0% fibo, USDCAD is breaking this level. In this case, the next downside target may be close to the fractal low at 1.2061. At the same time, there is a convergence on MACD, which may hint at a new pullback towards the resistance at 61.8% fibo (1.3057).

USDCAD_D1
Risk Warning: the result of previous trading operations do not guarantee the same results in the future

In the H4 chart, after breaking the low at 1.2688, the pair is falling towards the local post-correctional extension area between 138.2% and 161.8% fibo at 1.2585 and 1.2523 respectively. The local resistance is at 1.2957.

USDCAD_H4
Risk Warning: the result of previous trading operations do not guarantee the same results in the future

rfxsignals January 21, 2021 No Comments

Ichimoku Cloud Analysis 21.01.2021 (EURUSD, XAUUSD, AUDUSD)

Ichimoku Cloud Analysis 21.01.2021 (EURUSD, XAUUSD, AUDUSD)

21.01.2021

EURUSD, “Euro vs US Dollar”

EURUSD is trading at 1.2134; the instrument is moving below Ichimoku Cloud, thus indicating a descending tendency. The markets could indicate that the price may test the cloud’s downside border at 1.2140 and then resume moving downwards to reach 1.1965. Another signal in favor of a further downtrend will be a rebound from the upside border of the Triangle pattern. However, the bearish scenario may be canceled if the price breaks the cloud’s upside border and fixes above 1.2230. In this case, the pair may continue growing towards 1.2315. To confirm further decline, the asset must break the pattern’s downside border and fix below 1.2040.

EURUSD
Risk Warning: the result of previous trading operations do not guarantee the same results in the future

XAUUSD, “Gold vs US Dollar”

XAUUSD is trading at 1873.00; the instrument is moving inside Ichimoku Cloud, thus indicating a sideways tendency. The markets could indicate that the price may test the cloud’s downside border at 1845.00 and then resume moving upwards to reach 1945.00. Another signal in favor of a further uptrend will be a rebound from the descending channel’s upside border. However, the bullish scenario may no longer be valid if the price breaks the cloud’s downside border and fixes below 1815.00. In this case, the pair may continue falling towards 1780.00. To confirm further growth, the asset must break the cloud’s upside border and fix above 1895.00.

XAUUSD
Risk Warning: the result of previous trading operations do not guarantee the same results in the future

AUDUSD, “Australian Dollar vs US Dollar”

AUDUSD is trading at 0.7770; the instrument is moving above Ichimoku Cloud, thus indicating an ascending tendency. The markets could indicate that the price may test Tenkan-Sen and Kijun-Sen at 0.7740 and then resume moving upwards to reach 0.7830. Another signal in favor of a further uptrend will be a rebound from the rising channel’s downside border. However, the bullish scenario may no longer be valid if the price breaks the cloud’s downside border and fixes below 0.7665. In this case, the pair may continue falling towards 0.7575.

AUDUSD
Risk Warning: the result of previous trading operations do not guarantee the same results in the future

rfxsignals January 21, 2021 No Comments

Japanese Candlesticks Analysis 21.01.2021 (EURUSD, USDJPY, EURGBP)

Japanese Candlesticks Analysis 21.01.2021 (EURUSD, USDJPY, EURGBP)

21.01.2021

EURUSD, “Euro vs. US Dollar”

As we can see in the H4 chart, the ascending tendency continues. Right now, after forming several reversal patterns, such as Hammer, close to the support level, EURUSD may reverse in the form of another rising impulse. The upside target may be at 1.2180. After that, the pair may rebound from the resistance level and resume trading downwards. However, an alternative scenario implies that the price may start a new decline to reach 1.2020 without testing 1.2180.

EURUSD
Risk Warning: the result of previous trading operations do not guarantee the same results in the future

USDJPY, “US Dollar vs. Japanese Yen”

As we can see in the H4 chart, after rebounding from the channel’s upside border and forming a Shooting Star pattern, the pair is still reversing. The downside target may be the support area at 102.85. After completing another correction, USDJPY may resume trading downwards. At the same time, an opposite scenario implies that the price may continue its growth to return to 104.00 before resuming its decline.

USDJPY
Risk Warning: the result of previous trading operations do not guarantee the same results in the future

EURGBP, “Euro vs. Great Britain Pound”

As we can see in the H4 chart, after forming several reversal patterns, such as Hammer, not far from the support level, EURGBP may reverse and start another pullback. In this case, the correctional target may be at 0.8925. However, judging by previous movements, the pair may yet continue its decline to reach 0.8785 without reversing and correcting.

EURGBP
Risk Warning: the result of previous trading operations do not guarantee the same results in the future

rfxsignals January 21, 2021 No Comments

Murrey Math Lines 21.01.2021 (USDCHF, GOLD)

Murrey Math Lines 21.01.2021 (USDCHF, GOLD)

21.01.2021

USDCHF, “US Dollar vs Swiss Franc”

As we can see in the H4 chart, USDCHF is moving below the 200-day Moving Average, thus indicating a descending tendency. In this case, the price is expected to break 3/8 and then continue falling to reach the support at 1/8. Still, this scenario may no longer be valid if the price breaks 4/8 to the upside. After that, the instrument may reverse and grow towards the resistance at 5/8.

USDCHF_H4
Risk Warning: the result of previous trading operations do not guarantee the same results in the future

In the M15 chart, the pair may break the downside line of the VoltyChannel indicator and, as a result, continue the descending tendency.

USDCHF_M15
Risk Warning: the result of previous trading operations do not guarantee the same results in the future

XAUUSD, “Gold vs US Dollar”

In the H4 chart, XAUUSD is consolidating. In this case, the price is expected to break 4/8 and then continue growing to reach the resistance not far from the upside border of the range at 5/8. However, this scenario may no longer be valid if the price breaks the resistance at 3/8 to the downside. After that, the instrument may continue falling towards the support at 2/8.

XAUUSD_H4
Risk Warning: the result of previous trading operations do not guarantee the same results in the future

As we can see in the M15 chart, the price has broken the upside line of the VoltyChannel indicator and, as a result, may continue growing.

XAUUSD_M15
Risk Warning: the result of previous trading operations do not guarantee the same results in the future

rfxsignals January 21, 2021 No Comments

Forex Technical Analysis & Forecast 21.01.2021

Forex Technical Analysis & Forecast 21.01.2021

21.01.2021

EURUSD, “Euro vs US Dollar”

EURUSD has completed the correction at 1.2082; right now, it is forming another ascending wave towards 1.2170 and may later consolidate around this level. If the price breaks this range to the upside, the market may resume growing with the short-term target at 1.2260.

EURUSD
Risk Warning: the result of previous trading operations do not guarantee the same results in the future

GBPUSD, “Great Britain Pound vs US Dollar”

After finishing the correction at 1.3523, GBPUSD is trading upwards to reach 1.3715. Later, the market may start a new correction towards 1.3678 and then form one more ascending structure with the target at 1.3730.

GBPUSD
Risk Warning: the result of previous trading operations do not guarantee the same results in the future

USDRUB, “US Dollar vs Russian Ruble”

USDRUB is forming another descending wave to break 73.00. Later, the market may continue moving within the downtrend with the short-term target at 72.20.

USDRUB
Risk Warning: the result of previous trading operations do not guarantee the same results in the future

USDJPY, “US Dollar vs Japanese Yen”

USDJPY is falling towards 103.40. After that, the instrument may form one more ascending structure to reach 103.73 and then start a new decline with the target at 103.03.

USDJPY
Risk Warning: the result of previous trading operations do not guarantee the same results in the future

USDCHF, “US Dollar vs Swiss Franc”

USDCHF has finished the correction at 0.8910. Possibly, today the pair may form a new descending structure to break 0.8860 and then continue trading downwards with the short-term target at 0.8802.

USDCHF
Risk Warning: the result of previous trading operations do not guarantee the same results in the future

AUDUSD, “Australian Dollar vs US Dollar”

After completing the ascending wave at 0.7740 and then forming a new consolidation range around this level, AUDUSD has broken it to the upside. Today, the pair may extent this ascending structure up to 0.7793.

AUDUSD
Risk Warning: the result of previous trading operations do not guarantee the same results in the future

BRENT

Brent has finished the ascending wave at 56.47. Possibly, the asset may correct to reach 55.30 and then resume trading upwards with the target at 57.65.

BRENT
Risk Warning: the result of previous trading operations do not guarantee the same results in the future

XAUUSD, “Gold vs US Dollar”

Gold has completed the ascending wave at 1863.50; right now, it is consolidating around this level. If later the price breaks this range to the downside, the market may resume trading downwards with the target at 1833.53; if to the upside – extend this ascending wave up to 1895.55.

GOLD
Risk Warning: the result of previous trading operations do not guarantee the same results in the future

BTCUSD, “Bitcoin vs US Dollar”

BTCUSD is falling towards 31900.00. Later, the market may form one more ascending structure to test 35000.00 from below and then resume falling with the target at 30000.00.

BITCOIN
Risk Warning: the result of previous trading operations do not guarantee the same results in the future

S&P 500

After completing the ascending wave at 3811.9 and forming a new consolidation range around this level, the S&P index is has broken it to the upside to reach the predicted upside target at 3866.7. today, the asset may correct towards 3837.1 and then resume trading upwards with the target at 3875.0.

S&P 500
Risk Warning: the result of previous trading operations do not guarantee the same results in the future

rfxsignals January 20, 2021 No Comments

Daily Free Forex Signals For 20/01/2021

Here your going to see Daily Free Forex Signals For 20/01/2021 to free forex signal alert from our kitkat trading system and other trading logic’s .we provide like this free forex signals from 2012 on wards with more than 50,000 traders around the world .The free forex signals have 70 to 85% quality always .we give for you a note as maximum focus take profit 1 as your target and must use stop loss values .if you have any other query’s please visit our live chat or email option

EURGBP SELL-0.889248
SL-0.892856
TP1-0.887685
TP2-0.886142

CADJPY BUY-81.649459
SL-81.283327
TP1-81.804629
TP2-81.970261

AUDUSD BUY-0.772521
SL-0.767598
TP1-0.774116
TP2-0.776057

CADCHF BUY-0.698316
SL-0.6951
TP1-0.69987
TP2-0.701415

GBPJPY BUY-142.042345
SL-141.650281
TP1-142.200341
TP2-142.37004

GBPCHF BUY-1.216824
SL-1.212742
TP1-1.218371
TP2-1.219934

EURCHF SELL-1.077809
SL-1.080756
TP1-1.076222
TP2-1.07469

EURNZD SELL-1.698821
SL-1.702947
TP1-1.697194
TP2-1.695654

CHFJPY SELL-116.792705
SL-117.117335
TP1-116.640321
TP2-116.491303


rfxsignals January 20, 2021 No Comments

Forex Technical Analysis & Forecast 20.01.2021

Forex Technical Analysis & Forecast 20.01.2021

20.01.2021

EURUSD, “Euro vs US Dollar”

EURUSD has completed the ascending wave at 1.2147. Today, the pair may correct to reach 1.2100 and then resume growing with the short-term target at 1.2230.

EURUSD
Risk Warning: the result of previous trading operations do not guarantee the same results in the future

GBPUSD, “Great Britain Pound vs US Dollar”

GBPUSD continues trading upwards. Possibly, the pair may reach 1.3656 and then start a new correction towards 1.3600. After that, the instrument may start another growth with the target at 1.3683.

GBPUSD
Risk Warning: the result of previous trading operations do not guarantee the same results in the future

USDRUB, “US Dollar vs Russian Ruble”

USDRUB has finished the descending wave at 73.65; right now, it is forming another consolidation range above this level. Possibly, today the pair may break this range to the downside and reach 73.00. Later, the market may break this level as well and then continue moving within the downtrend with the target at 72.20.

USDRUB
Risk Warning: the result of previous trading operations do not guarantee the same results in the future

USDJPY, “US Dollar vs Japanese Yen”

USDJPY has finished the descending wave at 103.76. Today, the pair may consolidate around this level. After that, the instrument may break the range to the downside and continue trading downwards with the target at 103.44. Later, the market may form one more ascending structure to reach 104.60.

USDJPY
Risk Warning: the result of previous trading operations do not guarantee the same results in the future

USDCHF, “US Dollar vs Swiss Franc”

USDCHF is forming a new descending structure towards 0.8858 and may later start another correction to reach 0.8890, thus forming a new consolidation range between these two levels. After that, the instrument may break the range to the downside and resume trading downwards with the target at 0.8844.

USDCHF
Risk Warning: the result of previous trading operations do not guarantee the same results in the future

AUDUSD, “Australian Dollar vs US Dollar”

AUDUSD is growing towards 0.7742 and may later fall to reach 0.7696, thus forming a new consolidation range between these two levels. If the price breaks this range to the downside, the market may form a new descending structure towards 0.7590; if to the upside – resume trading upwards with the target at 0.7780.

AUDUSD
Risk Warning: the result of previous trading operations do not guarantee the same results in the future

BRENT

Brent has broken 55.25 to the upside. Possibly, the asset may reach 56.22 and then start a new correction towards 55.30. After that, the instrument may continue trading upwards with the short-term target at 57.50.

BRENT
Risk Warning: the result of previous trading operations do not guarantee the same results in the future

XAUUSD, “Gold vs US Dollar”

Gold is still growing towards 1863.50 and may later fall to reach 1834.00, thus forming a new consolidation range between these two levels. If the price breaks this range to the downside, the market may resume trading downwards with the target at 1803.00.

GOLD
Risk Warning: the result of previous trading operations do not guarantee the same results in the future

BTCUSD, “Bitcoin vs US Dollar”

BTCUSD is falling towards 34600.00. Later, the market may form one more ascending structure to reach 36700.00 and then resume falling with the target at 31700.00.

BITCOIN
Risk Warning: the result of previous trading operations do not guarantee the same results in the future

S&P 500

After completing the ascending wave at 3806.1, the S&P index is forming a new consolidation range around this level. After that, the instrument may break the range to the downside and resume trading downwards to break 3778.5. Later, the market may continue falling with the target at 3737.2.

S&P 500

rfxsignals January 20, 2021 No Comments

Murrey Math Lines 20.01.2021 (USDJPY, USDCAD)

Murrey Math Lines 20.01.2021 (USDJPY, USDCAD)

20.01.2021

USDJPY, “US Dollar vs. Japanese Yen”

As we can see in the H4 chart, after making several attempts to fix above the 200-day Moving Average, USDJPY is still moving very close to it. In this case, the price expected to try to break 2/8 and then continue growing towards the resistance at 3/8. However, this scenario may no longer be valid if the price breaks 1/8 to the downside. After that, the instrument may continue falling to reach the support at 0/8.

USDJPY_H4
Risk Warning: the result of previous trading operations do not guarantee the same results in the future

In the M15 chart, the pair may break the upside line of the VoltyChannel indicator and, as a result, continue moving upwards.

USDJPY_M15
Risk Warning: the result of previous trading operations do not guarantee the same results in the future

USDCAD, “US Dollar vs Canadian Dollar”

As we can see in the H4 chart, USDCAD is still moving below the 200-day Moving Average, thus indicating a descending tendency. In this case, the pair is expected to break 0/8 and then continue falling towards the support at -1/8. Still, this scenario may no longer be valid if the price breaks 1/8 to the upside. After that, the instrument may reverse and correct to reach the resistance at 2/8.

USDCAD_H4
Risk Warning: the result of previous trading operations do not guarantee the same results in the future

In the M15 chart, the pair may break the downside line of the VoltyChannel indicator and, as a result, continue trading downwards.

USDCAD_M15

rfxsignals January 20, 2021 No Comments

Japanese Candlesticks Analysis 20.01.2021 (USDCAD, AUDUSD, USDCHF)

Japanese Candlesticks Analysis 20.01.2021 (USDCAD, AUDUSD, USDCHF)

20.01.2021

USDCAD, “US Dollar vs Canadian Dollar”

As we can see in the H4 chart, the descending tendency continues. Right now, after forming an Engulfing reversal pattern not far from the resistance level, USDCAD may reverse in the form of another descending impulse. Later, the asset may continue falling within the descending channel. In this case, the downside target will be at 1.2585. However, an alternative scenario implies a correction towards 1.2765 before the instrument resumes its decline.

USDCAD
Risk Warning: the result of previous trading operations do not guarantee the same results in the future

AUDUSD, “Australian Dollar vs US Dollar”

As we can see in the H4 chart, AUDUSD is forming another rising impulse. Right now, after forming several reversal patterns, such as Harami, not far from the support area, the pair may reverse and resume growing to reach the resistance area at 0.7835. At the same time, an opposite scenario says that the price may return to 0.7675 before resuming the ascending tendency.

AUDUSD
Risk Warning: the result of previous trading operations do not guarantee the same results in the future

USDCHF, “US Dollar vs Swiss Franc”

As we can see in the H4 chart, the correction within the downtrend continues. At the moment, after forming several reversal patterns, such as Shooting Star, not far from the resistance area, USDCHF is reversing and may continue the descending tendency. In this case, the downside target may be the next support area at 0.8820. Still, there might be an alternative scenario, according to which the asset may grow to return to 0.8910 before testing the support area.

USDCHF