rfxsignals February 18, 2021 No Comments

Japanese Candlesticks Analysis 18.02.2021 (USDCAD, AUDUSD, USDCHF)

Japanese Candlesticks Analysis 18.02.2021 (USDCAD, AUDUSD, USDCHF)

18.02.2021

USDCAD, “US Dollar vs Canadian Dollar”

As we can see in the H4 chart, after forming a Shooting Star reversal pattern not far from the resistance level, USDCAD is reversing and may fall towards the support level. In this case, the downside target remains at 1.2610. After that, the asset may continue forming the descending impulse. However, an alternative scenario implies a further pullback towards 1.2755 before the asset resumes the descending tendency.

USDCAD
Risk Warning: the result of previous trading operations do not guarantee the same results in the future

AUDUSD, “Australian Dollar vs US Dollar”

As we can see in the H4 chart, AUDUSD is about to resume the uptrend after another correction. Right now, after forming several reversal patterns, such as Harami, not far from the support area, the pair may reverse and resume growing to reach the resistance level at 0.7830. At the same time, an opposite scenario says that the price may correct towards 0.7710 before resuming its growth.

AUDUSD
Risk Warning: the result of previous trading operations do not guarantee the same results in the future

USDCHF, “US Dollar vs Swiss Franc”

As we can see in the H4 chart, the uptrend continues. At the moment, after forming a Hammer reversal pattern not far from the support area, USDCHF is reversing. The upside target is the resistance level at 0.9035. Still, there might be an alternative scenario, according to which the asset may correct towards 0.8940 before testing the resistance area.

USDCHF
Risk Warning: the result of previous trading operations do not guarantee the same results in the future

rfxsignals February 18, 2021 No Comments

Ichimoku Cloud Analysis 18.02.2021 (NZDUSD, XAUUSD, CADJPY)

Ichimoku Cloud Analysis 18.02.2021 (NZDUSD, XAUUSD, CADJPY)

18.02.2021

NZDUSD, “New Zealand Dollar vs US Dollar”

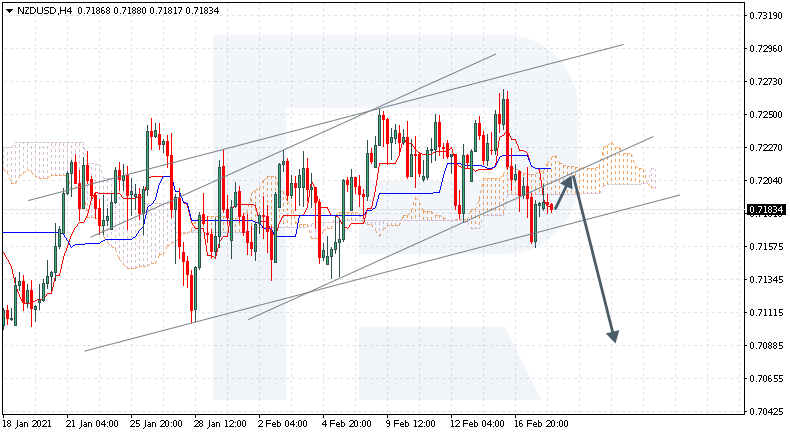
NZDUSD is trading at 0.7183; the instrument is moving below Ichimoku Cloud, thus indicating a descending tendency. The markets could indicate that the price may test the cloud’s downside border at 0.7205 and then resume moving downwards to reach 0.7090. Another signal in favor of a further downtrend will be a rebound from the rising channel’s downside border. However, the bearish scenario may be canceled if the price breaks the cloud’s upside border and fixes above 0.7230. In this case, the pair may continue growing towards 0.7305. To confirm further decline, the asset must break the rising channel’s downside border and fix below 0.7155.

NZDUSD
Risk Warning: the result of previous trading operations do not guarantee the same results in the future

XAUUSD, “Gold vs US Dollar”

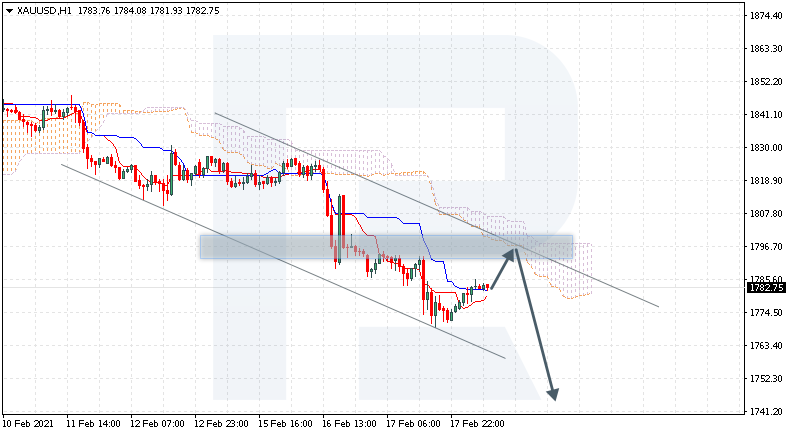
XAUUSD is trading at 1782.00; the instrument is moving below Ichimoku Cloud, thus indicating a descending tendency. The markets could indicate that the price may test the cloud’s downside border at 1795.00 and then resume moving downwards to reach 1745.00. Another signal in favor of a further downtrend will be a rebound from the descending channel’s upside border. However, the bearish scenario may no longer be valid if the price breaks the cloud’s upside border and fixes above 1815.00. In this case, the pair may continue growing towards 1845.00.

XAUUSD
Risk Warning: the result of previous trading operations do not guarantee the same results in the future

CADJPY, “Canadian Dollar vs Japanese Yen”

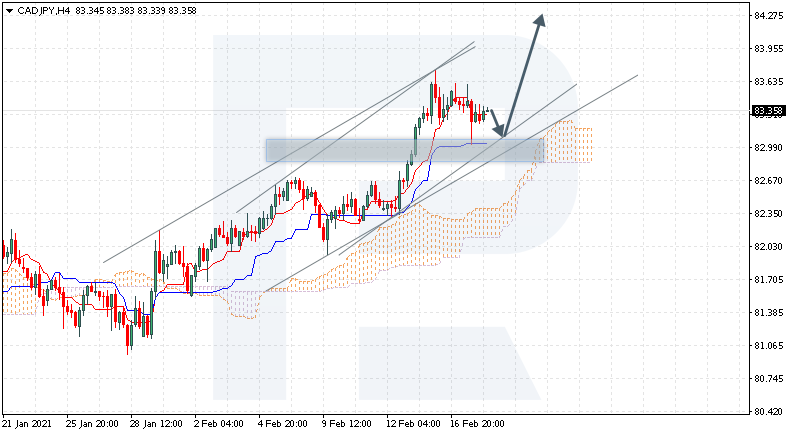
CADJPY is trading at 83.35; the instrument is moving above Ichimoku Cloud, thus indicating an ascending tendency. The markets could indicate that the price may test Tenkan-Sen and Kijun-Sen at 83.05 and then resume moving upwards to reach 84.35. Another signal in favor of a further uptrend will be a rebound from the rising channel’s downside border. However, the bullish scenario may no longer be valid if the price breaks the cloud’s downside border and fixes below 81.95. In this case, the pair may continue falling towards 81.05.

CADJPY
Risk Warning: the result of previous trading operations do not guarantee the same results in the future

rfxsignals February 18, 2021 No Comments

Fibonacci Retracements Analysis 18.02.2021 (AUDUSD, USDCAD)

Fibonacci Retracements Analysis 18.02.2021 (AUDUSD, USDCAD)

18.02.2021

AUDUSD, “Australian Dollar vs US Dollar”

As we can see in the H4 chart, after falling and reaching 23.6% fibo, AUDUSD has formed a new rising impulse towards the high at 0.7820. If the pair breaks the high, it may continue growing to reach the post-correctional extension area between 138.2% and 161.8% fibo at 0.7918 and 0.7978 respectively. However, if the asset rebounds from the high, it may resume falling and expand the correctional range. The correctional targets may be at 38.2% and 50.0% fibo at 0.7503 and 0.7406 respectively.

AUDUSD_H4
Risk Warning: the result of previous trading operations do not guarantee the same results in the future

The H1 chart shows that a local divergence on MACD made the pair start a new correctional downtrend, which, after breaking 23.6% fibo, has failed to reach 38.2% fibo at 0.7713. The next rising wave may be heading to break the local and key highs at 0.7805 and 0.7820 respectively. However, considering the direction of the MACD lines, the market may yet form another descending wave to reach z8.2% and 50.0% fibo at 0.7713 and 0.7684 respectively.

AUDUSD_H1
Risk Warning: the result of previous trading operations do not guarantee the same results in the future

USDCAD, “US Dollar vs Canadian Dollar”

As we can see in the H4 chart, USDCAD is falling again to test the low at 1.2589. Considering a divergence on MACD, the pair may rebound and start a new rising impulse towards 23.6%, 38.2%, and 50.0% fibo at 1.3979, 1.3382, and 1.3628 respectively. On the other hand, the asset may yet continue falling to reach the fractal support at 1.2061.

USDCAD_H4
Risk Warning: the result of previous trading operations do not guarantee the same results in the future

The H1 chart shows that the descending wave has reached 50.0% fibo after a convergence on MACD. Later, the market may continue growing towards 61.8% and 76.0% fibo at 1.2778 and 1.2816 respectively. However, the key target is the local high at 1.2881. The support is the low at 1.2610.

USDCAD_H1
Risk Warning: the result of previous trading operations do not guarantee the same results in the future

rfxsignals February 18, 2021 No Comments

Daily Free Forex Signals For 18/02/2021

Here your going to see Daily Free Forex Signals For 18/02/2021 to free forex signal alert from our kitkat trading system and other trading logic’s .we provide like this free forex signals from 2012 on wards with more than 50,000 traders around the world .The free forex signals have 70 to 85% quality always .we give for you a note as maximum focus take profit 1 as your target and must use stop loss values .if you have any other query’s please visit our live chat or email option

EURUSD BUY -1.20725
SL-1.20328
TP1-1.20952
TP2-1.21185

GBPUSD BUY -1.39147
SL-1.38739
TP1-1.39354
TP2-1.39635

USDCAD SELL-1.26833
SL-1.27134
TP1-1.26624
TP2-1.26347

USDCHF SELL-0.89663
SL-0.89957
TP1-0.89467
TP2-0.89237

GBPJPY BUY -147.180
SL-146.614
TP1-147.390
TP2-147.595

EURAUD SELL-1.55093
SL-1.55496
TP1-1.54850
TP2-1.54605

EURGBP SELL-0.86672
SL-0.87041
TP1-0.86469
TP2-0.86249

AUDNZD SELL-1.07827
SL-1.08240
TP1-1.07583
TP2-1.07335

GBPCAD BUY -1.76684
SL-1.76265
TP1-1.76904
TP2-1.77125

GBPAUD BUY-1.78988
SL-1.78620
TP1-1.79105
TP2-1.79270

EURCAD BUY -1.53196
SL-1.52798
TP1-1.53429
TP2-1.53641

rfxsignals February 17, 2021 No Comments

Forex Technical Analysis & Forecast 17.02.2021

Forex Technical Analysis & Forecast 17.02.2021

17.02.2021

EURUSD, “Euro vs US Dollar”

After finishing the ascending structure at 1.2168 and then forming a new consolidation range within a Triangle pattern, EURUSD has rebounded from its upside border to reach 1.2100; right now, it is forming another consolidation range around the latter level. Today, the pair may fall towards 1.2077 and form one more ascending structure to test 1.2100 from below. Later, the market may resume falling with the target at 1.2040.

EURUSD
Risk Warning: the result of previous trading operations do not guarantee the same results in the future

GBPUSD, “Great Britain Pound vs US Dollar”

GBPUSD is still consolidating around 1.3900. Possibly, today the pair may fall towards 1.3850 and then grow to reach 1.3900. If later the price breaks this range to the downside, the market may form a new descending structure towards 1.3770; if to the upside – start another growth with the target at 1.3980.

GBPUSD
Risk Warning: the result of previous trading operations do not guarantee the same results in the future

USDRUB, “US Dollar vs Russian Ruble”

USDRUB is consolidating around 73.33; it has already expanded the range up to 73.90. Possibly, the pair may continue trading downwards to reach 72.90 and then grow to test 73.30 from below. After that, the instrument may start another decline with the target at 72.50.

USDRUB
Risk Warning: the result of previous trading operations do not guarantee the same results in the future

USDJPY, “US Dollar vs Japanese Yen”

After finishing the ascending wave at 106.21, USDJPY is falling towards 105.75, thus forming a new consolidation range at the top. Later, the market may break the range to the downside and continue trading downwards with the first target at 105.20.

USDJPY
Risk Warning: the result of previous trading operations do not guarantee the same results in the future

USDCHF, “US Dollar vs Swiss Franc”

After finishing the descending wave at 0.8870, USDCHF has completed the ascending impulse towards 0.8926; right now, it is consolidating around the latter level. Possibly, the pair may expand the range up to 0.8945 and then fall to return to 0.8926. After that, the instrument may resume trading upwards with the first target at 0.8988.

USDCHF
Risk Warning: the result of previous trading operations do not guarantee the same results in the future

AUDUSD, “Australian Dollar vs US Dollar”

AUDUSD has formed another consolidation range around 0.7760. Possibly, today the pair may resume trading upwards to reach 0.7810 and then start a new decline with the target at 0.7679.

AUDUSD
Risk Warning: the result of previous trading operations do not guarantee the same results in the future

BRENT

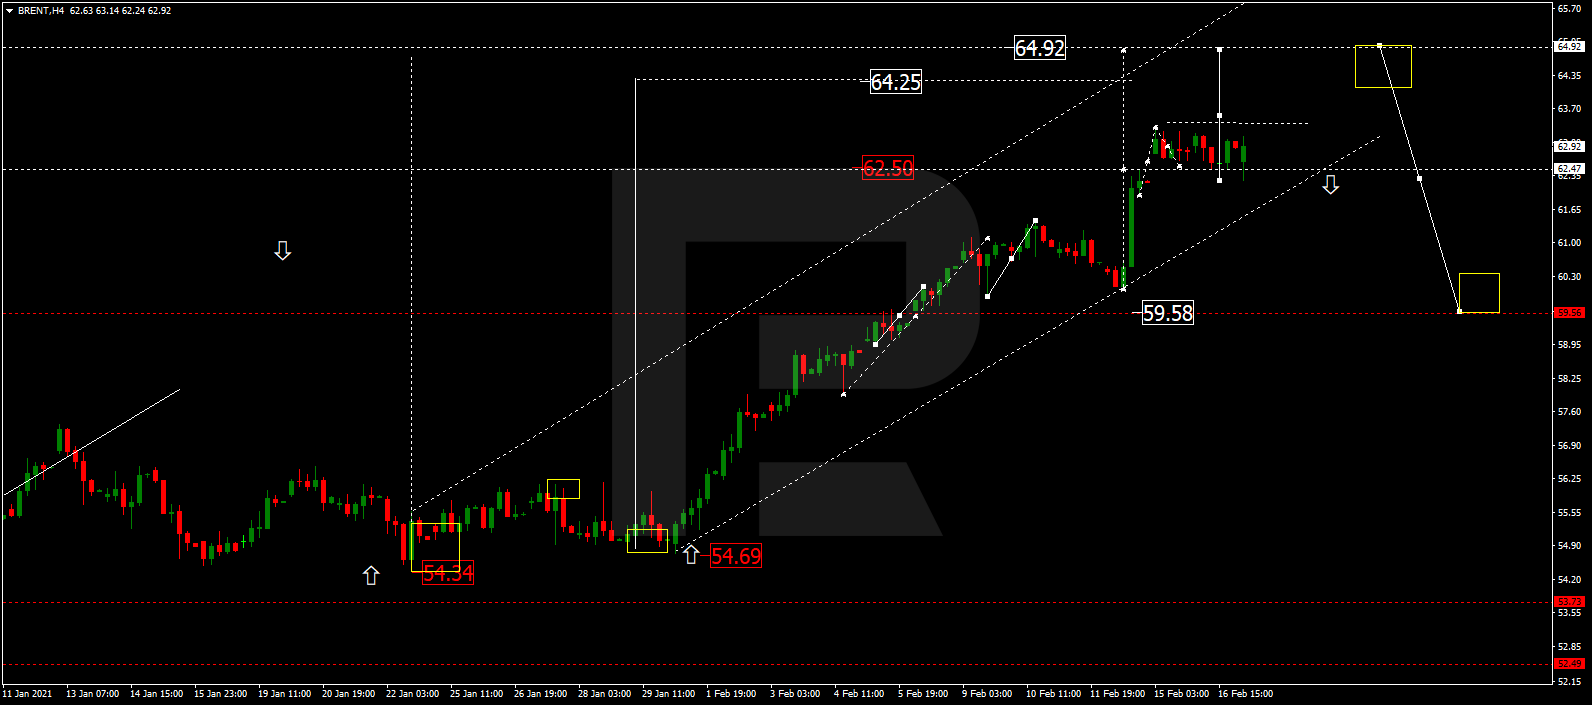
Brent is still consolidating above 62.50. Possibly, the asset may break the range to the upside and form one more ascending structure to reach 64.90. After that, the instrument may start a new correction with the target at 62.50.
BRENT
Risk Warning: the result of previous trading operations do not guarantee the same results in the future

XAUUSD, “Gold vs US Dollar”

After breaking its consolidation range to the downside and reaching 1792.43, Gold has returned to 1814.00 to test it from below; right now, it is forming a new descending structure towards 1772.52. After that, the instrument may start another correction with the target at 1820.00.

GOLD
Risk Warning: the result of previous trading operations do not guarantee the same results in the future

BTCUSD, “Bitcoin vs US Dollar”

BTCUSD has completed the first descending impulse at 47700.00 along with the correction towards 50000.00, thus forming a new consolidation range. If later the price breaks this range to the downside, the market may correct with the short-term target at 44600.00.

BITCOIN
Risk Warning: the result of previous trading operations do not guarantee the same results in the future

S&P 500

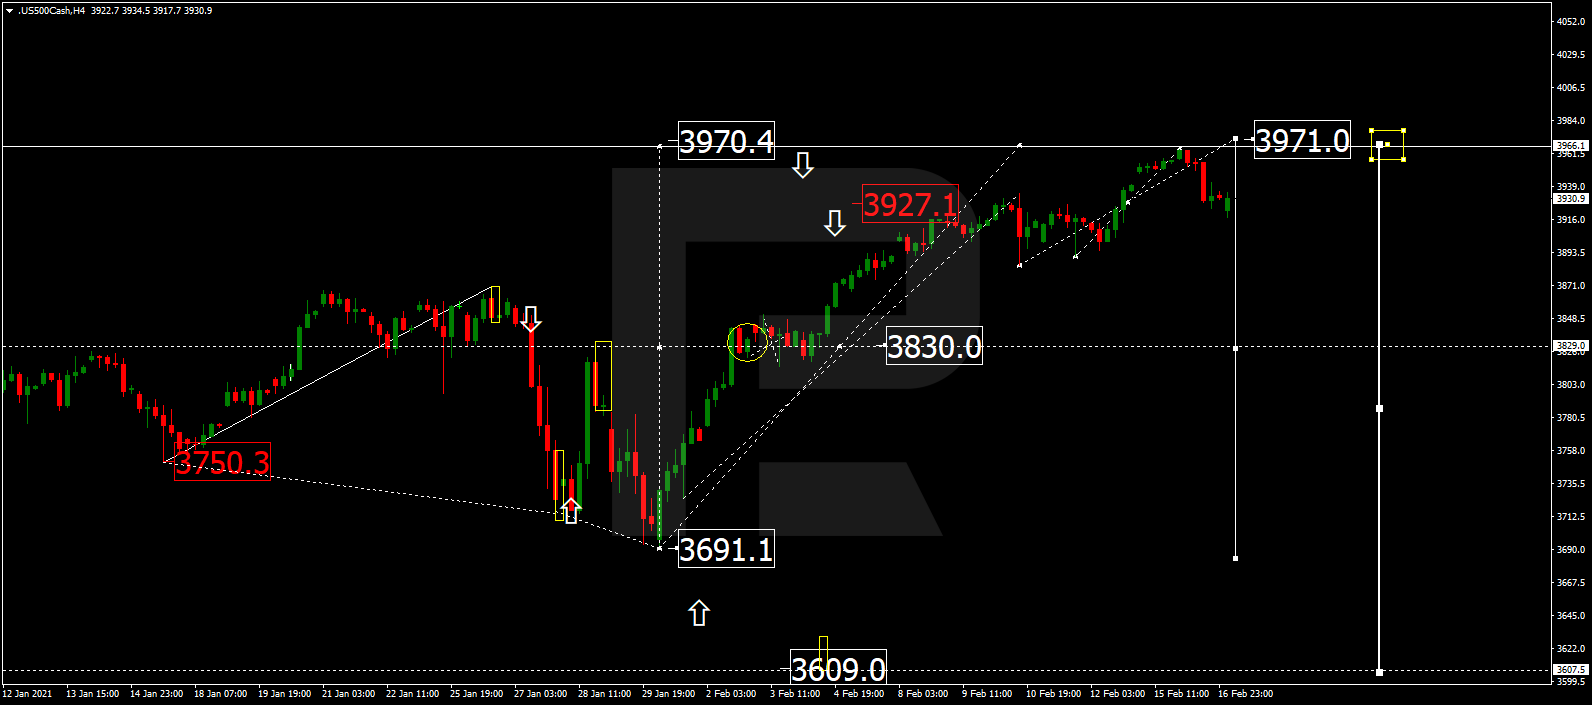
The S&P index is still consolidating around 3927.1. Today, the asset may grow to reach 3971.0 and then break the range to the downside to reach 3829.0. After that, the instrument may break the latter level as well and continue falling with the target at 3609.0.
S&P 500
Risk Warning: the result of previous trading operations do not guarantee the same results in the future

rfxsignals February 17, 2021 No Comments

The Euro lost to the USD. Overview for 17.02.2021

The Euro lost to the USD. Overview for 17.02.2021

17.02.2021

EURUSD fell on Wednesday; the “greenback” is feeling confident again.

The major currency pair was looking pretty stable but the market sentiment quickly changed. The current quote for the instrument is 1.2065.

Nothing terrible has happened but market players are once again paying attention to what is happening in Germany and analyzing everything that has something to do with the largest economy in Europe. Yesterday, Peter Altmaier, the German Minister for Economic Affairs and Energy said that the country’s economy would prosper and flourish if there was the third wave of the coronavirus pandemic. He sounded quite logical: it’s no use canceling the quarantine restrictions because this act may result in a new wave of the disease. Altmaier also said that the government was well aware that the German businesses badly needed the lockdown to be canceled but would be very careful with it.

In the nearest future, German authorities are going to consider more measures to help national companies, for example, they have already let the companies with annual sales of over €750K apply for grants. Earlier, there was a restriction that didn’t allow such big companies to receive grants from the government.

The fact that Germany is removing the quarantine restrictions very slowly is putting pressure on the country’s economy, as well as the Euro.

The Euro Area GDP report turned out to be better than expected: it showed -0.6% q/q against the expected reading of -0.7% q/q, although it didn’t make investors more optimistic – the indicator remained negative.

Today, market players will focus their attention on the Retail Sales data for January from the USA and everything that is related to it. Forecasts are pretty optimistic and may support the “greenback”.

rfxsignals February 17, 2021 No Comments

The Pound is correcting. Overview for 17.02.2021

The Pound is correcting. Overview for 17.02.2021

17.02.2021

After updating its highs, GBPUSD is falling despite some positive statistics.

On Wednesday afternoon, the British Pound is retreating against the USD after rallying the day before. The current quote for the instrument is 1.3881.

Update of the previous high required a quick correction and that’s what is exactly happening in GBDUSD right now.

In the meantime, the United Kingdom has published a lot of interesting numbers that can’t go unnoticed. For example, the CPI showed 0.7% y/y in January against the expected reading of 0.6% y/y. The Core CPI showed 1.4% y/y after being 1.2% y/y the month before.

The Bank of England was absolutely right when decided just to watch and wait for the indicator to balance by itself – this stance always paid off.

The PPI Input was 0.7% m/m in January after being 0.8% m/m in December. The PPI Output added 0.4% m/m after expanding by 0.3% m/m in the previous month.

In general, the statistics are quite positive: the price pressure in the United Kingdom is slowly rising, which means that the Bank of England may continue monitoring the economic situation in the country without making any abrupt moves.

rfxsignals February 16, 2021 No Comments

Forex Technical Analysis & Forecast 16.02.2021

Forex Technical Analysis & Forecast 16.02.2021

16.02.2021

EURUSD, “Euro vs US Dollar”

After finishing the correction at 1.2125 along with another ascending structure towards 1.2148, EURUSD is expected to start a new correction to reach 1.2130. Later, the market may form one more ascending structure towards 1.2172 and then resume falling with the target at 1.2040.

EURUSD
Risk Warning: the result of previous trading operations do not guarantee the same results in the future

GBPUSD, “Great Britain Pound vs US Dollar”

After completing the ascending structure at 1.3895 and then forming a new consolidation range above this level, GBPUSD has broken it to the upside to reach 1.3950. After that, the instrument may correct towards 1.3920 and then start another growth with the target at 1.3969.

GBPUSD
Risk Warning: the result of previous trading operations do not guarantee the same results in the future

USDRUB, “US Dollar vs Russian Ruble”

After finishing the descending structure at 73.33, USDRUB is consolidating around it. Possibly, the pair may continue trading downwards with the target at 72.52.

USDRUB
Risk Warning: the result of previous trading operations do not guarantee the same results in the future

USDJPY, “US Dollar vs Japanese Yen”

After finishing the ascending wave at 105.30 and then forming a new consolidation range around this level, USDJPY has broken it to the upside and may later continue growing to reach 105.74. After that, the instrument may correct to return to 105.30 and then resume trading upwards with the target at 106.20.

USDJPY
Risk Warning: the result of previous trading operations do not guarantee the same results in the future

USDCHF, “US Dollar vs Swiss Franc”

USDCHF has completed the descending wave at 0.8889. Possibly, today the pair may correct to test 0.8907 from below and then resume trading downwards with the target at 0.8870.

USDCHF
Risk Warning: the result of previous trading operations do not guarantee the same results in the future

AUDUSD, “Australian Dollar vs US Dollar”

AUDUSD has formed another consolidation range around 0.7780; right now, it is moving to break it to the upside. Possibly, the pair may resume trading upwards with the target at 0.7846.

AUDUSD
Risk Warning: the result of previous trading operations do not guarantee the same results in the future

BRENT

Brent is still consolidating above 62.50. Possibly, the asset may break the range to the upside and form one more ascending structure to reach 64.90. After that, the instrument may start a new correction with the target at 62.50.

BRENT
Risk Warning: the result of previous trading operations do not guarantee the same results in the future

XAUUSD, “Gold vs US Dollar”

Gold is still consolidating around 1822.00. Today, the metal may start another growth to reach 1833.66 and then form a new descending structure with the target at 1803.70.

GOLD
Risk Warning: the result of previous trading operations do not guarantee the same results in the future

BTCUSD, “Bitcoin vs US Dollar”

BTCUSD is forming a wide consolidation range around 47400.00; it has already expanded it down and up to 46000.00 and 49800.00 respectively. Possibly, the asset may grow to reach 50500.00 and then form a new descending structure towards 44400.00. If later the price breaks this range to the downside, the market may correct with the target at 38800.00.

BITCOIN
Risk Warning: the result of previous trading operations do not guarantee the same results in the future

S&P 500

The S&P index is still moving upwards and may later extend this wave up to 3971.0. After that, the instrument may consolidate there. If the price breaks the range to the downside, the market may start a new decline with the target at 3700.0.

S&P 500
Risk Warning: the result of previous trading operations do not guarantee the same results in the future

rfxsignals February 16, 2021 No Comments

Murrey Math Lines 16.02.2021 (AUDUSD, NZDUSD)

Murrey Math Lines 16.02.2021 (AUDUSD, NZDUSD)

16.02.2021

AUDUSD, “Australian Dollar vs US Dollar”

As we can see in the H4 chart, AUDUSD is approaching the “overbought area”. In this case, the price is expected to test 8/8, rebound from it, and then correct downwards to reach the support at 5/8. However, this scenario may be canceled if the price breaks 8/8 to the upside. After that, the instrument may grow towards the resistance at +1/8.

AUDUSD_H4
Risk Warning: the result of previous trading operations do not guarantee the same results in the future

In the M15 chart, the pair may break the downside line of the VoltyChannel indicator and, as a result, continue trading downwards.

AUDUSD_M15
Risk Warning: the result of previous trading operations do not guarantee the same results in the future

NZDUSD, “New Zealand Dollar vs US Dollar”

In the H4 chart, NZDUSD is trading above the 200-day Moving Average, thus indicating an ascending tendency. downwards. In this case, the price is expected to break 6/8 and then continue growing towards the resistance at 8/8. However, this scenario may no longer be valid if the price breaks 5/8 to the downside. In this case, the instrument may continue falling to reach the support at 4/8.

NZDUSD_H4
Risk Warning: the result of previous trading operations do not guarantee the same results in the future

As we can see in the M15 chart, the price has broken the upside line of the VoltyChannel indicator and, as a result, may continue growing.

NZDUSD_M15
Risk Warning: the result of previous trading operations do not guarantee the same results in the future

rfxsignals February 16, 2021 No Comments

Japanese Candlesticks Analysis 16.02.2021 (EURUSD, USDJPY, EURGBP)

Japanese Candlesticks Analysis 16.02.2021 (EURUSD, USDJPY, EURGBP)

16.02.2021

EURUSD, “Euro vs. US Dollar”

As we can see in the H4 chart, the ascending tendency continues. Right now, EURUSD is testing the resistance area where it has formed several reversal patterns, including Engulfing. Possibly, the asset may continue moving upwards. In this case, the upside target may be at 1.2250. However, an alternative scenario implies that the price may correct to reach 1.2085 before testing 1.2250.

EURUSD
Risk Warning: the result of previous trading operations do not guarantee the same results in the future

USDJPY, “US Dollar vs. Japanese Yen”

As we can see in the H4 chart, USDJPY has formed a Shooting Star reversal pattern while testing the resistance level. Judging by the previous movements, one may assume that the asset may reverse and start a new pullback. In this case, the correctional target is the support area at 105.05. At the same time, an opposite scenario implies that the price may continue its growth to reach 106.00 without reversing and correcting.

USDJPY
Risk Warning: the result of previous trading operations do not guarantee the same results in the future

EURGBP, “Euro vs. Great Britain Pound”

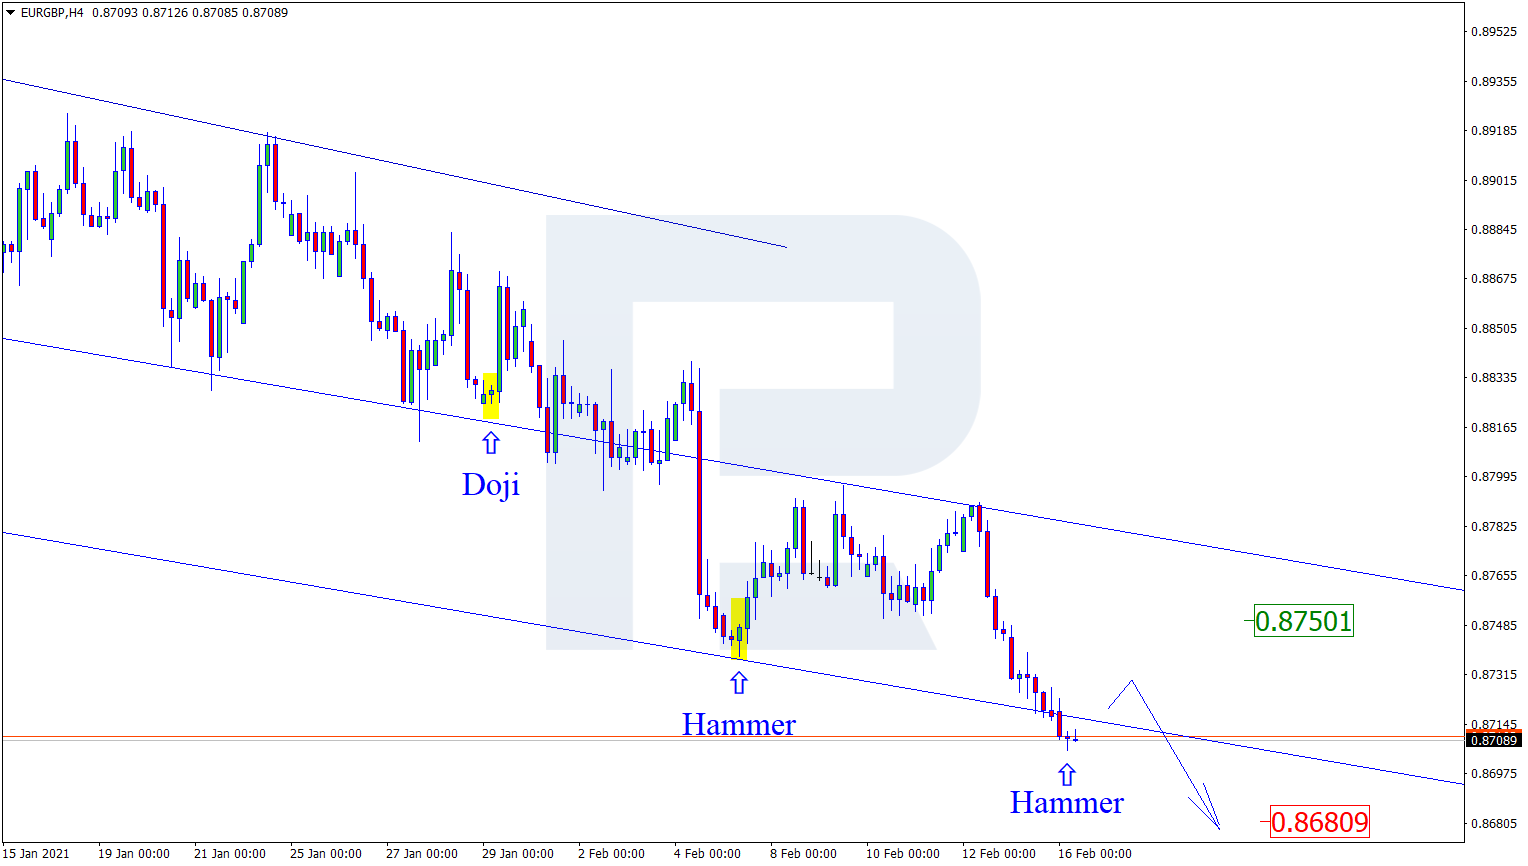
As we can see in the H4 chart, after forming a Hammer reversal pattern not far from another support level, EURGBP may reverse and form a new pullback. In this case, the upside target is the resistance area at 0.8750. However, judging by previous movements, the pair may yet continue its decline to reach 0.8680 without correcting towards the resistance area.

EURGBP
Risk Warning: the result of previous trading operations do not guarantee the same results in the future