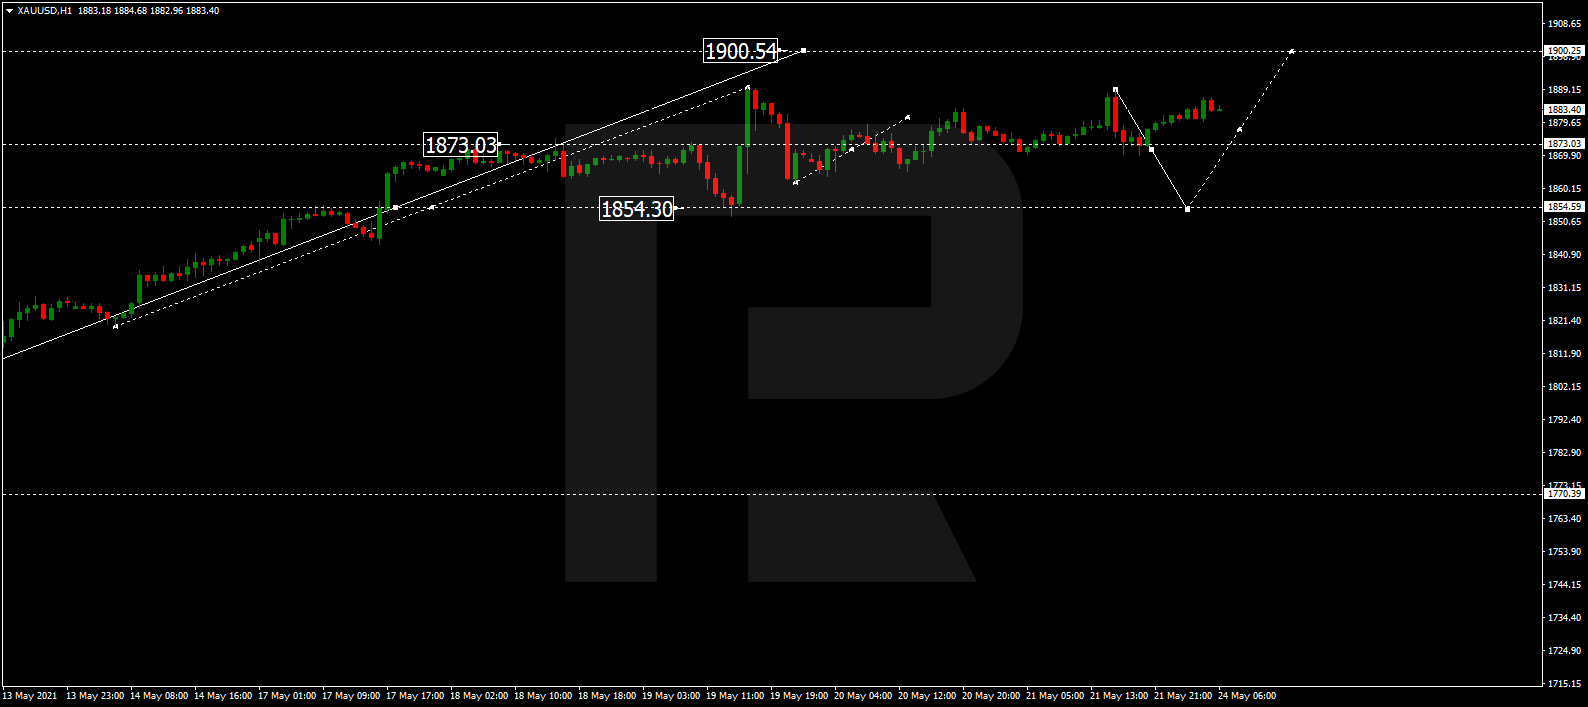
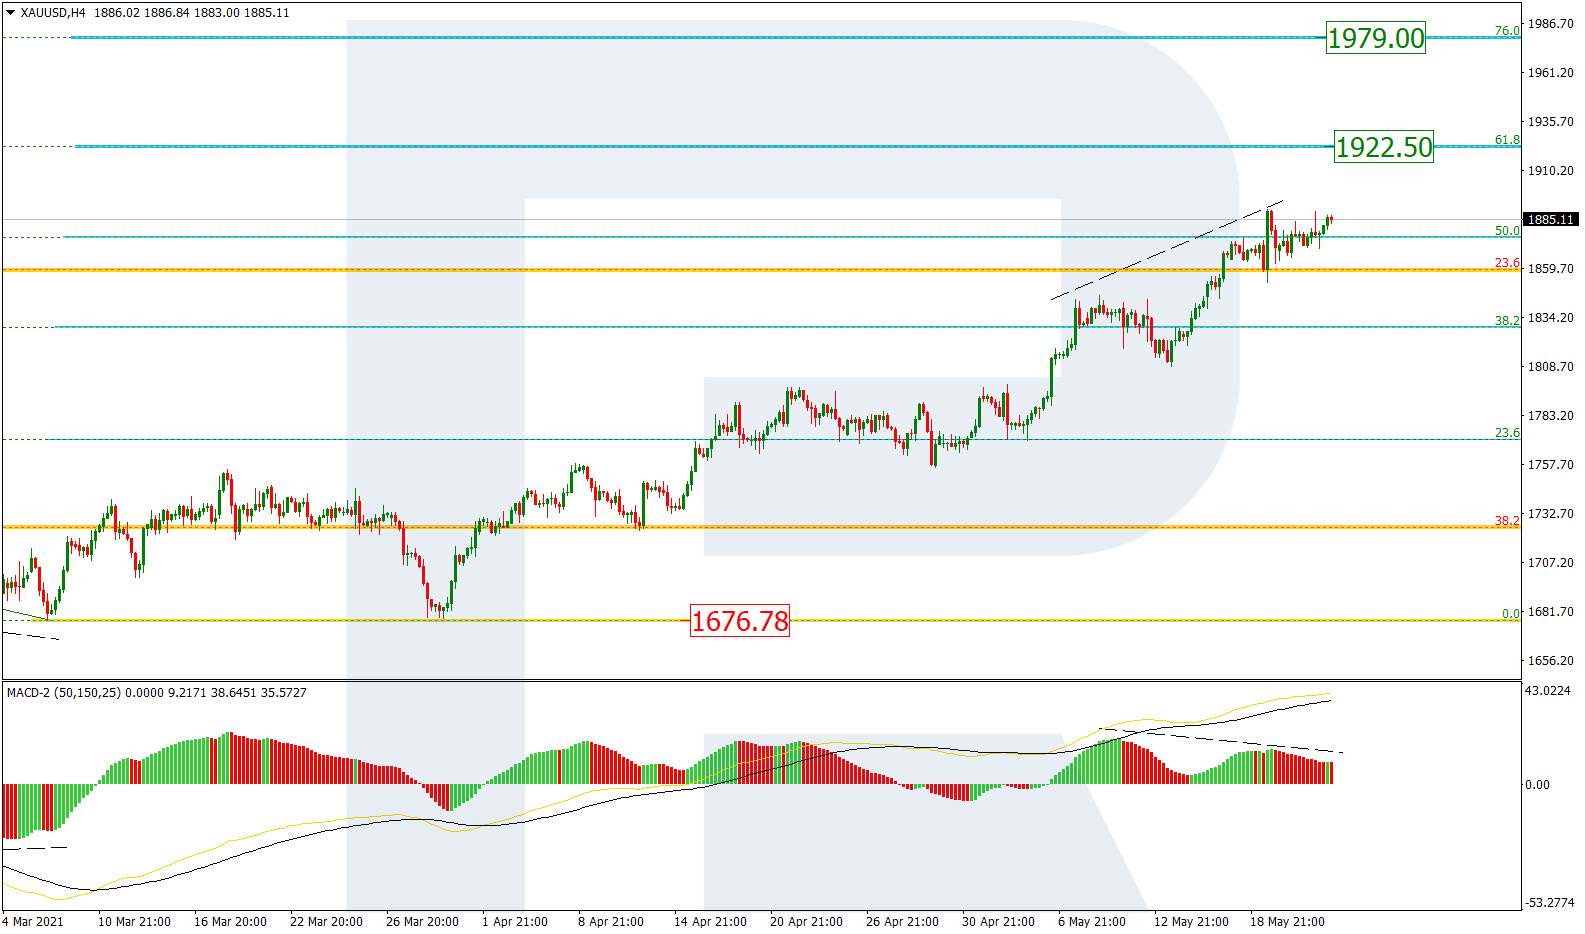
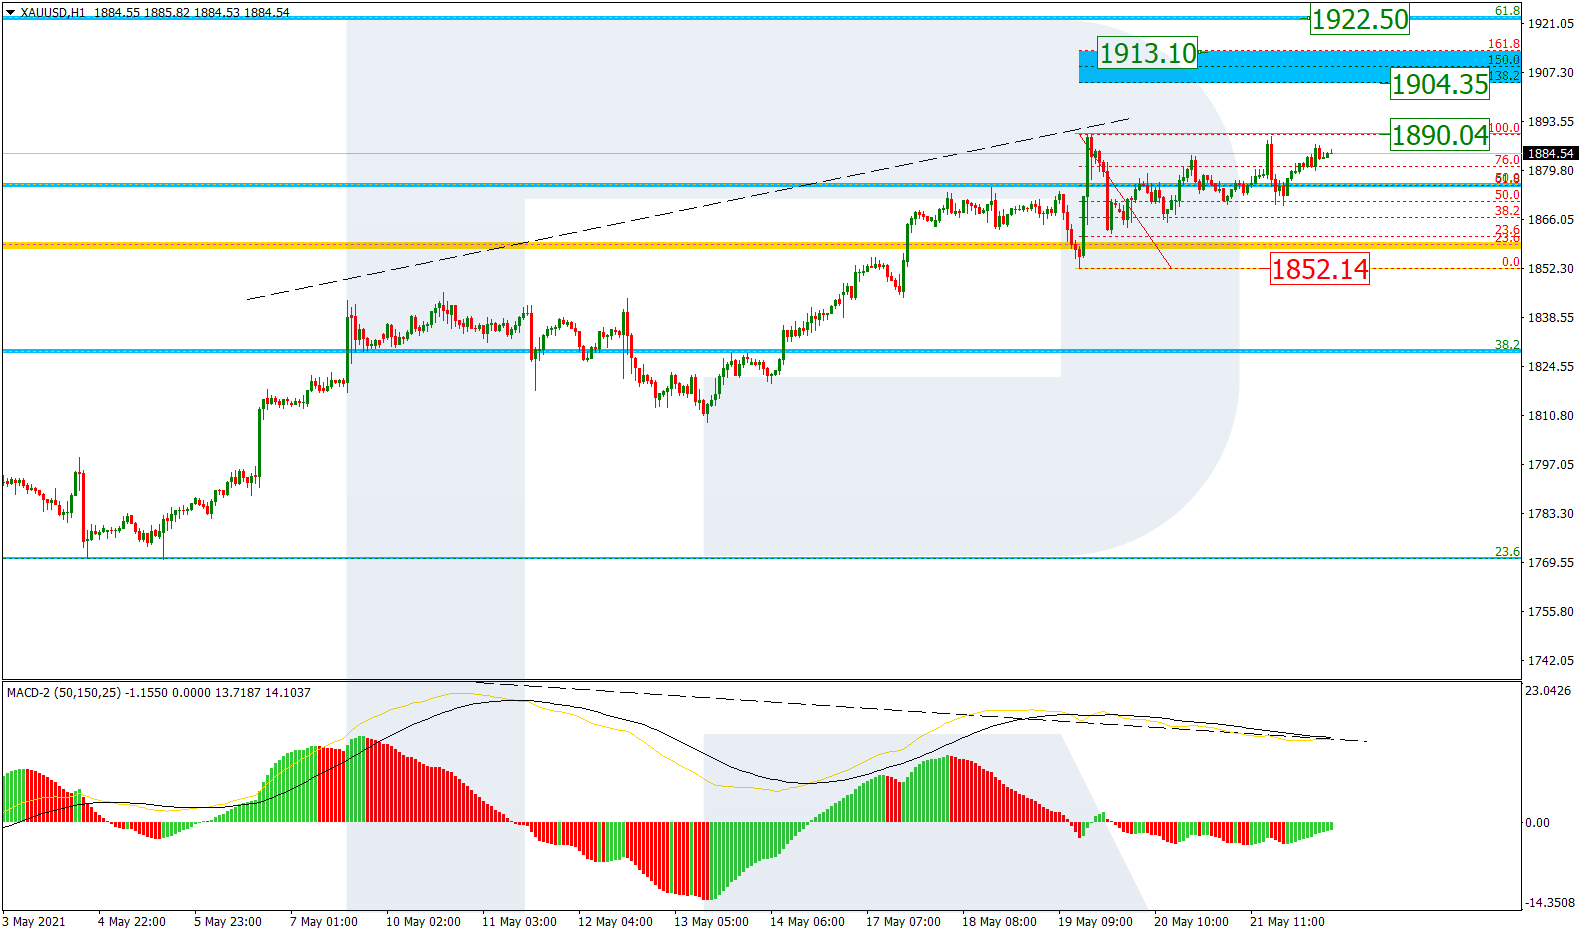
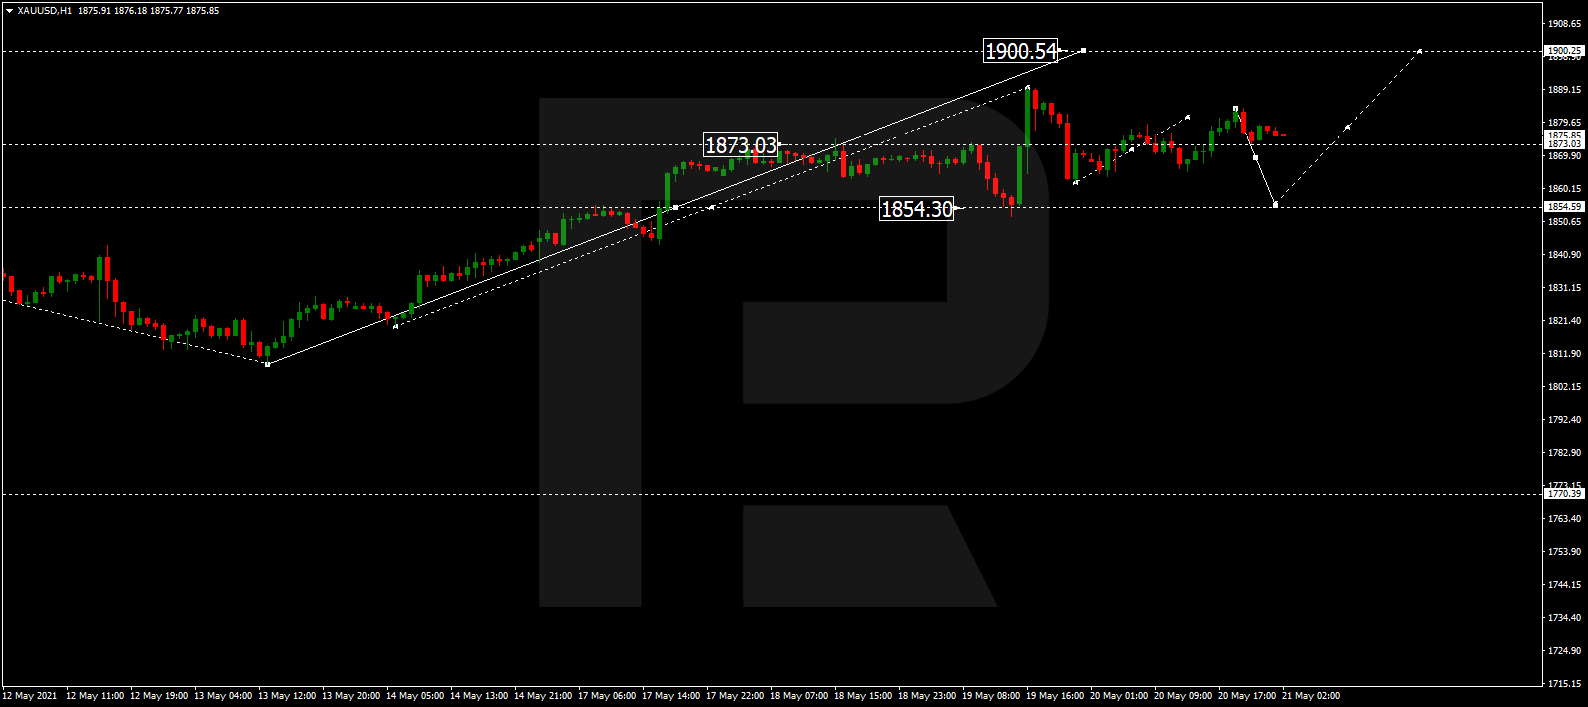
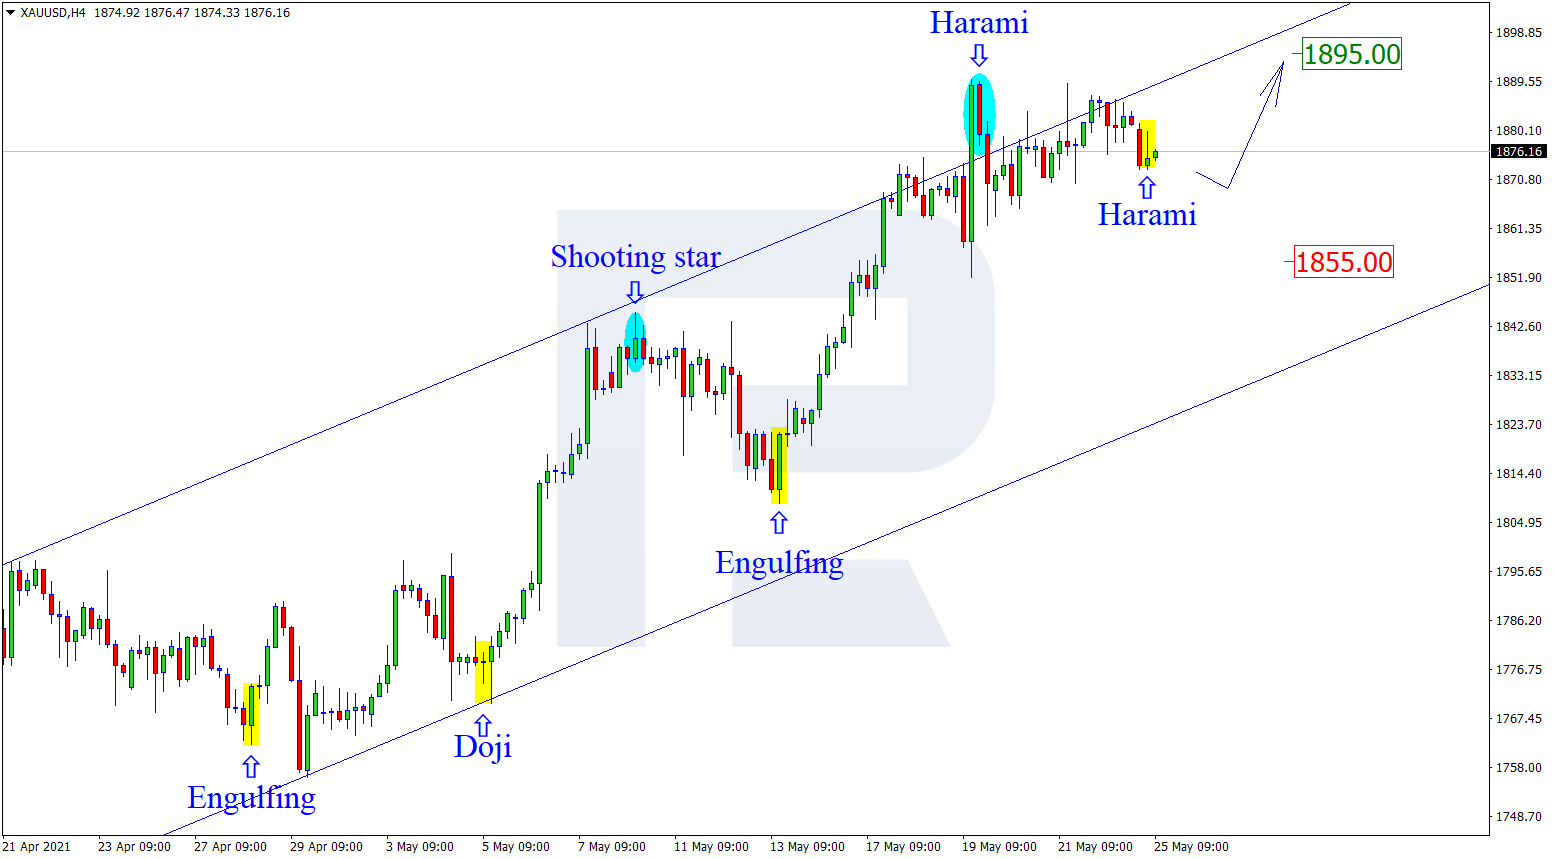
XAUUSD, “Gold vs US Dollar”
As we can see in the H4 chart, the instrument continues growing. After forming several reversal patterns, such as Harami, close to the support level during the pullback, XAUUSD is reversing and may later continue trading upwards to reach the resistance area at 1895.00. At the same time, an opposite scenario implies that the price may continue the pullback to reach 1855.00 before resuming its growth.

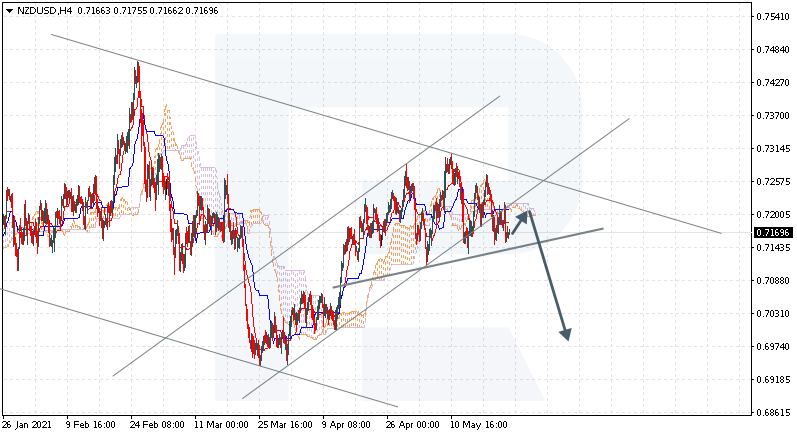
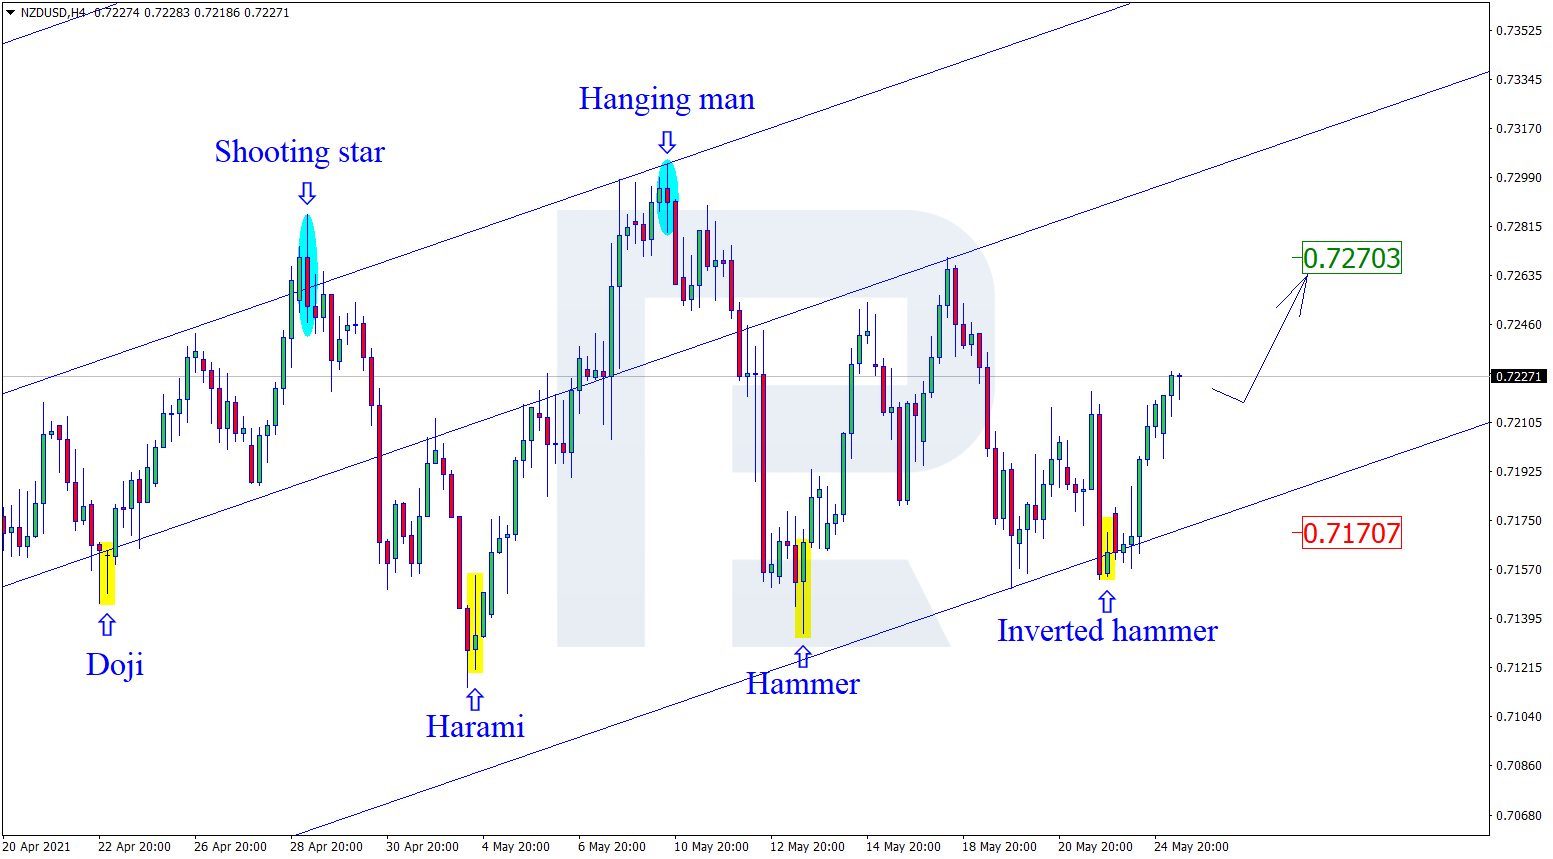
NZDUSD, “New Zealand vs US Dollar”
As we can see in the H4 chart, the ascending impulse continues. By now, NZDUSD has formed several reversal patterns, such as Inverted Hammer, close to the support level. The pattern materialization target may be the resistance area at 0.7270. Later, the price may test the area, break it, and continue moving upwards. However, an alternative scenario implies that the price may return to 0.7170 before resuming its ascending tendency.
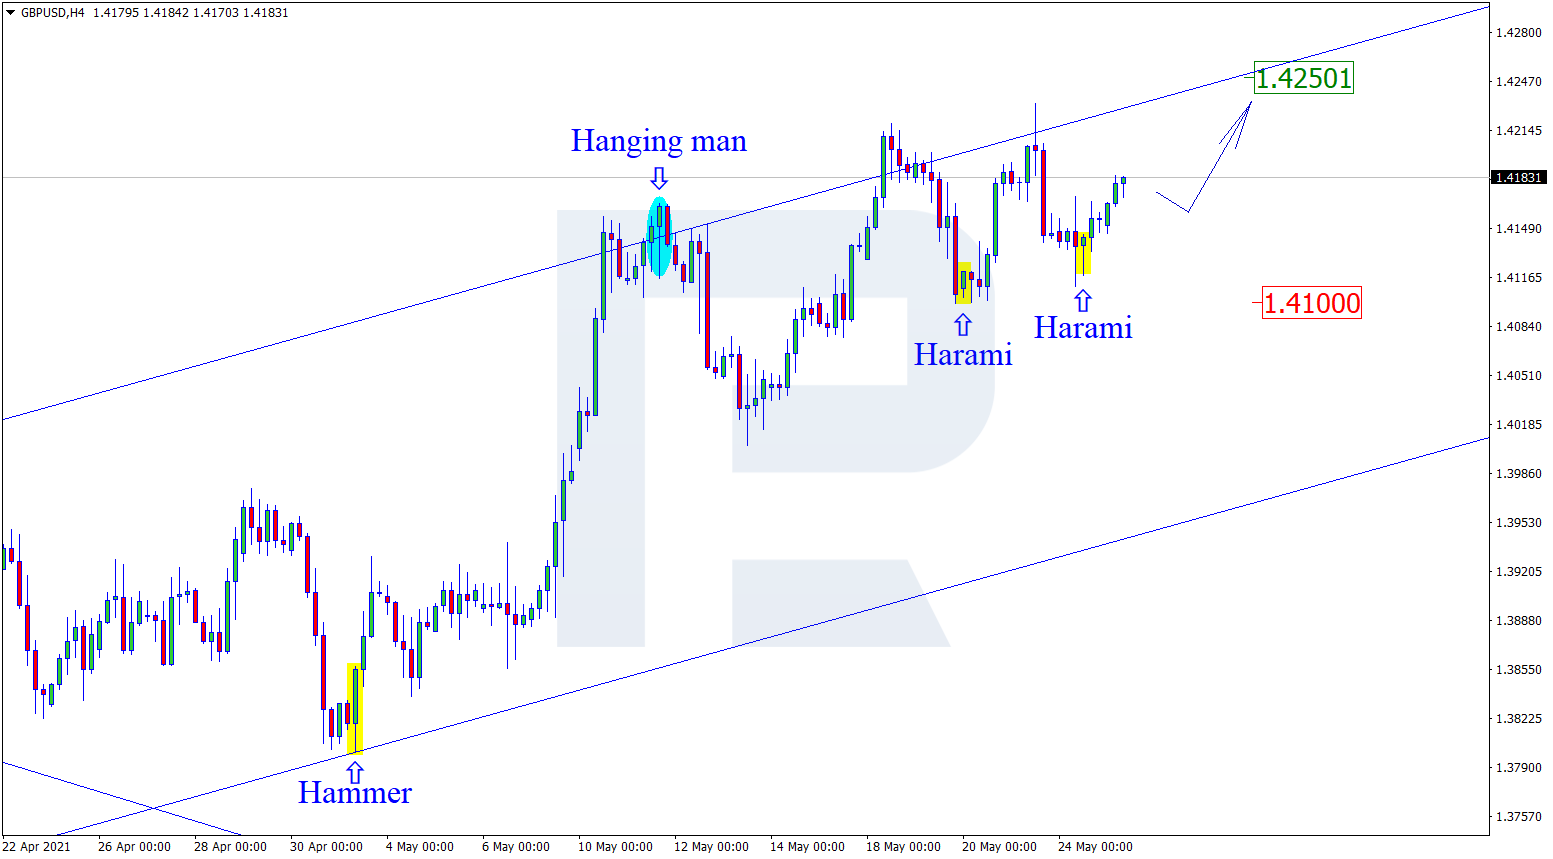
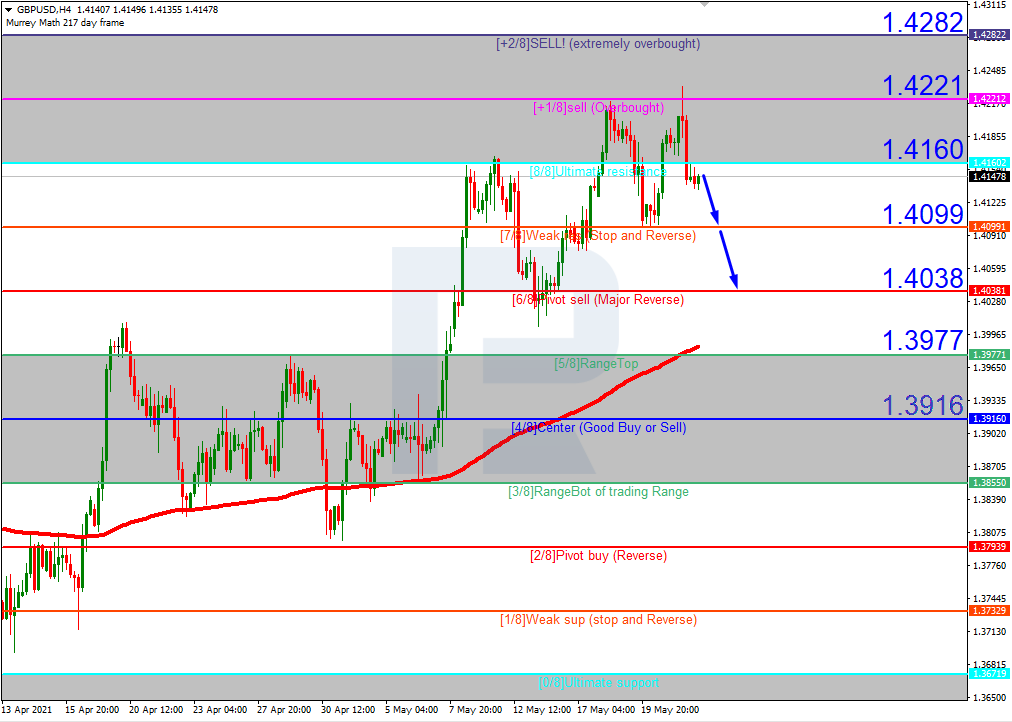
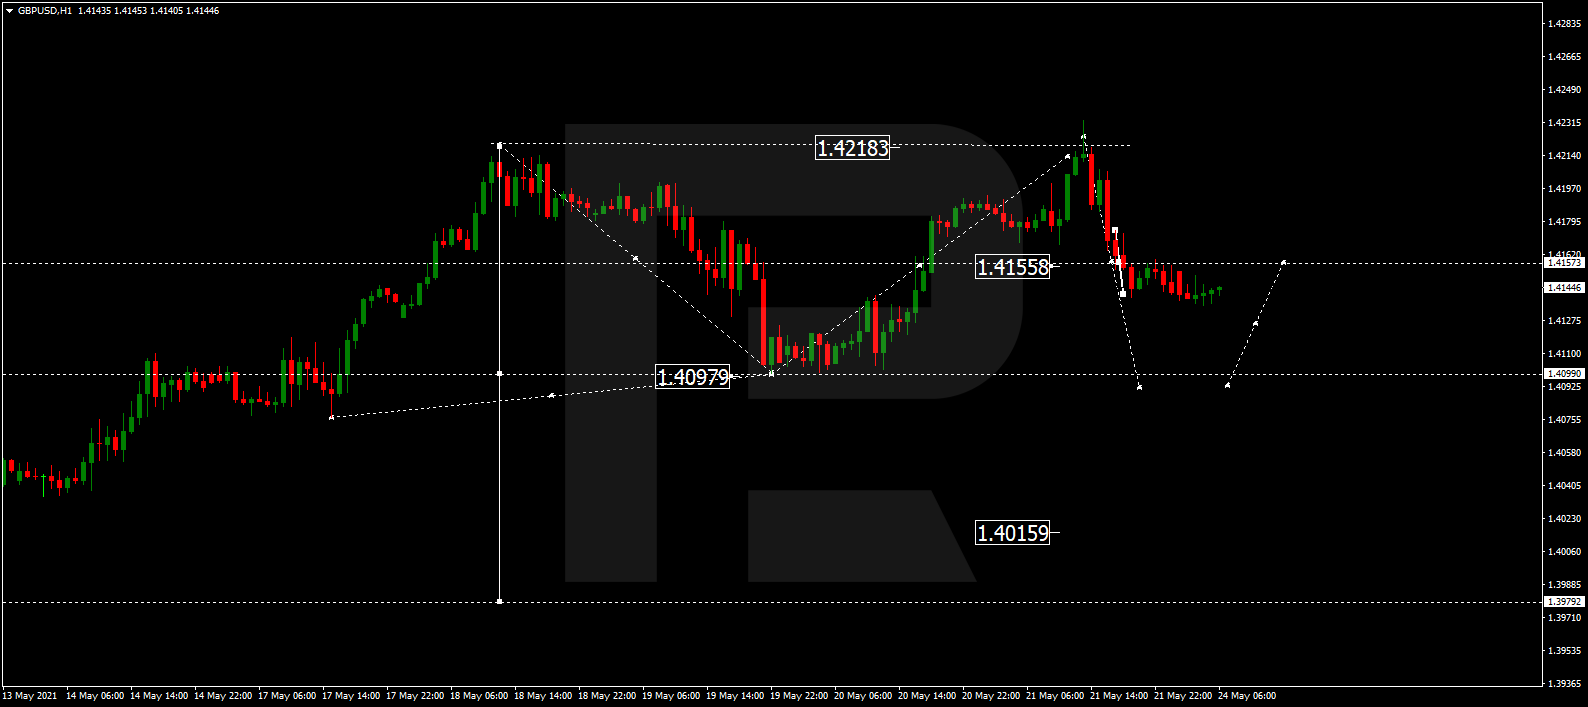
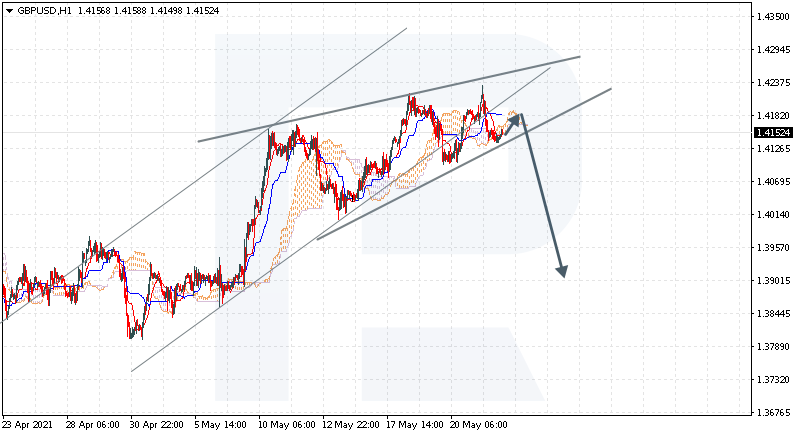
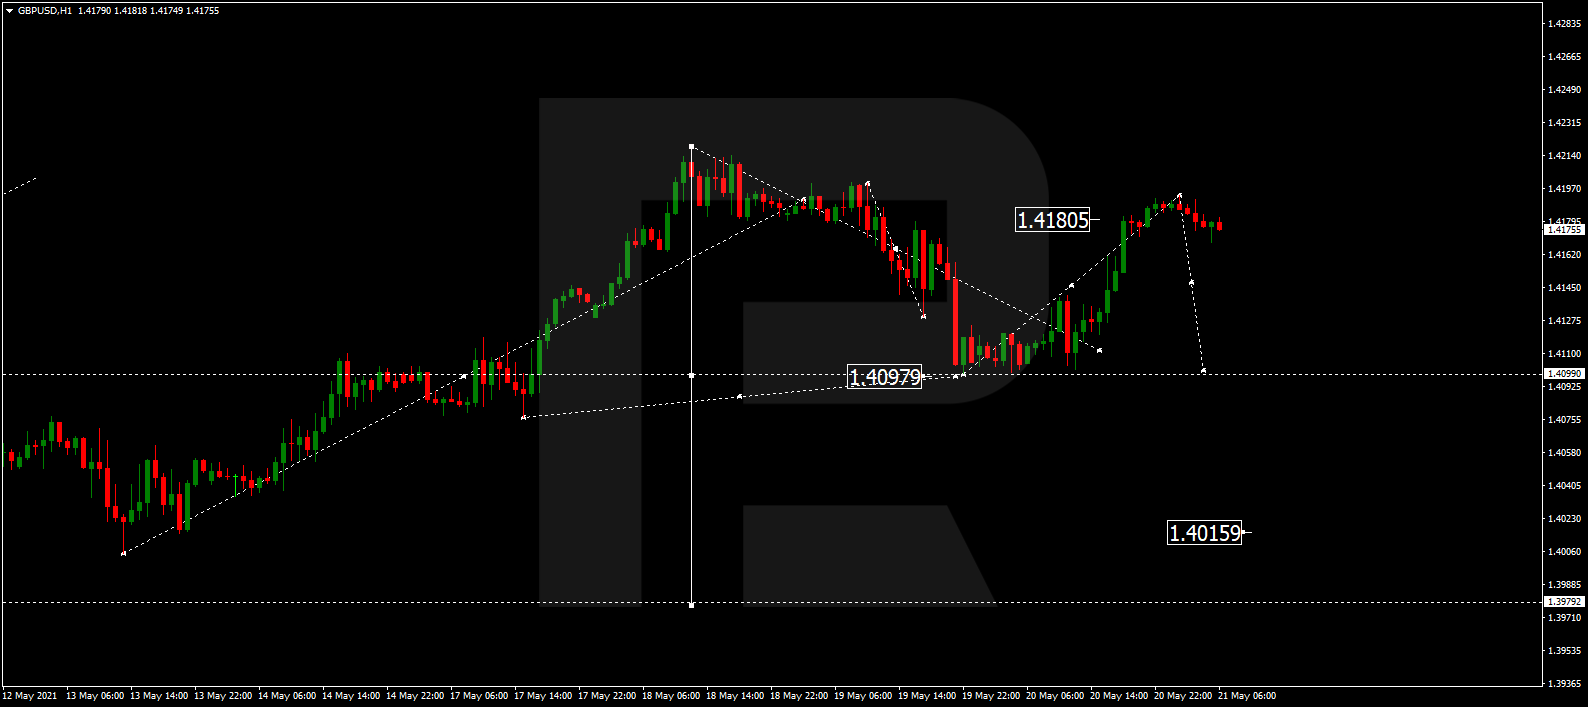
GBPUSD, “Great Britain Pound vs US Dollar”
As we can see in the H4 chart, the uptrend continues. By now, GBPUSD has formed several reversal patterns, such as Harami, not far from the support area. At the moment, the pair may reverse in favor of further growth. In this case, the next upside target after the pullback may be at 1.4250. Later, the instrument may break the resistance level and boost its ascending tendency. Still, there might be an alternative scenario, according to which the asset may correct towards 1.4100 before resuming the ascending tendency.