EURUSD, “Euro vs US Dollar”
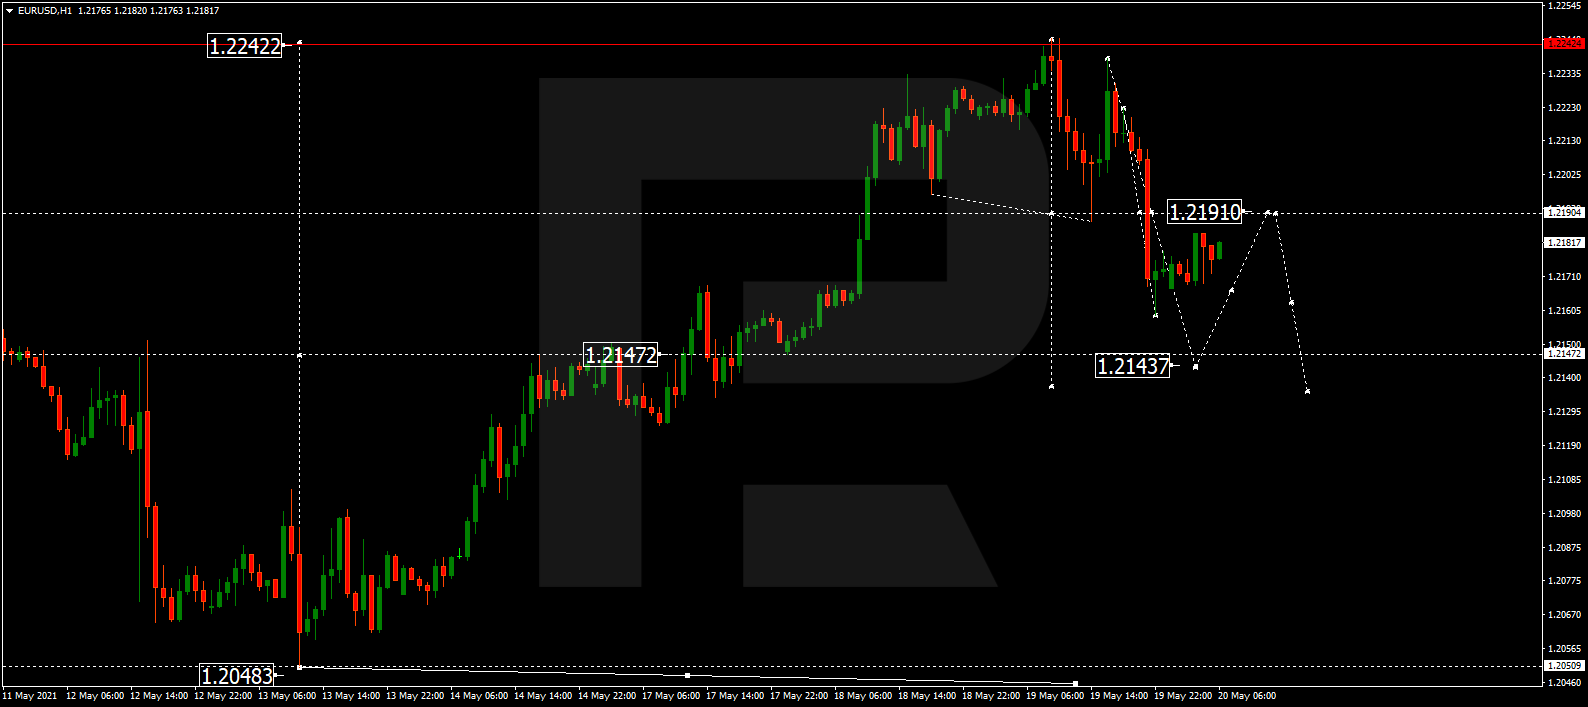
After completing the ascending wave at 1.2242 and forming a new consolidation range around 1.2191, EURUSD has broken it to the downside. Possibly, the pair may start another decline with the short-term target at 1.2143 and then correct to return to 1.2191. After that, the instrument may resume falling to reach 1.2137.

GBPUSD, “Great Britain Pound vs US Dollar”
After reaching the predicted downside target at 1.4155 and then forming a new consolidation range there, GBPUSD has broken it to the downside to reach this short-term downside target at 1.4100. Possibly, the pair may start a new growth to test 1.4155 from below and then resume falling with the target at 1.4088.

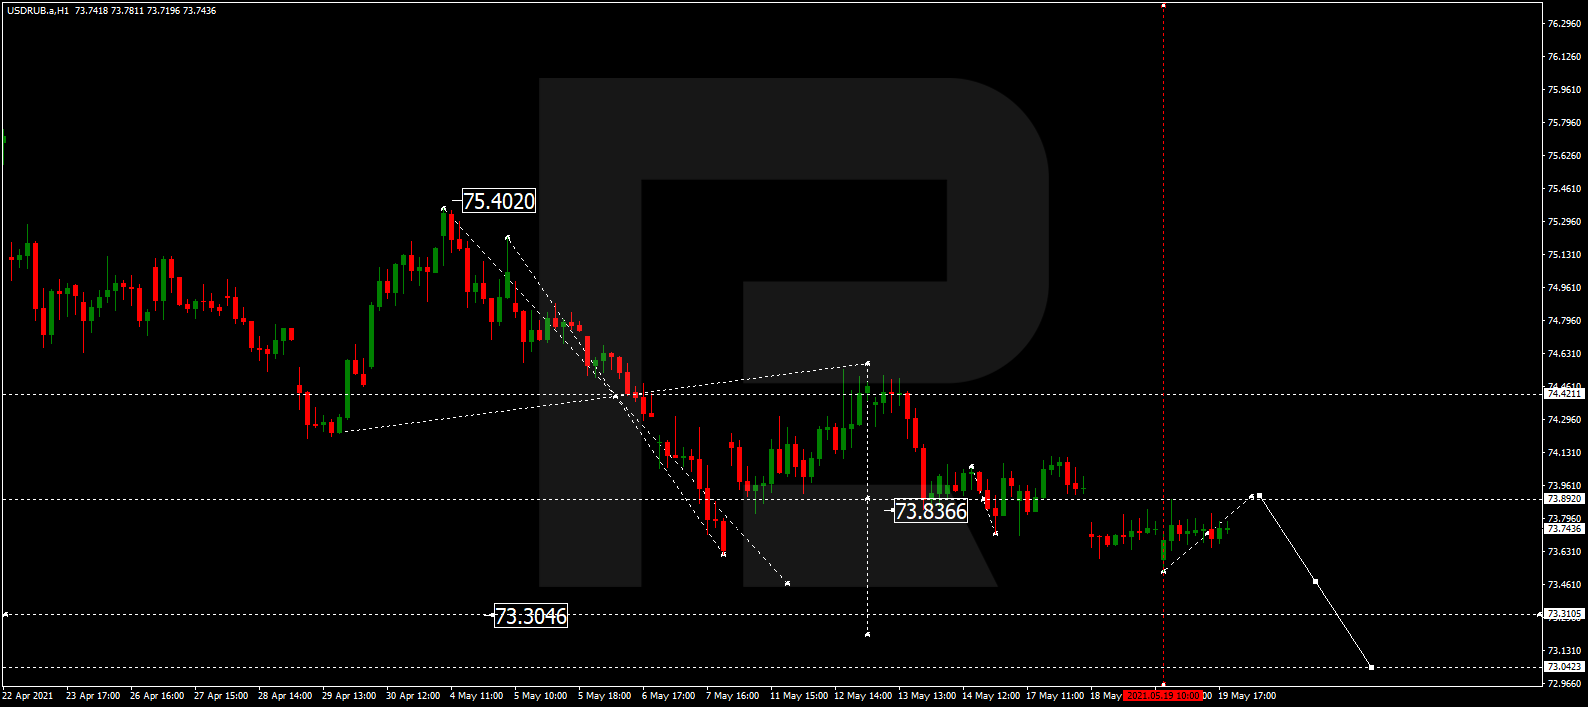
USDRUB, “US Dollar vs Russian Ruble”
USDRUB is still consolidating around 73.83 without any particular direction; it has already expanded the range down to 73.58. Today, the pair may test 73.85 from below and then resume trading within the downtrend with the short-term target at 73.30.
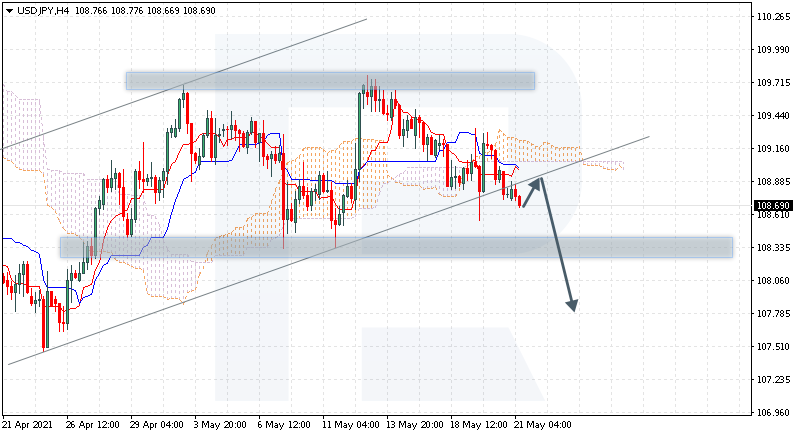
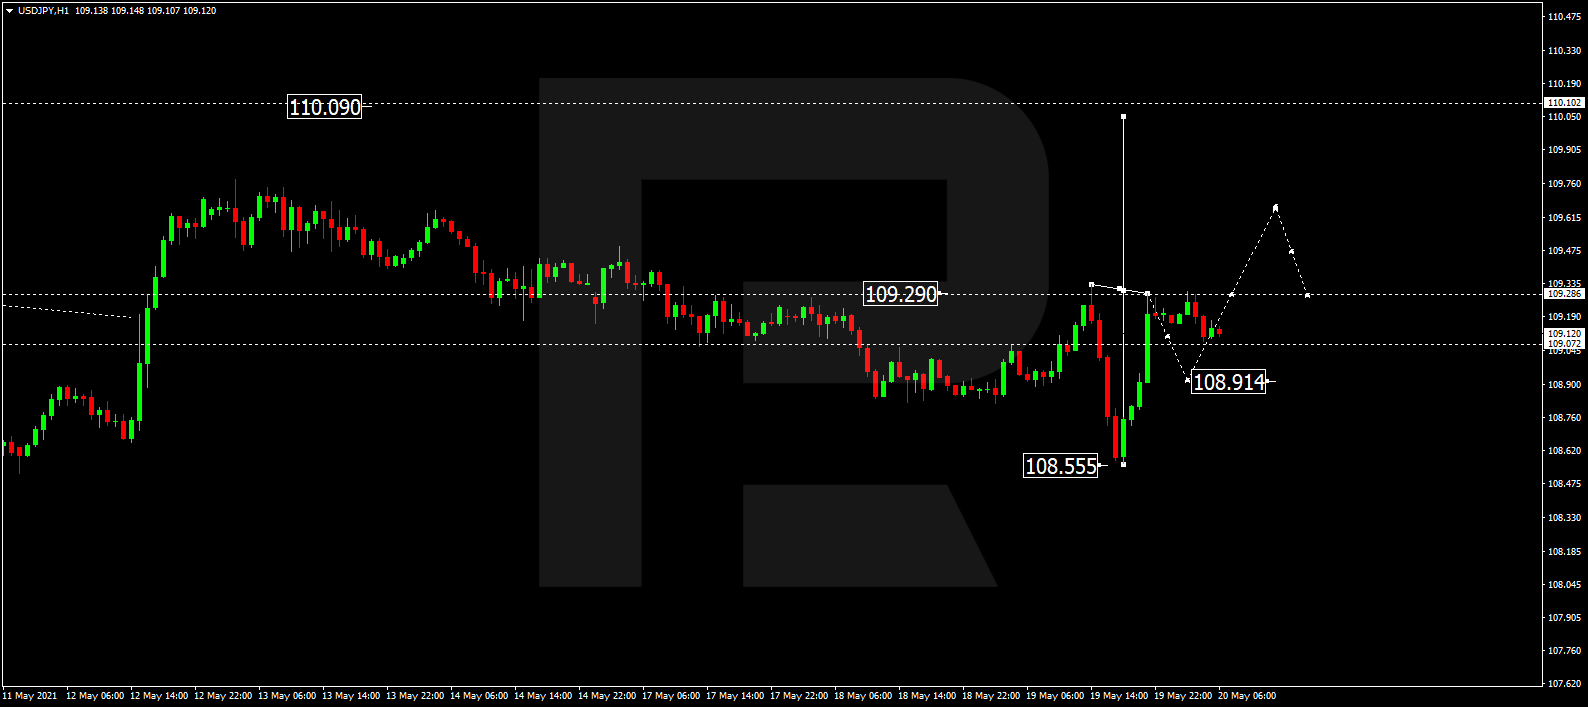
USDJPY, “US Dollar vs Japanese Yen”
After completing the descending wave at 108.55 along with the ascending impulse towards 109.29, USDJPY is correcting to reach 108.91. Later, the market may form one more ascending structure with the short-term target at 109.60.
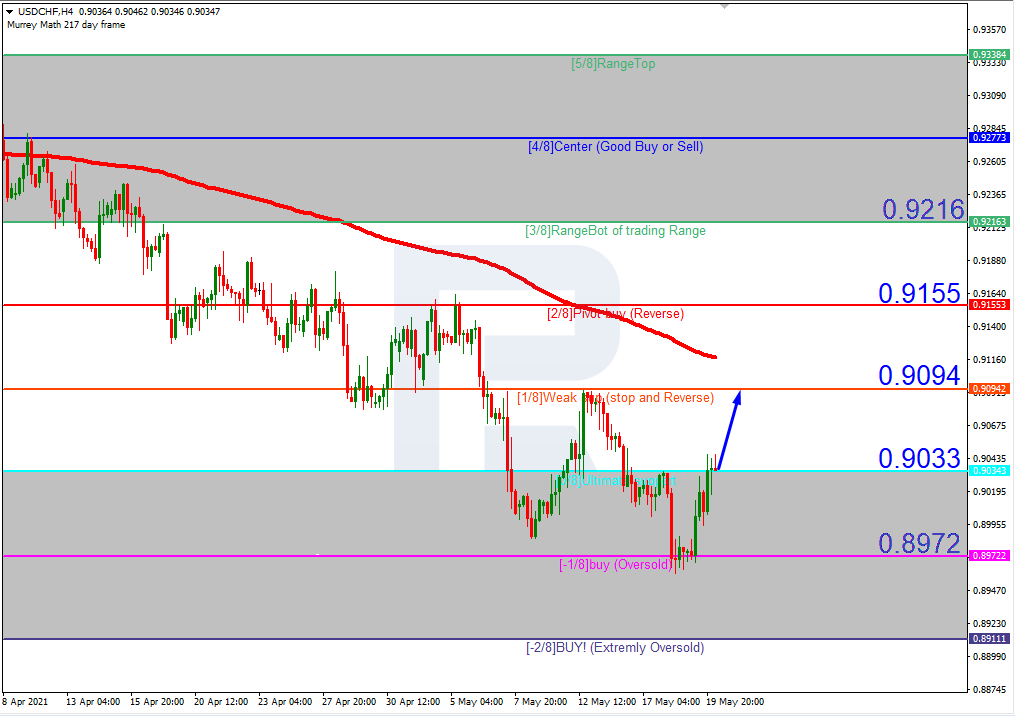
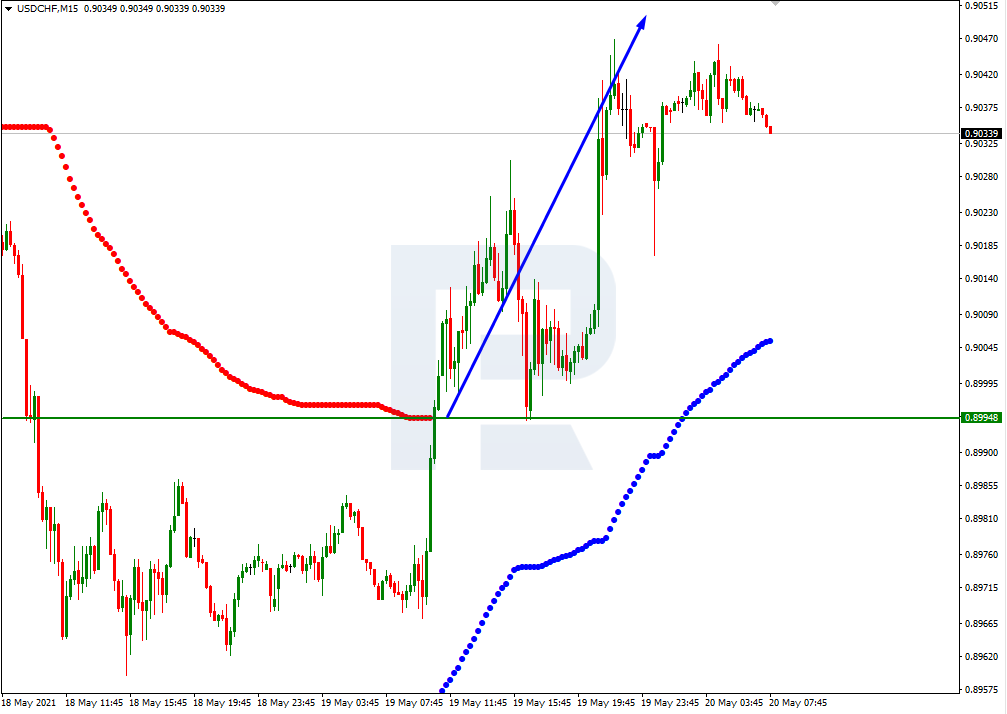
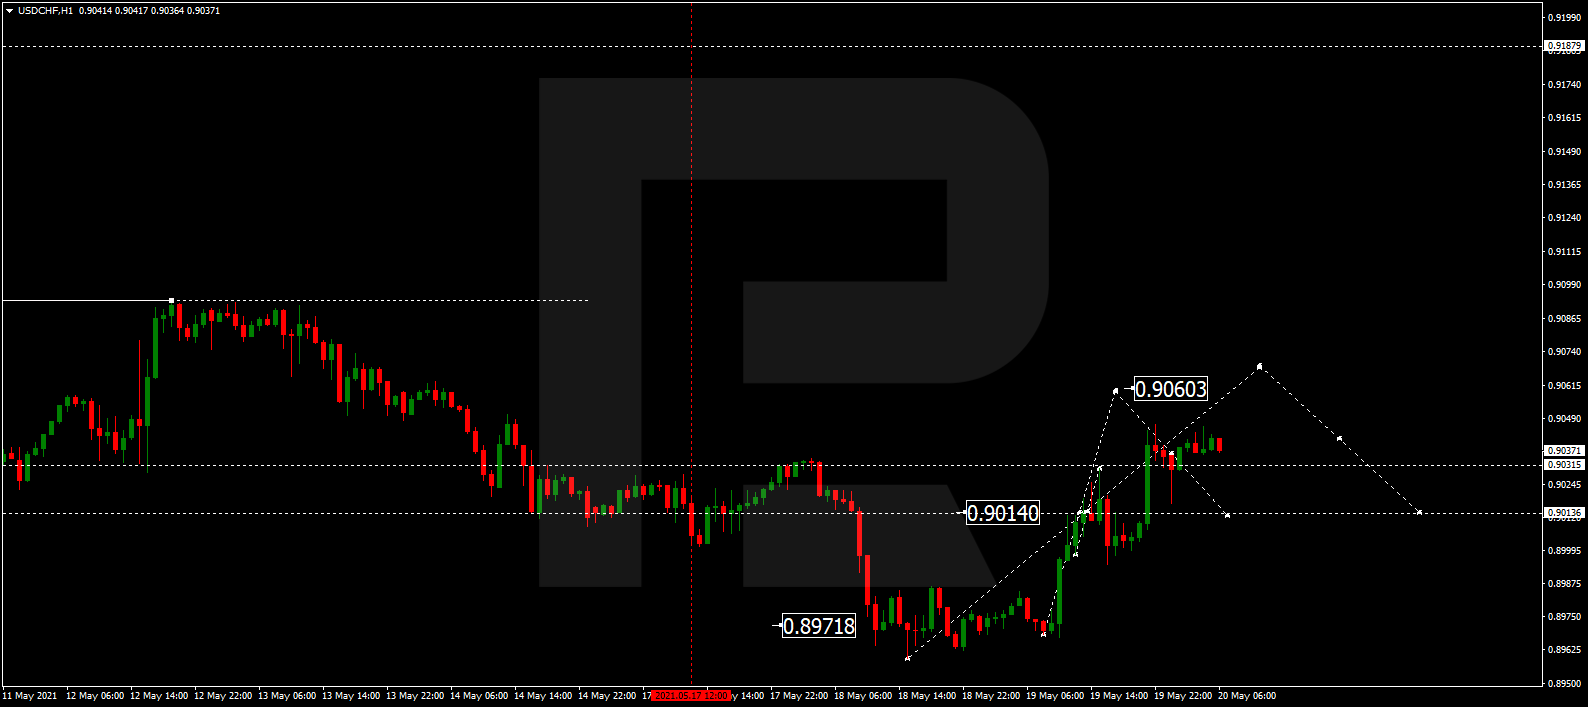
USDCHF, “US Dollar vs Swiss Franc”
After finishing the ascending wave at 0.9014 and forming a new consolidation range there, USDCHF has broken it to the upside; right now, it is still moving upwards to reach 0.9060. After that, the instrument may correct to return to 0.9014 and then resume growing with the target at 0.9070.
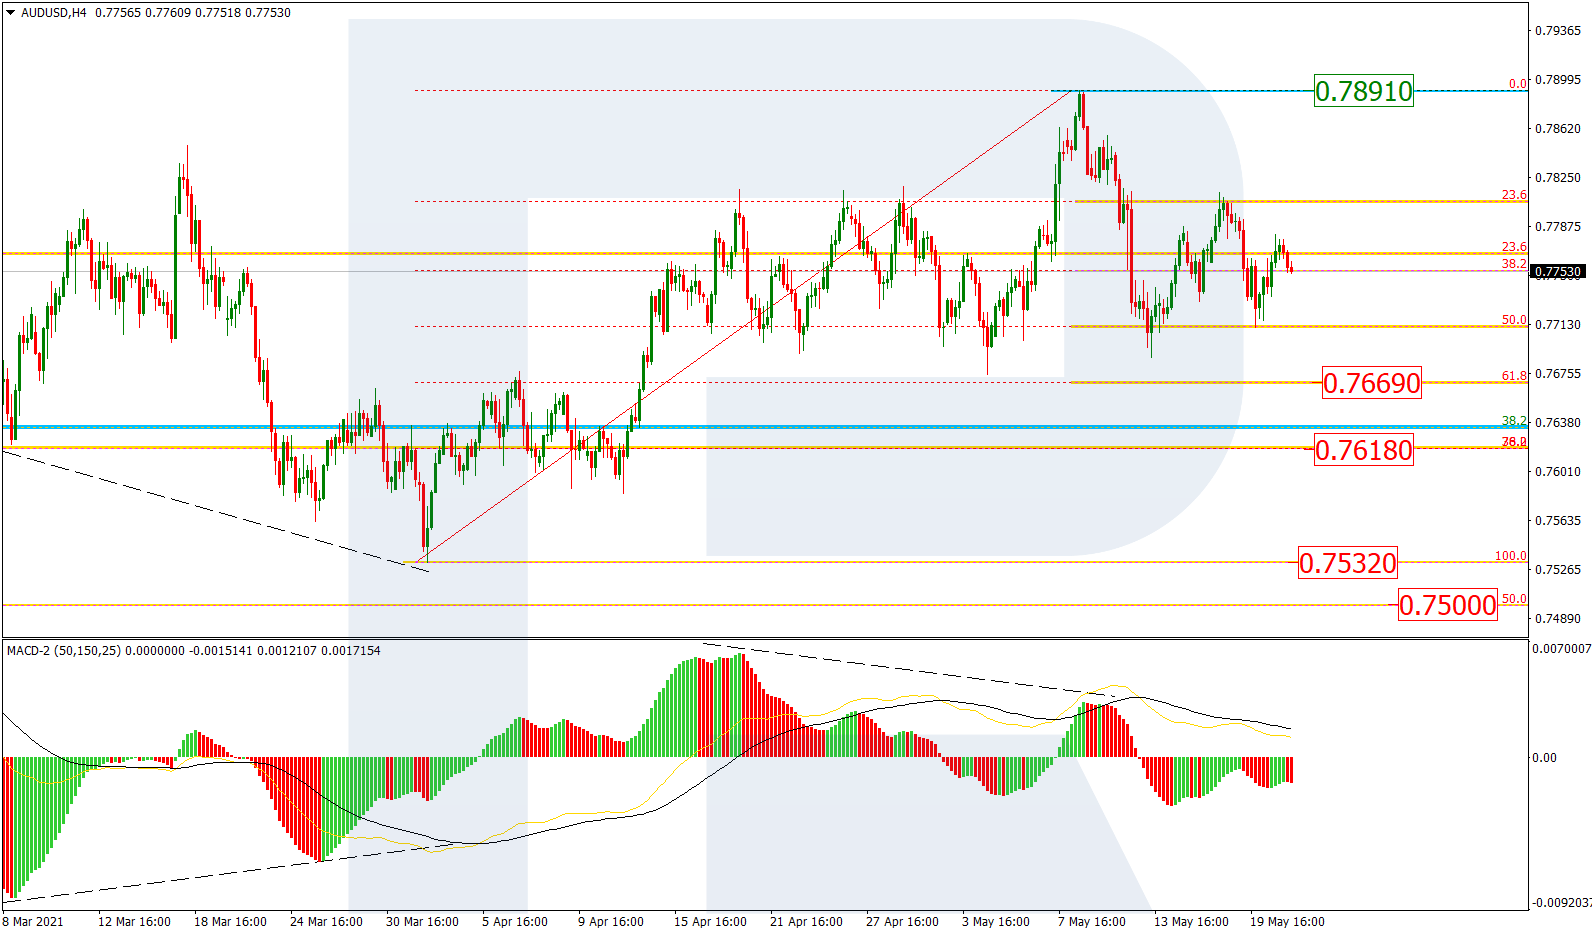
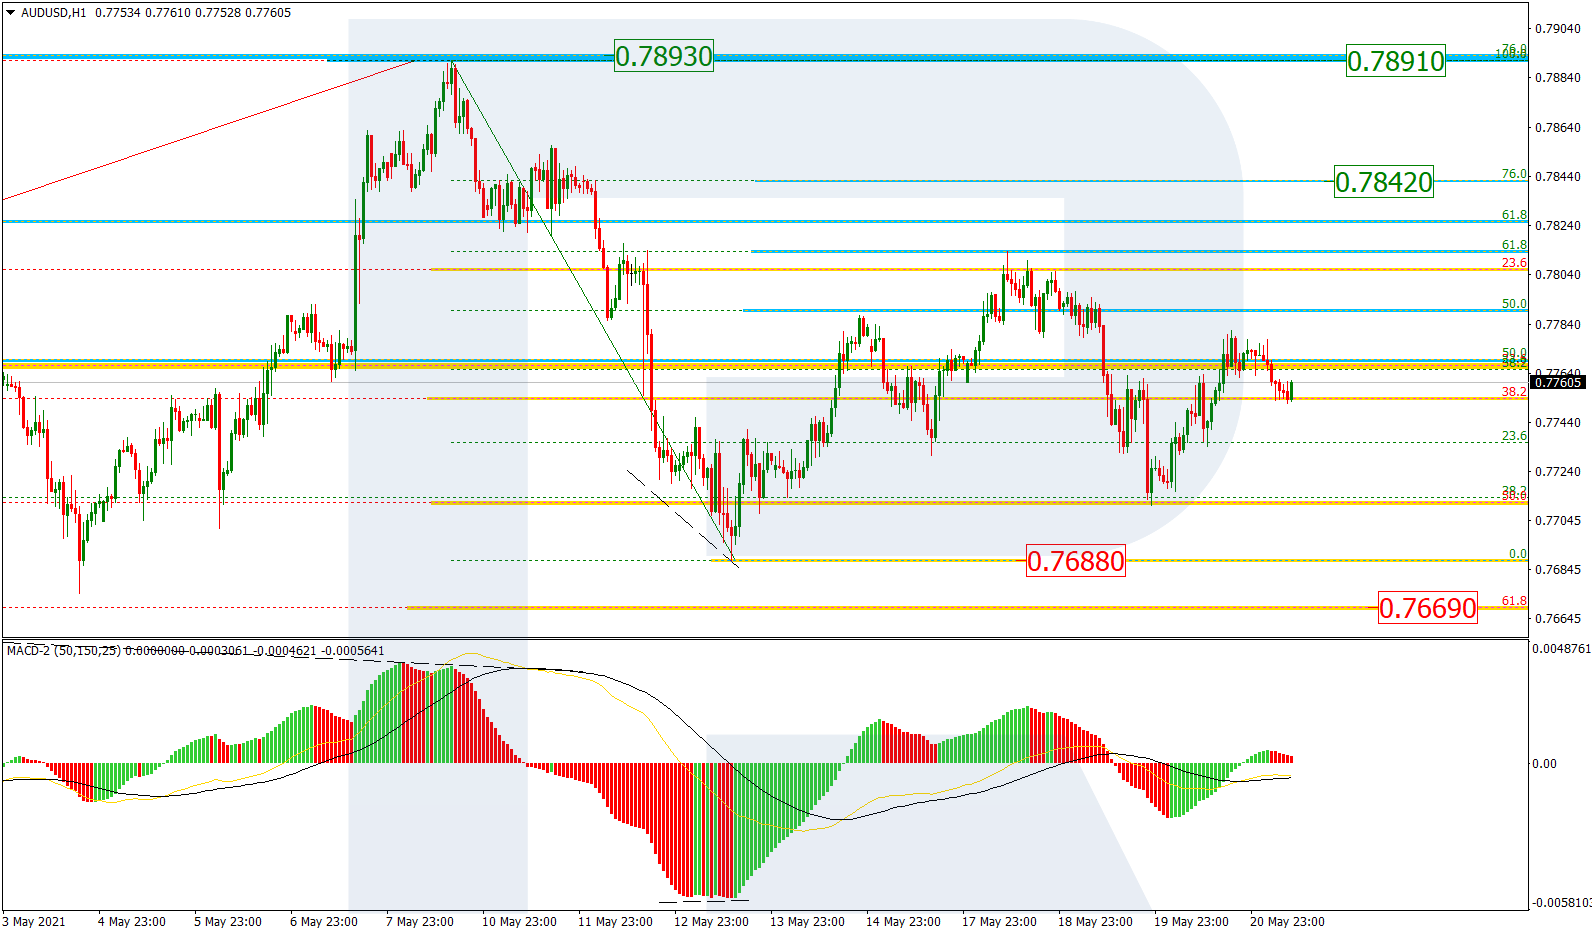
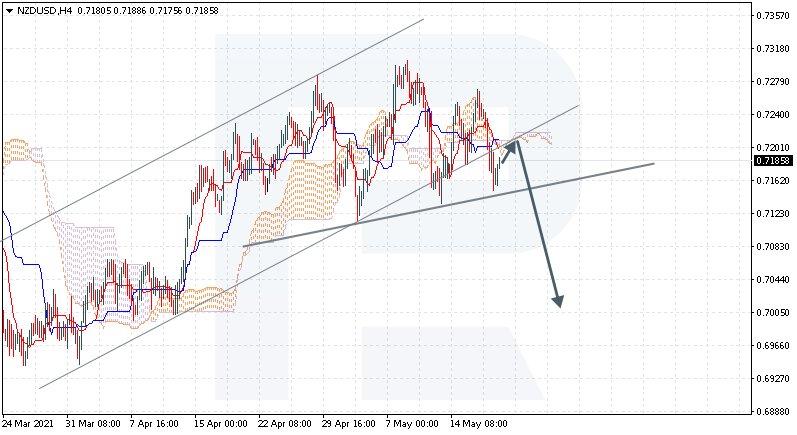
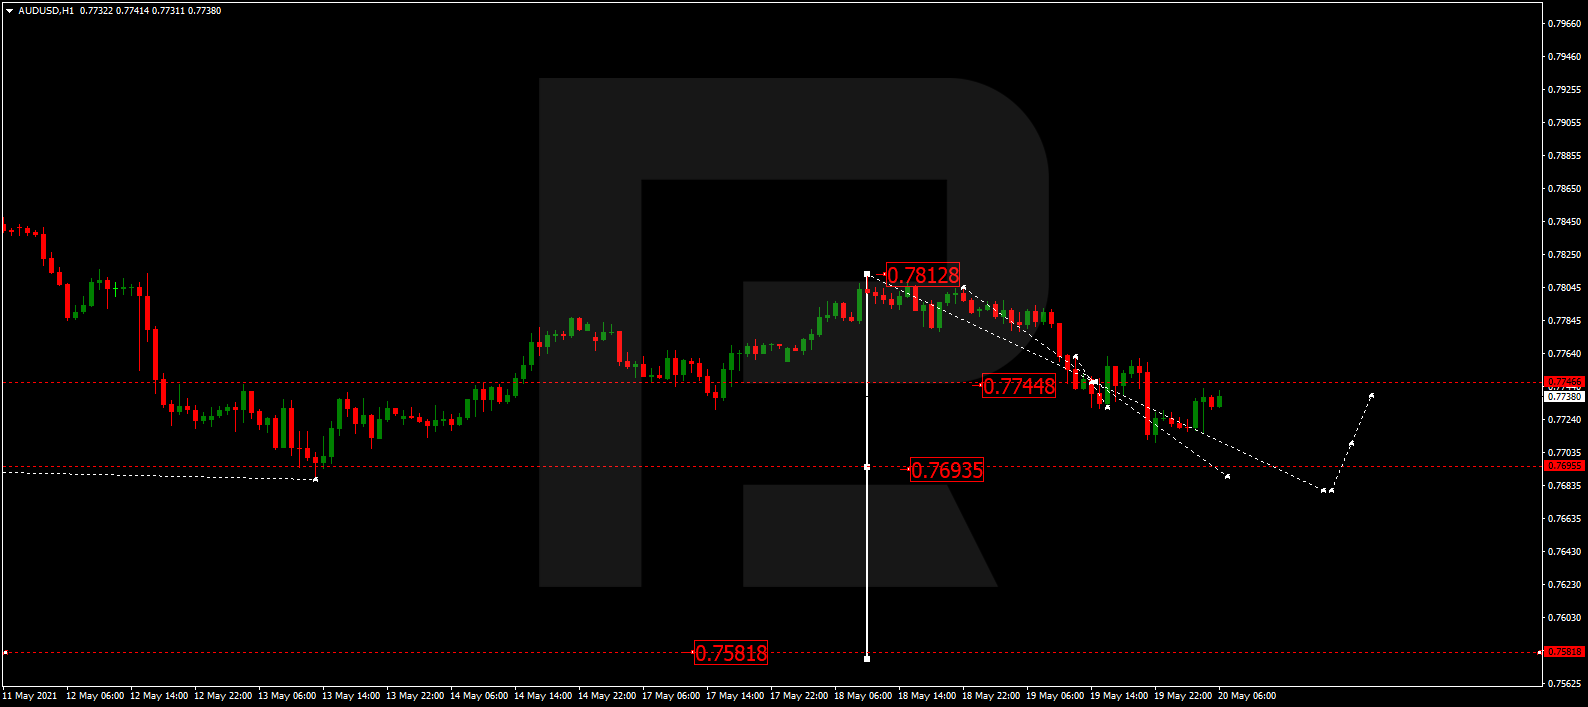
AUDUSD, “Australian Dollar vs US Dollar”
After completing the descending wave at 0.7744 and forming a new consolidation range there, AUDUSD has broken it to the downside and may later continue falling to break 0.7690. Later, the market may continue falling with the target at 0.7581.
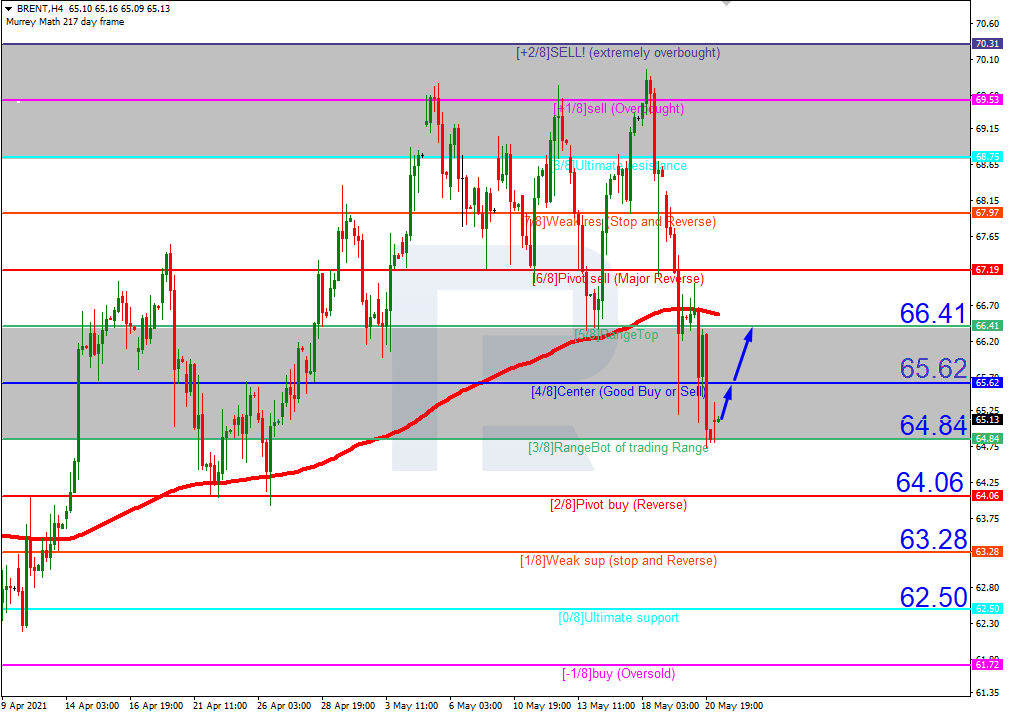
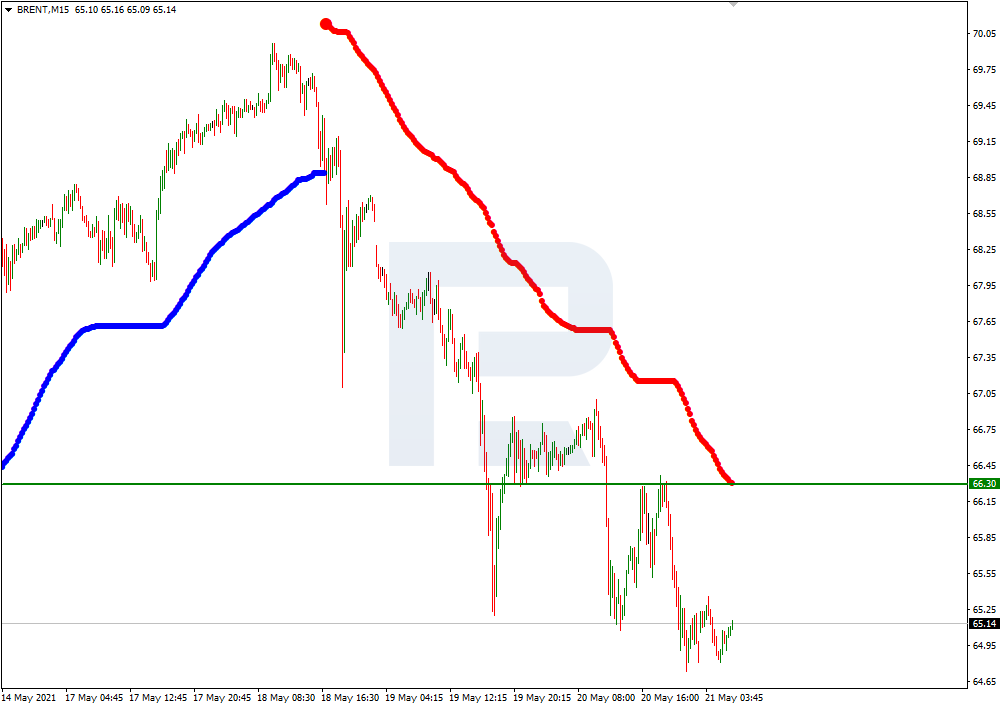
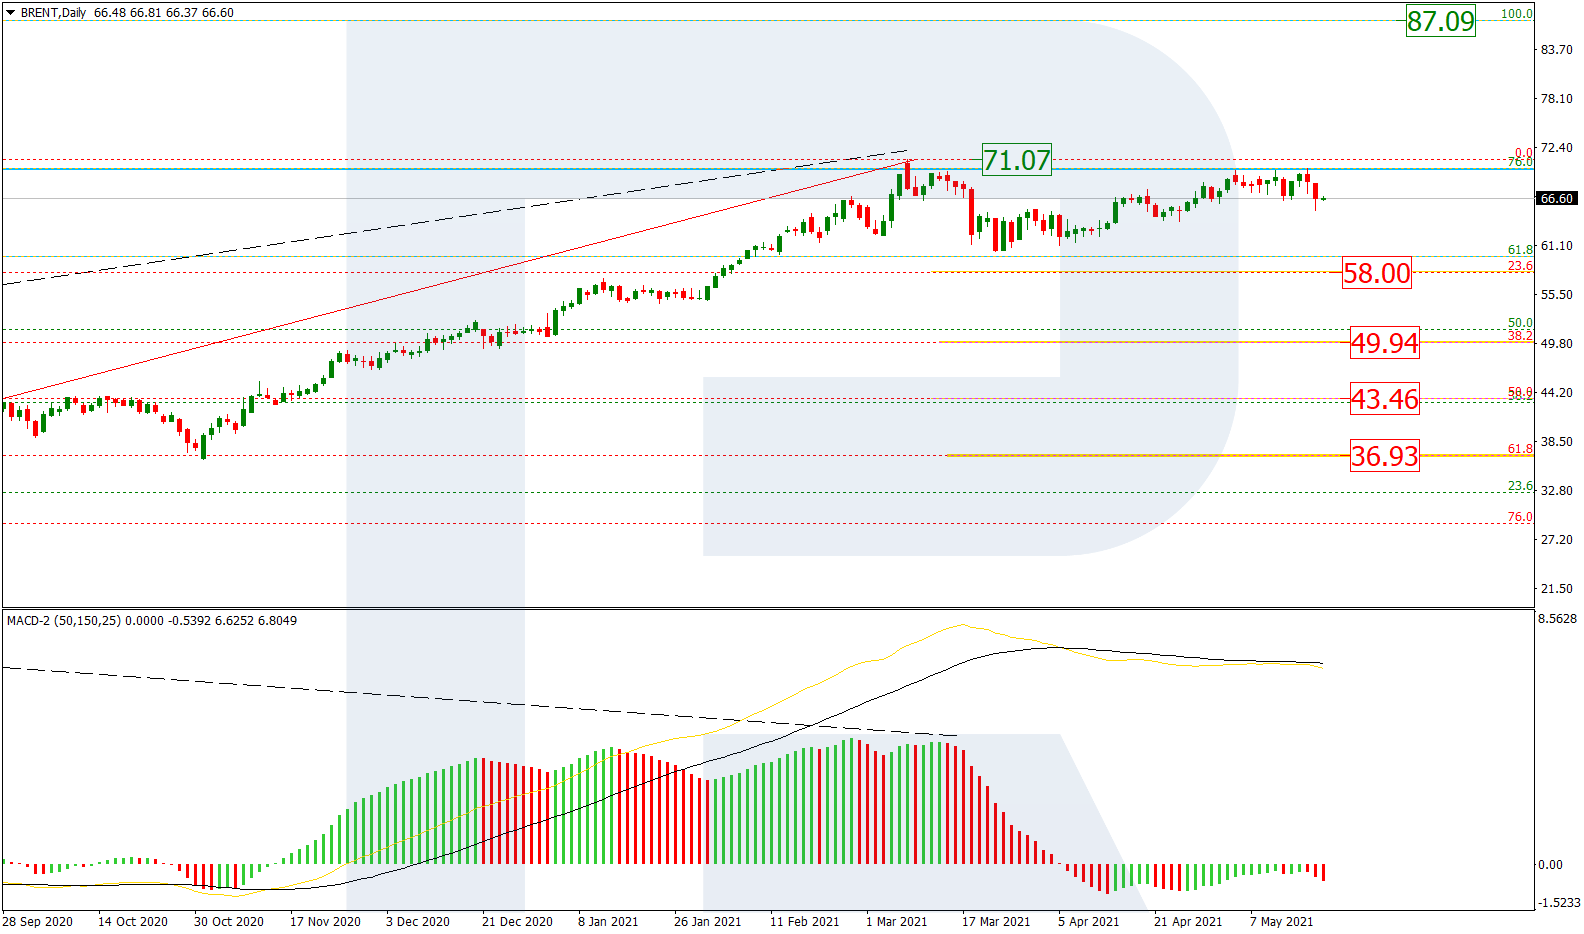
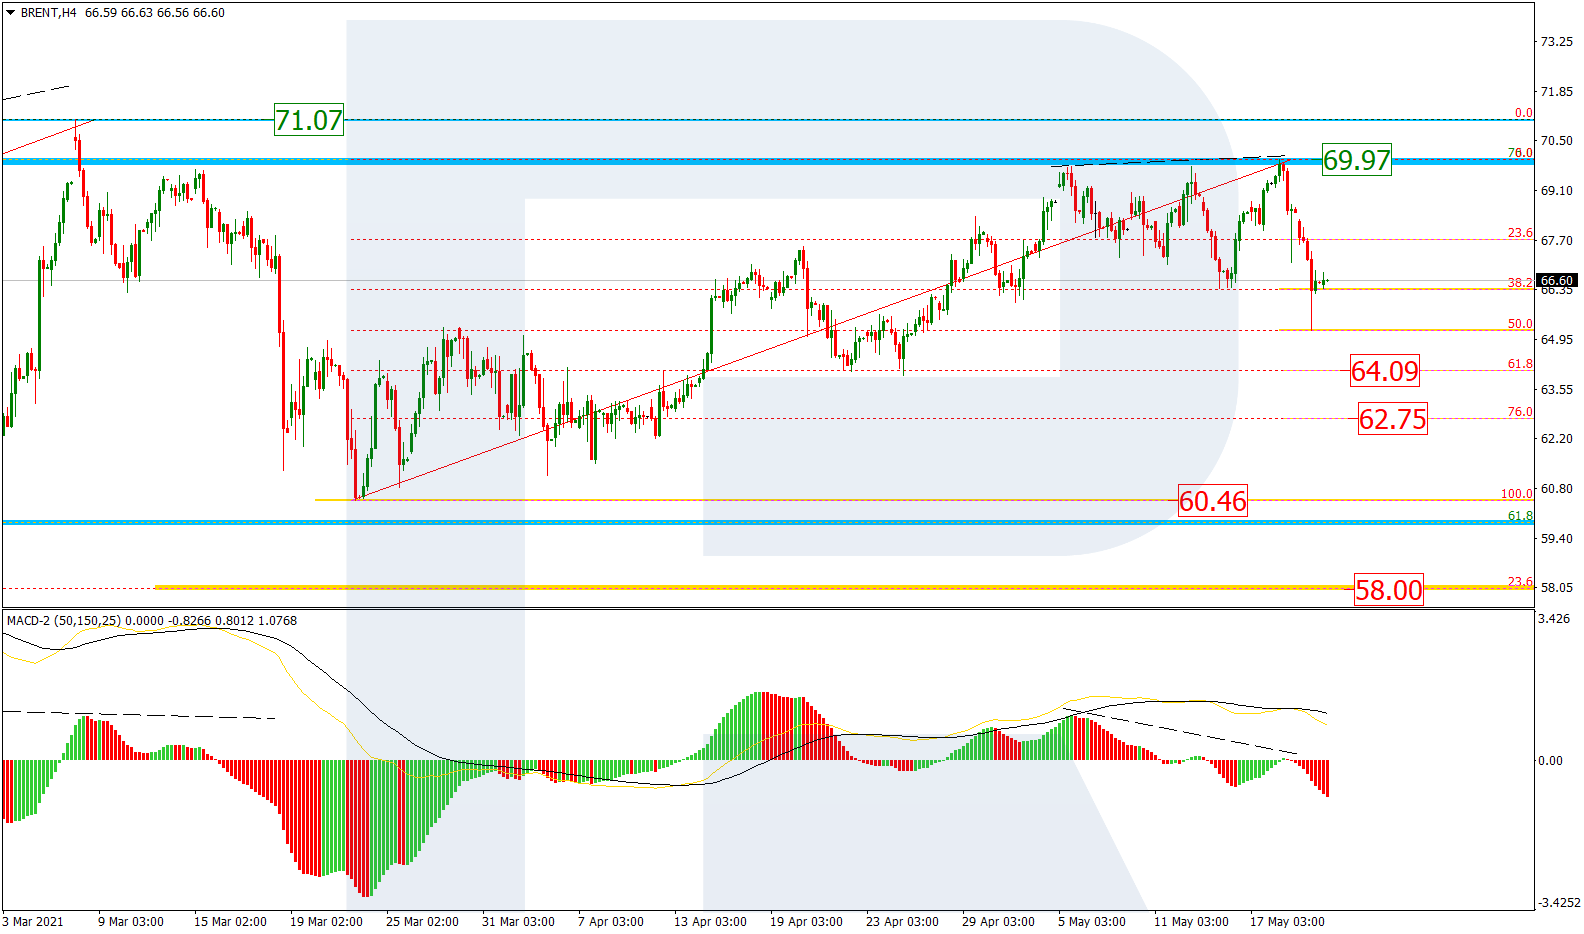
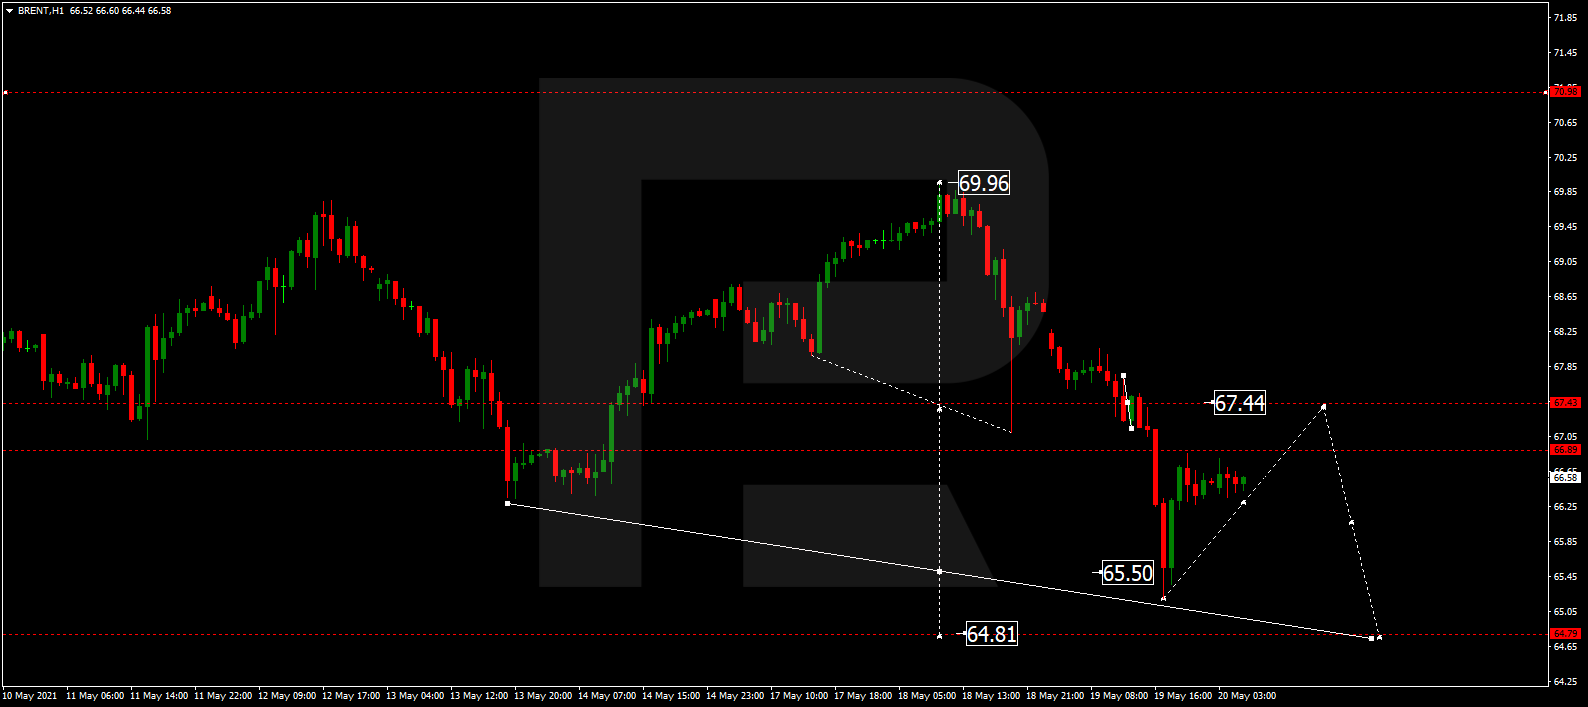
BRENT
After finishing the descending wave at 65.50, Brent is correcting towards 67.44 and may later form one more descending structure to finish the correction at 64.81. After that, the instrument may resume trading upwards with the target at 71.00.
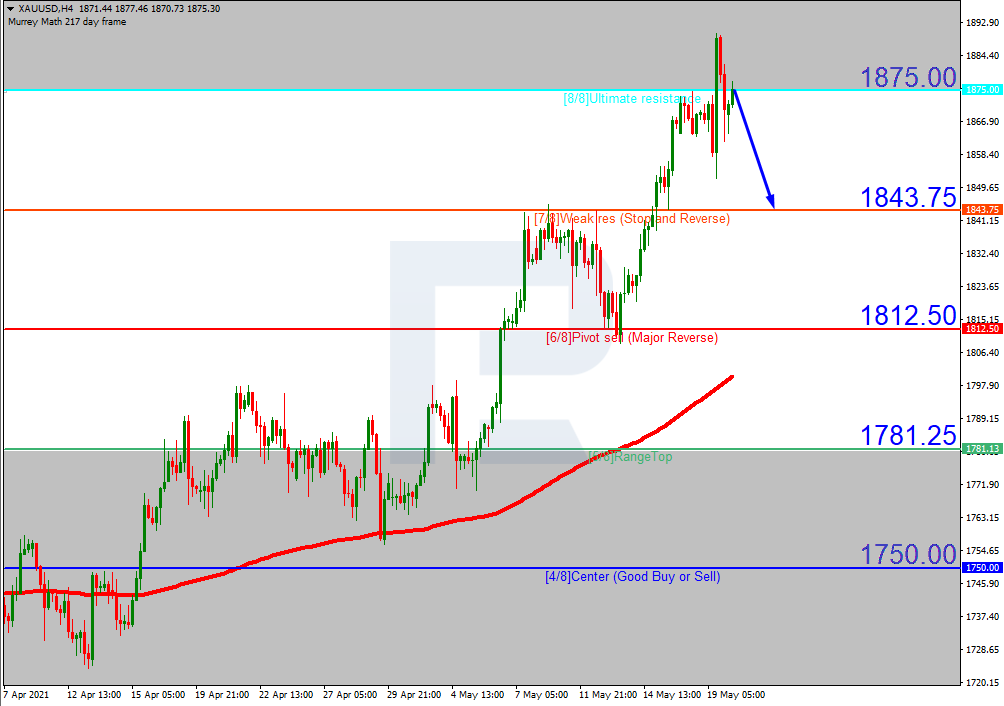
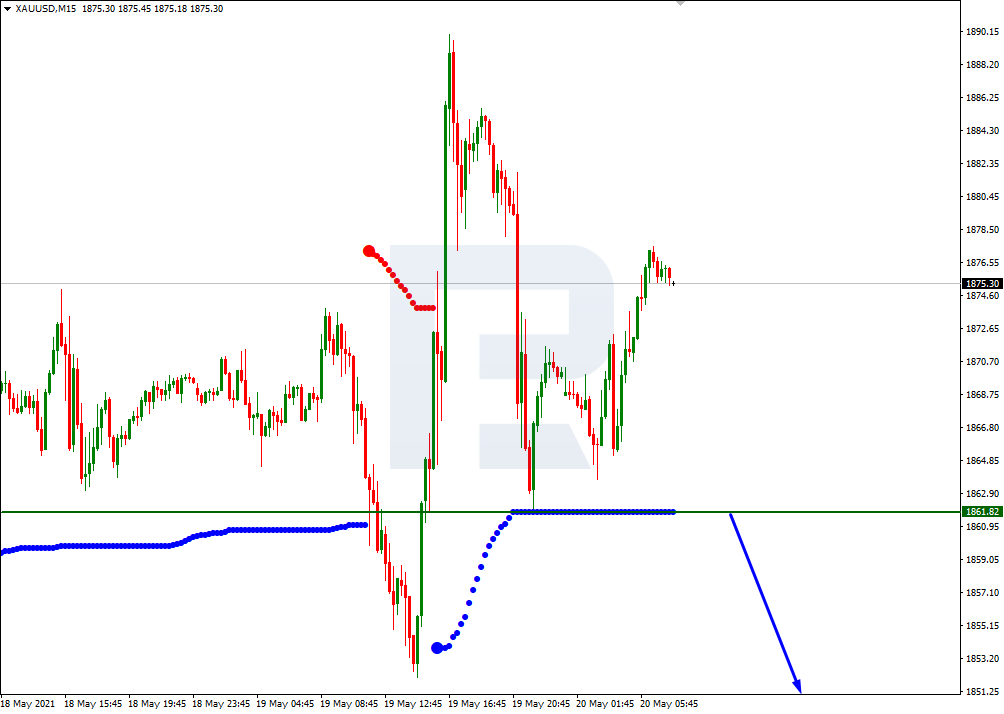
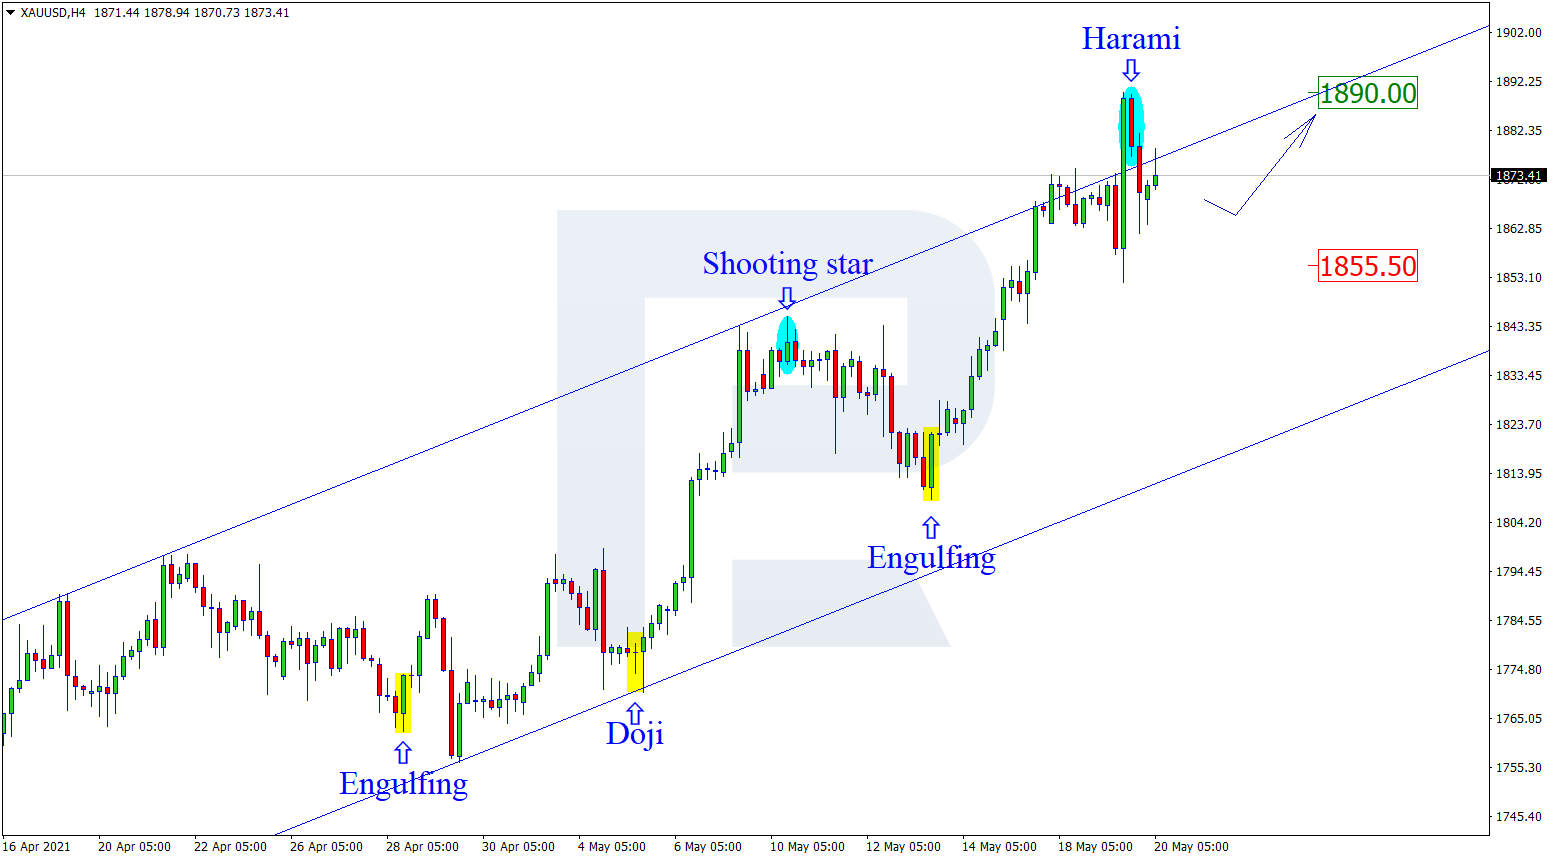
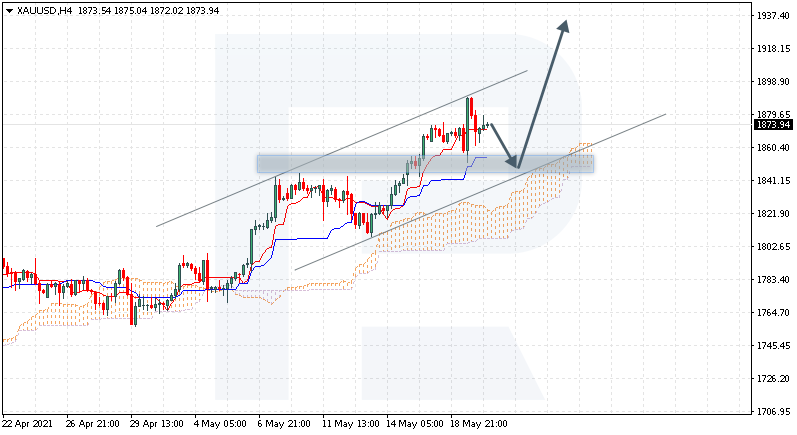
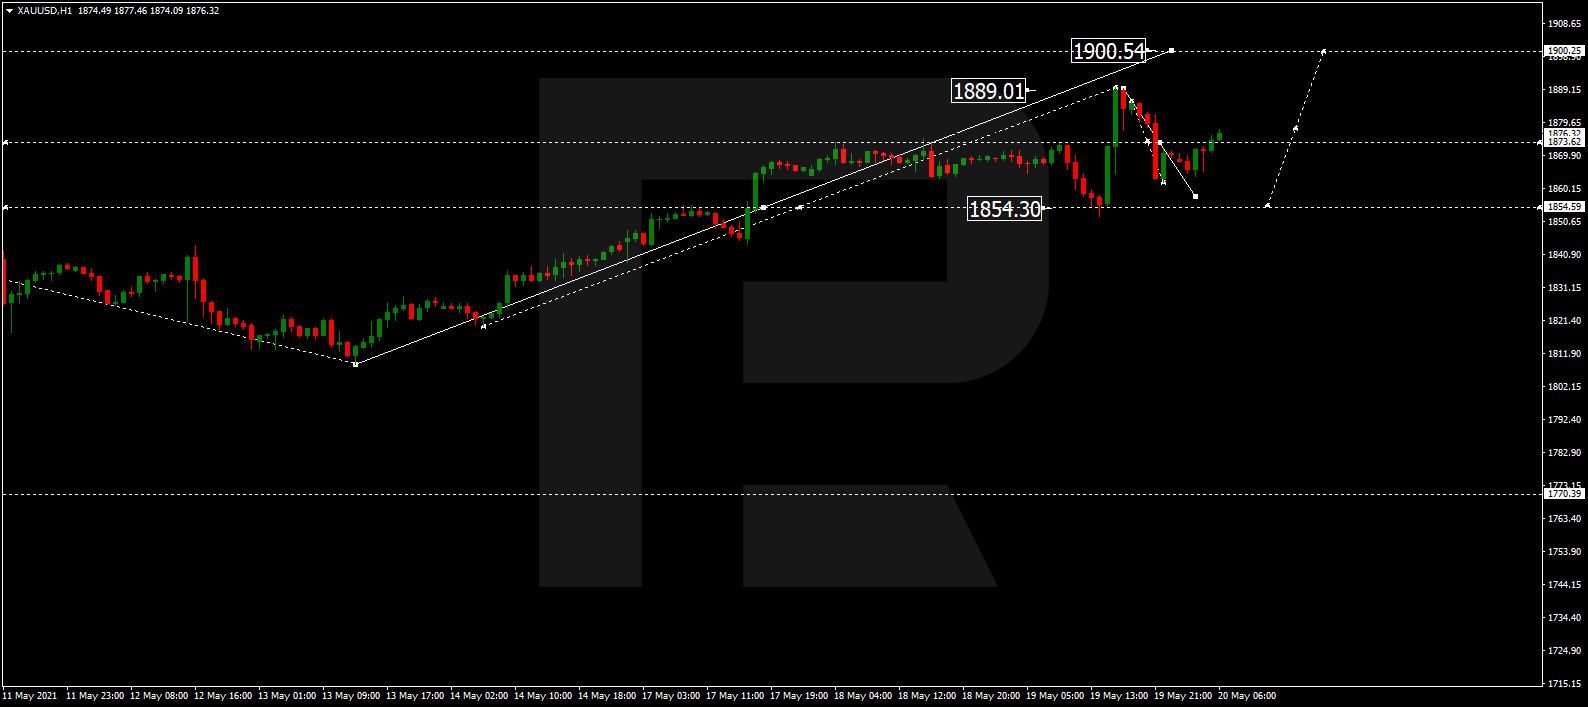
XAUUSD, “Gold vs US Dollar”
Gold has completed the ascending wave at 1889.00. Possibly, today the metal may correct towards 1854.30 and then form one more ascending structure to reach 1900.50. Later, the market may start another correction with the target at 1790.00.
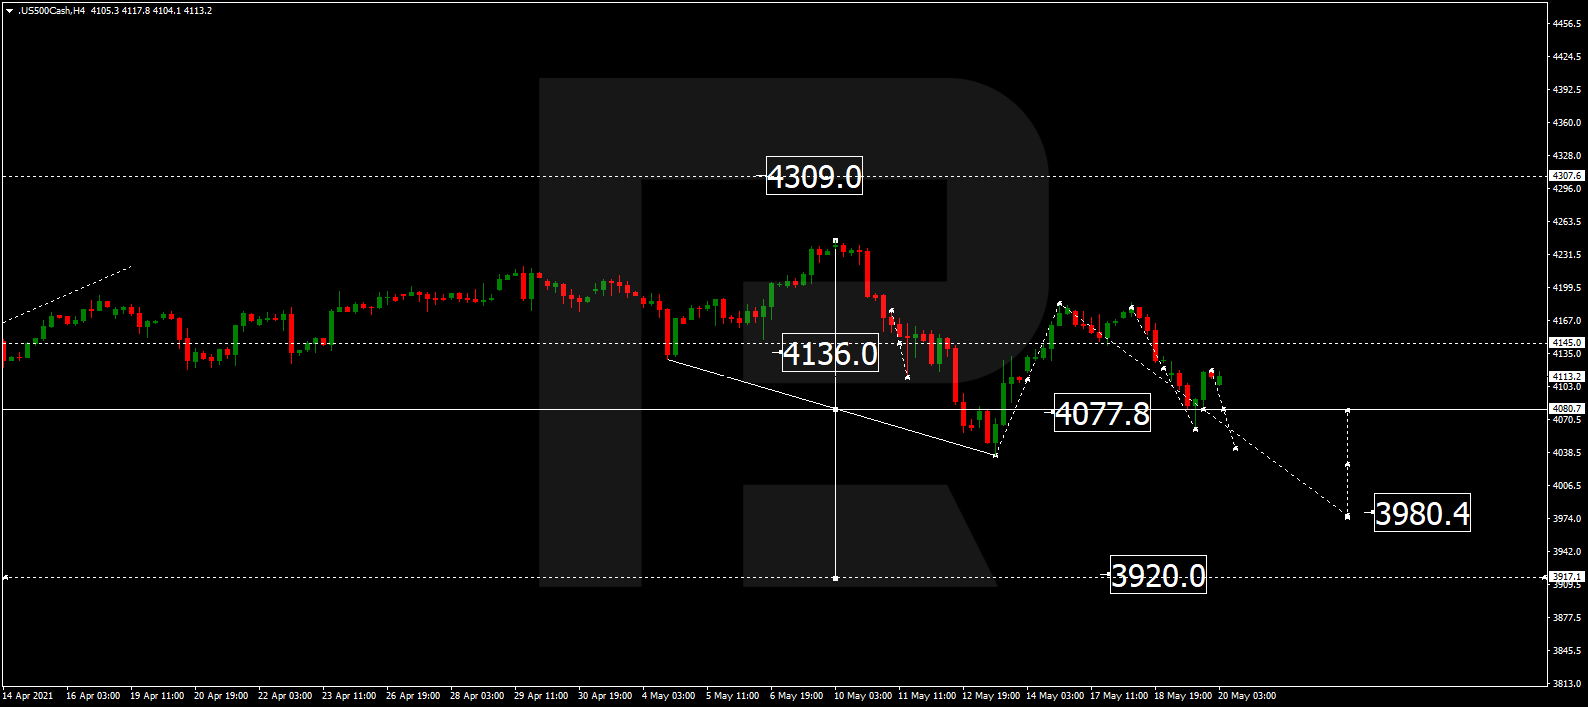
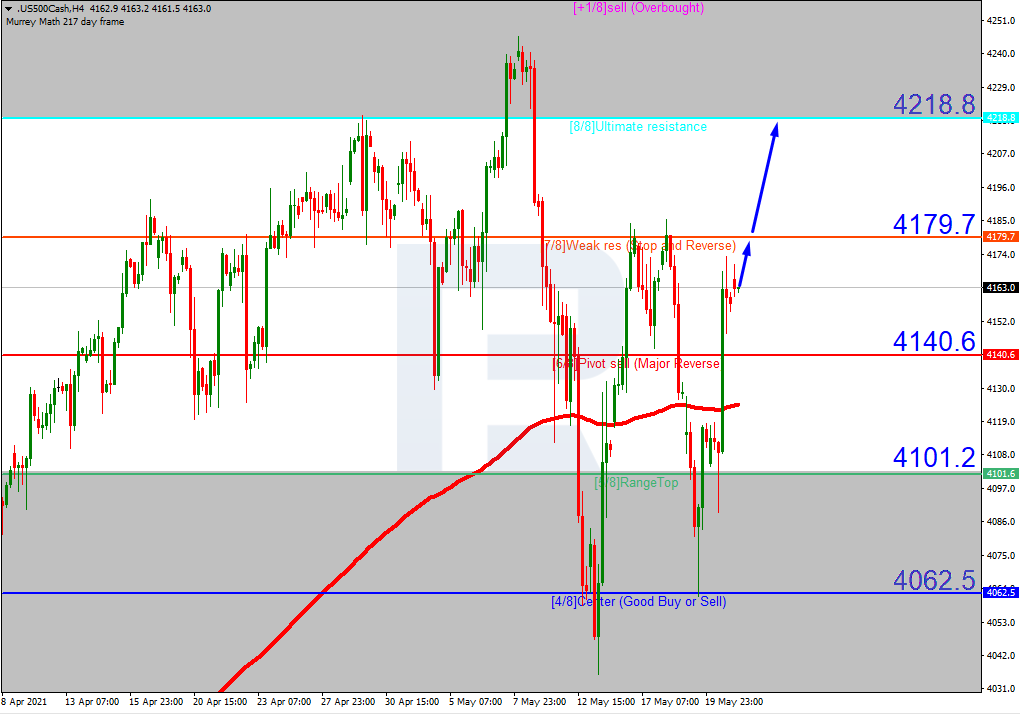
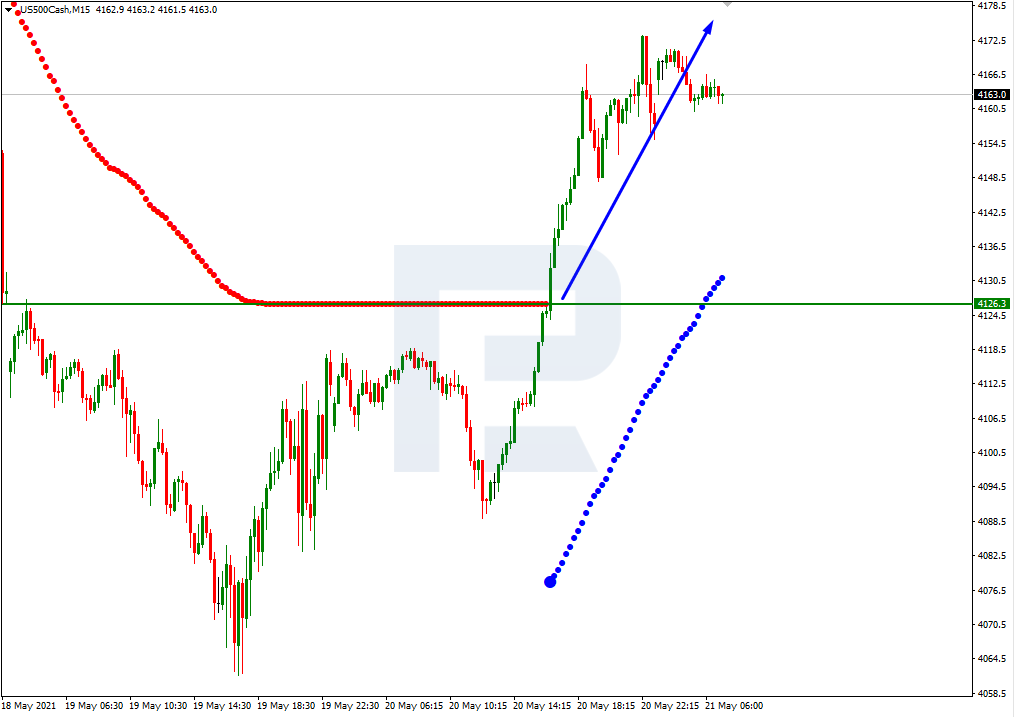
S&P 500
The S&P index has finished the descending wave at 4077.8. Today, the asset may consolidate around this level. If later the price breaks this range to the downside, the market may resume falling with the short-term target at 3980.0 and then start another correction to return to 4077.7. After that, the instrument may resume trading downwards with the key target at 3920.0.