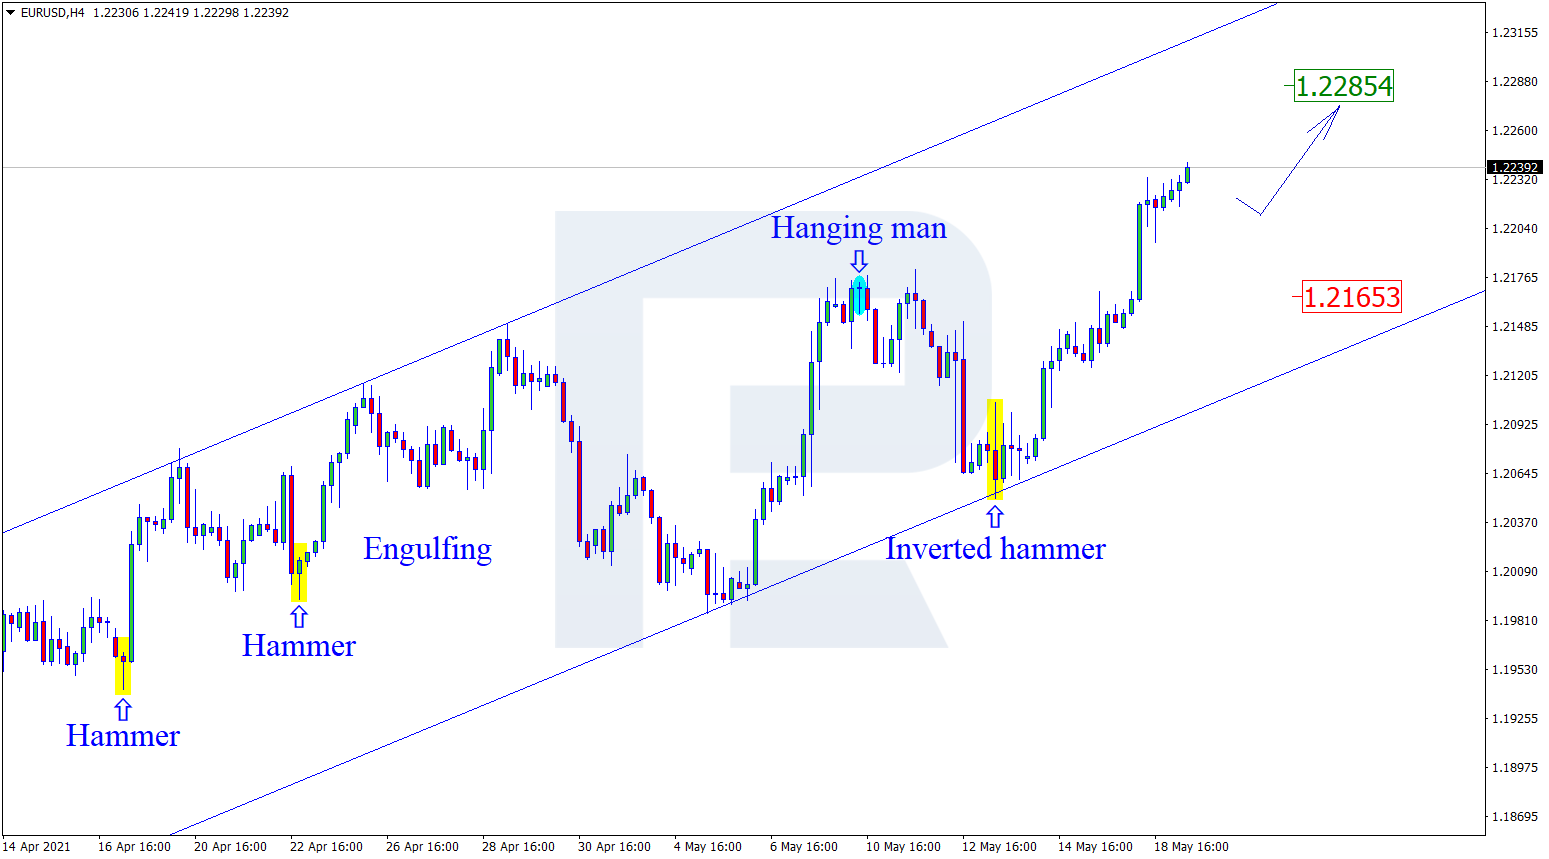
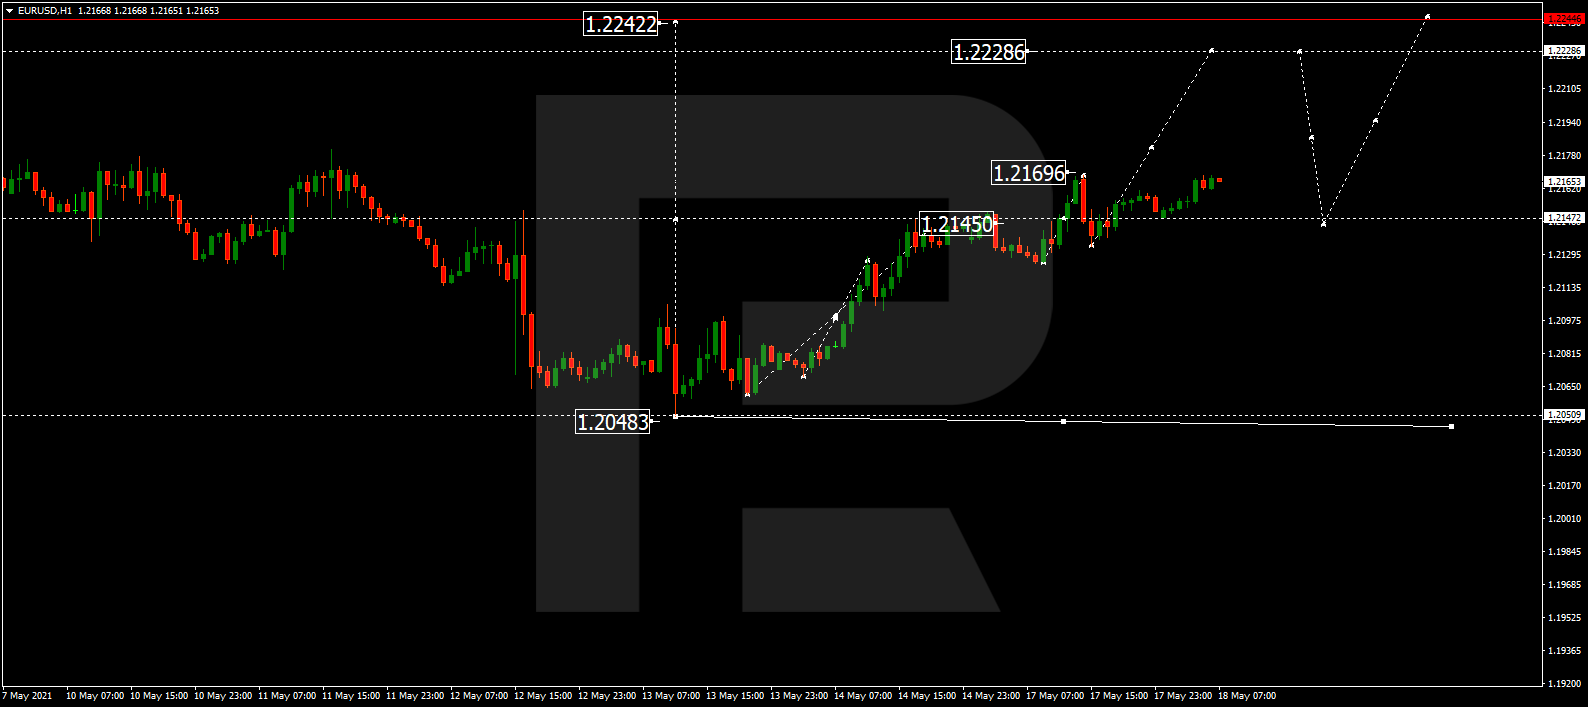
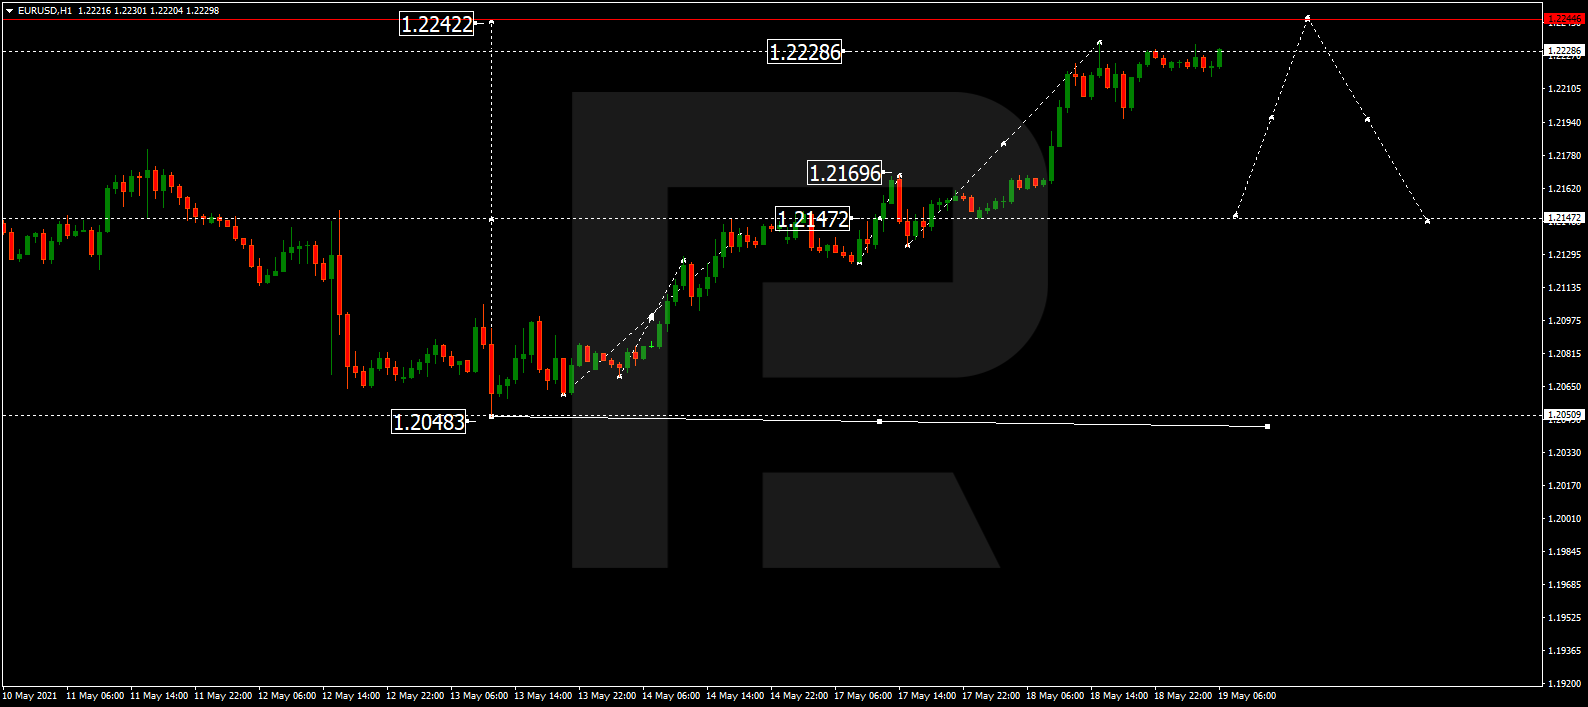
EURUSD, “Euro vs US Dollar”
After completing the ascending wave at 1.2222, EURUSD is consolidating around this level. Possibly, today the pair may form one more ascending structure to reach 1.2242 and then start a new correction with the target at 1.2150.

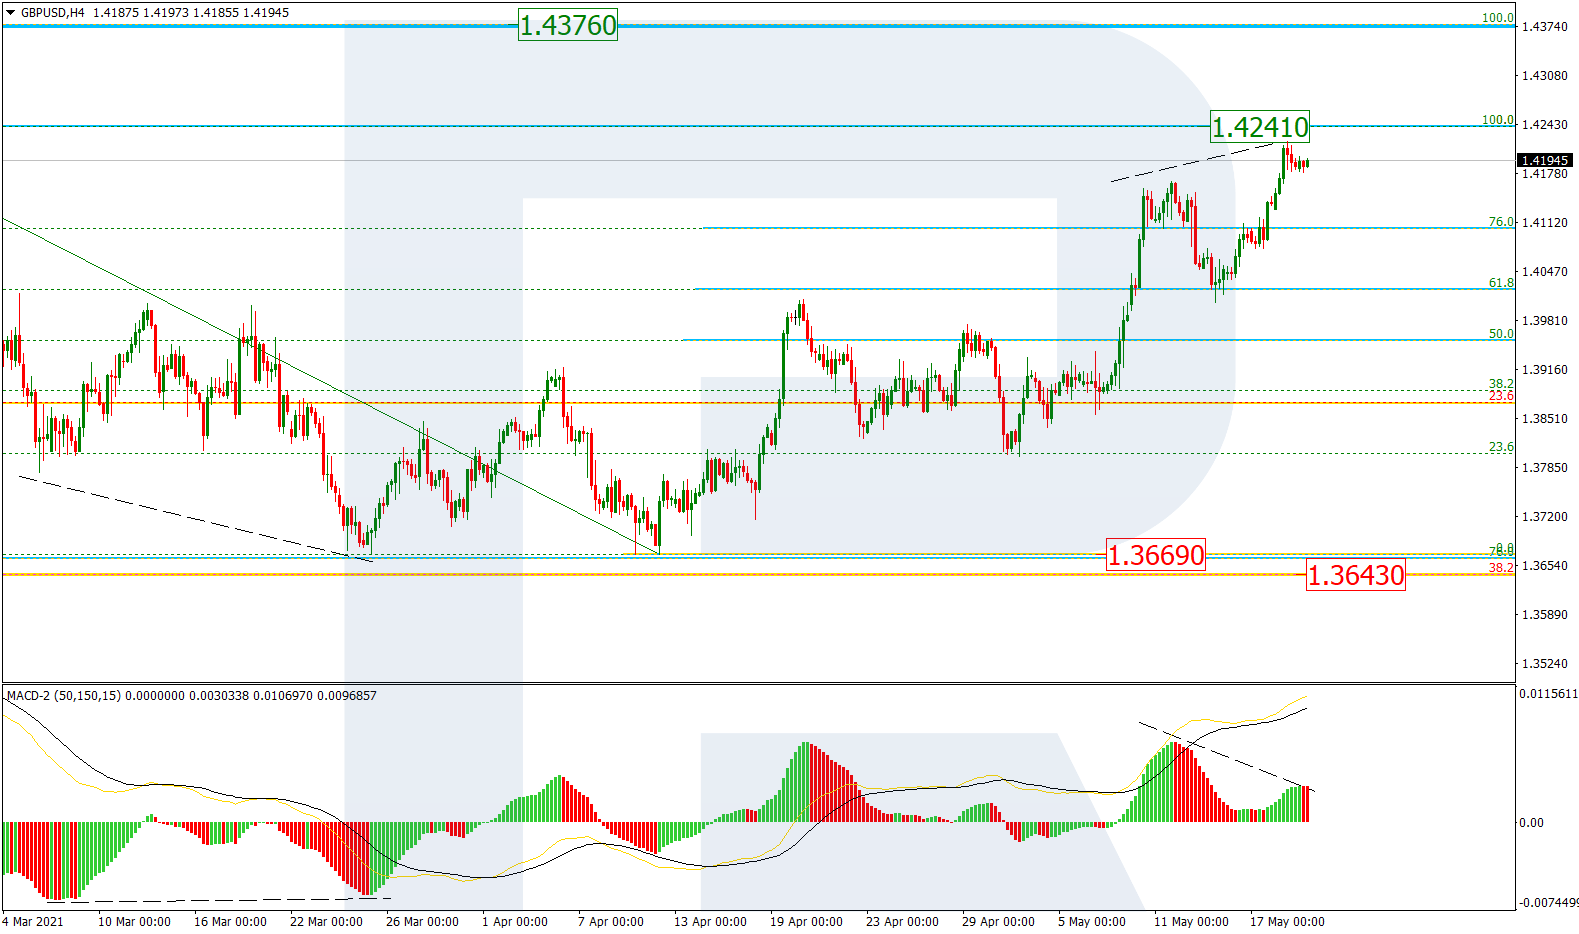
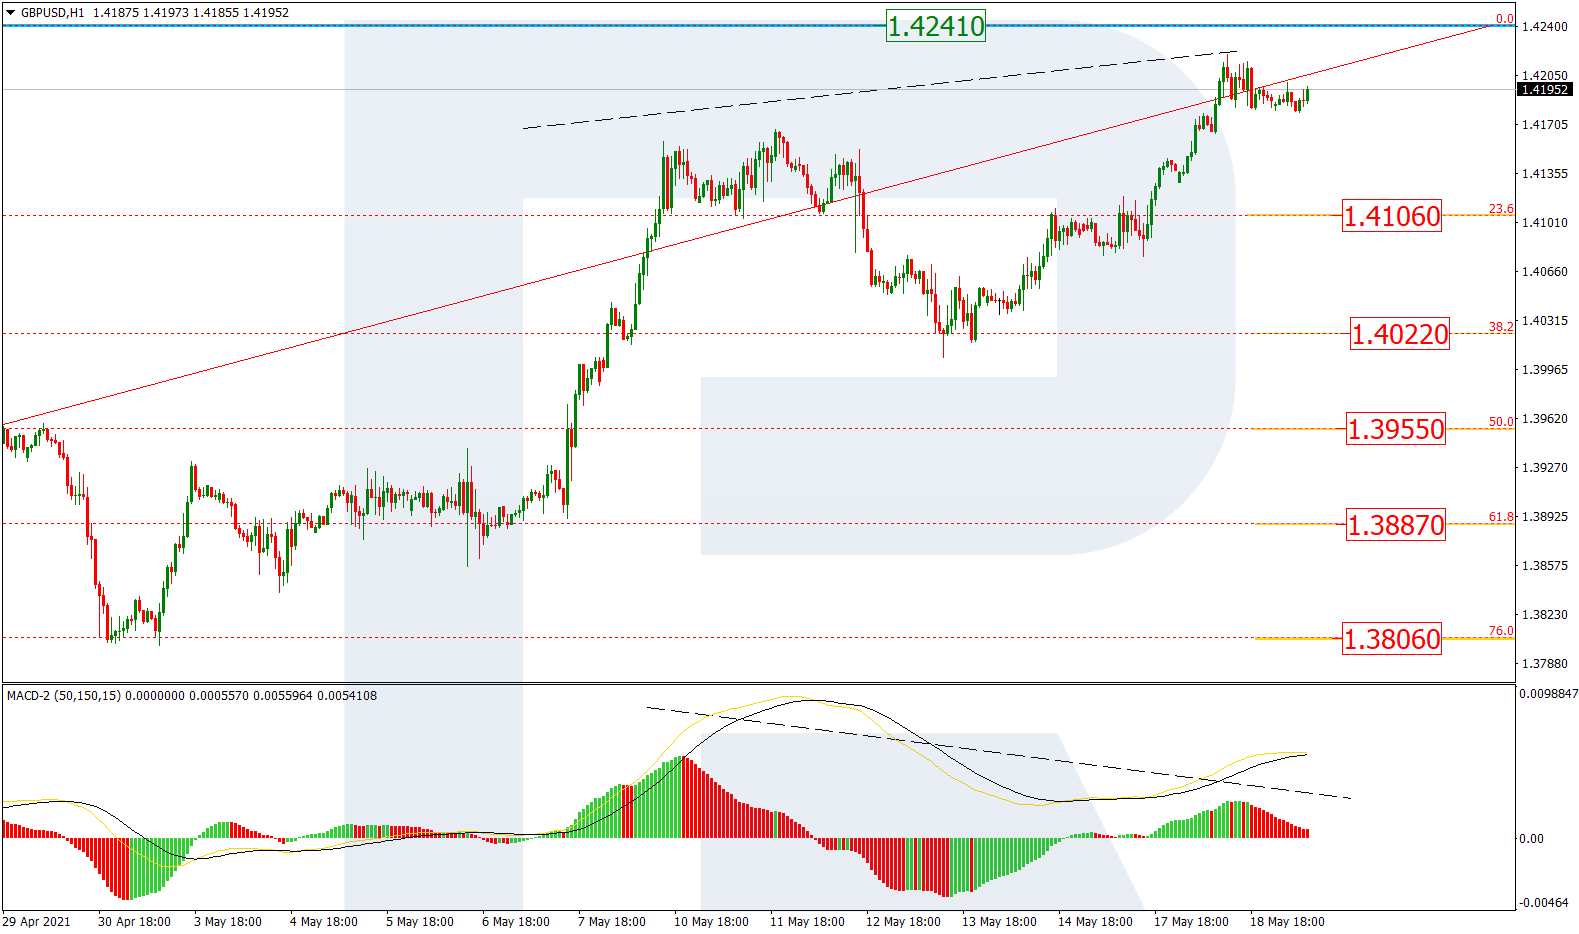
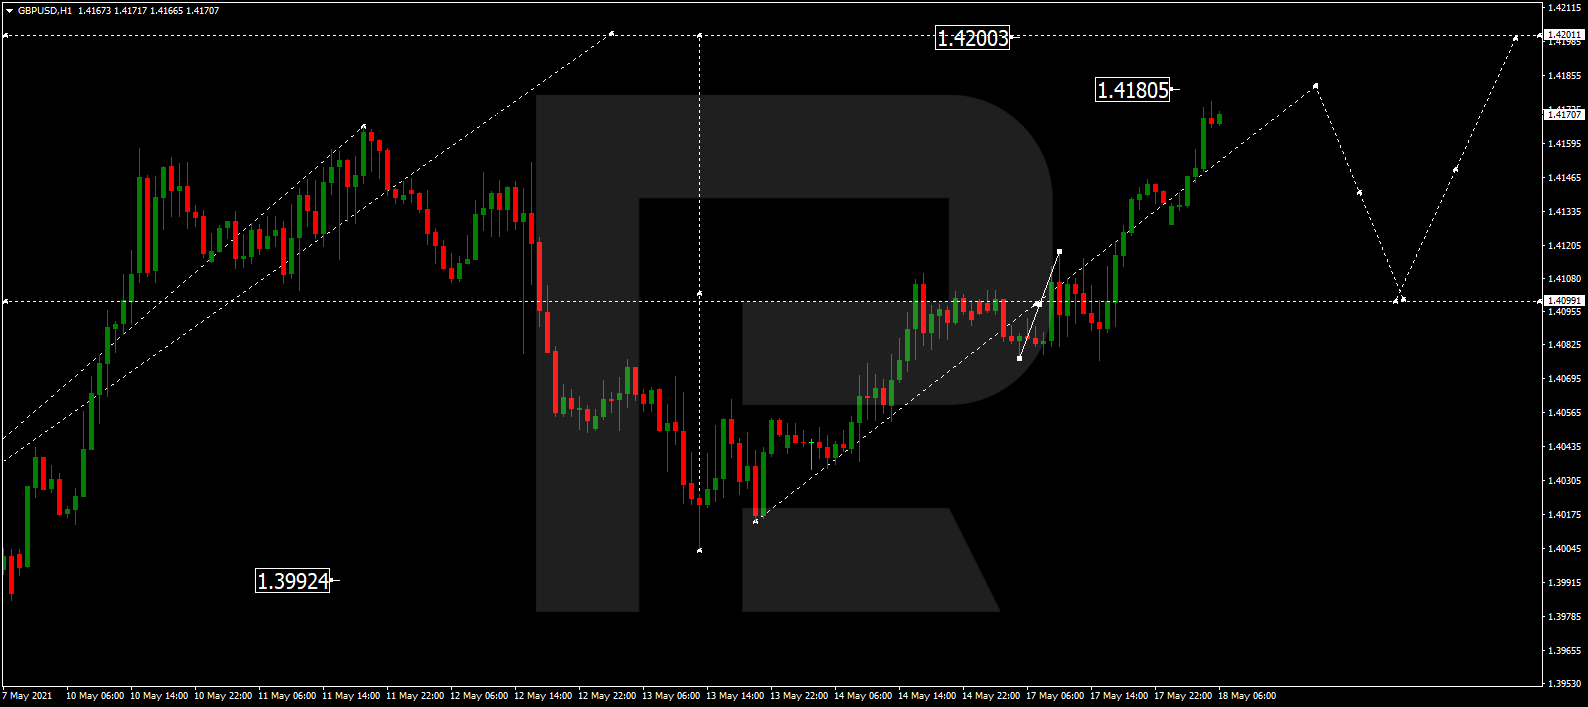
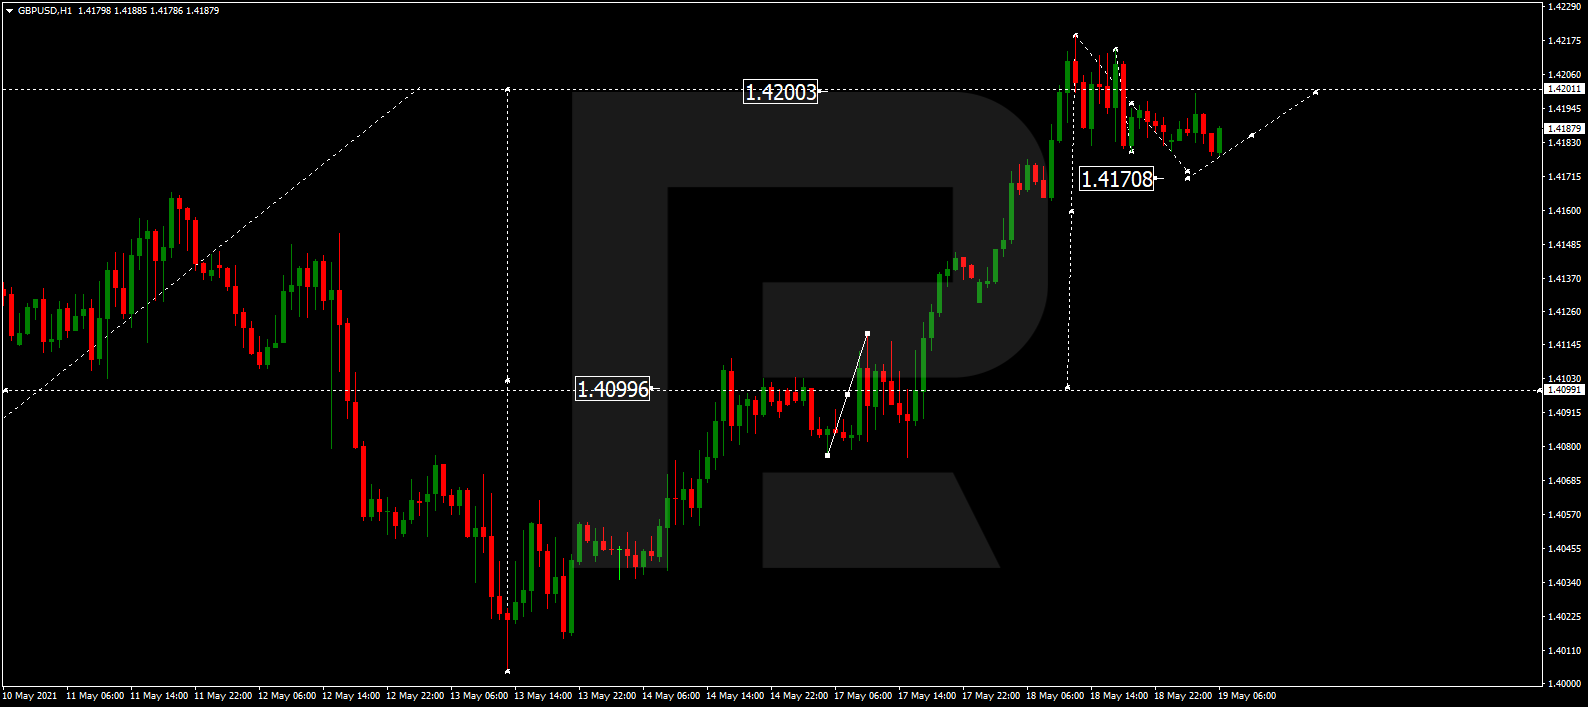
GBPUSD, “Great Britain Pound vs US Dollar”
After reaching the predicted upside target at 1.4200, GBPUSD is forming a new consolidation range there. Possibly, the pair may fall towards 1.4170 and then start a new growth to return to 1.4200. Later, the market may break the range to the downside and correct with the target at 1.4100.
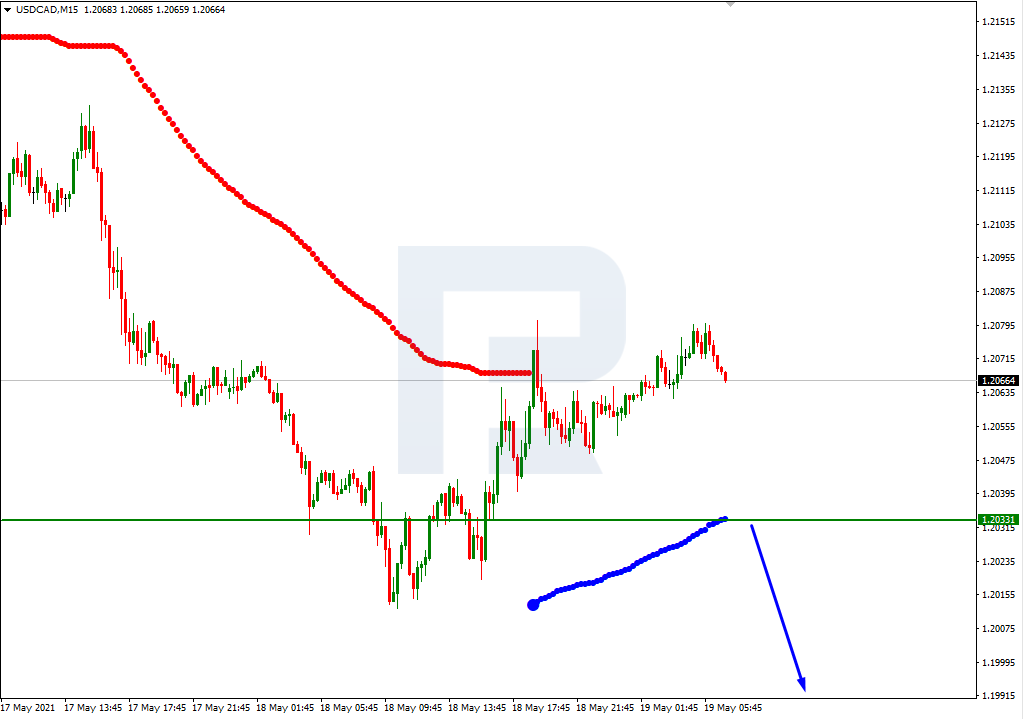
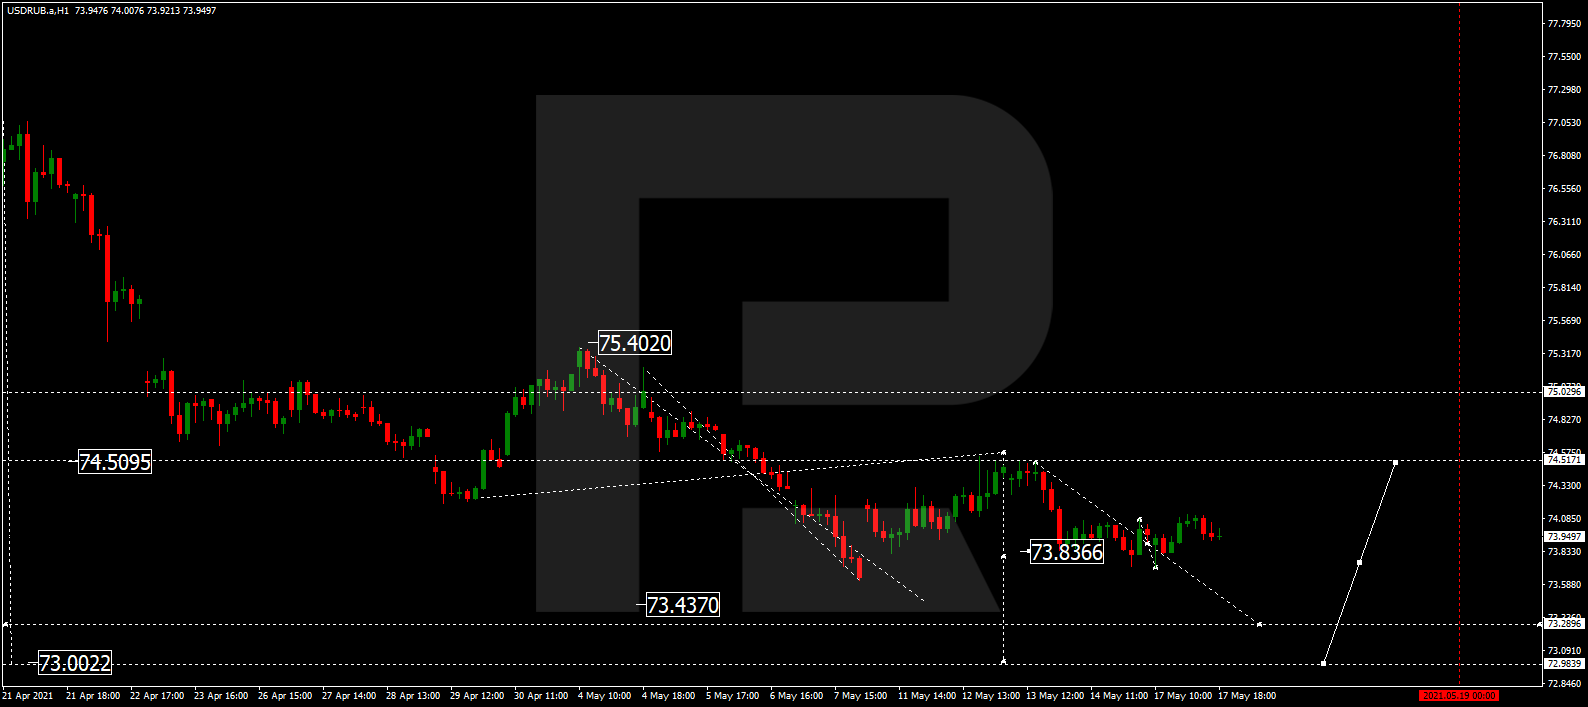
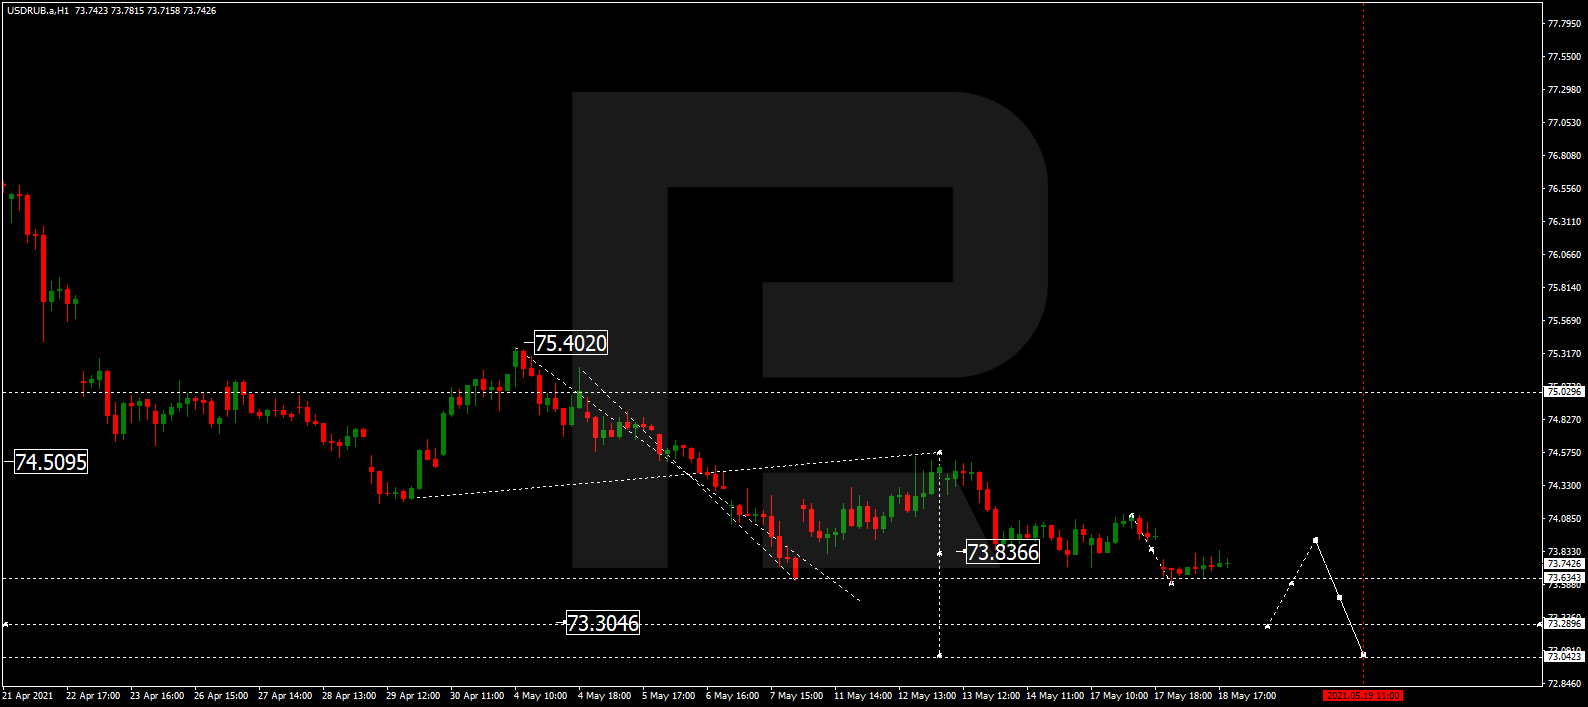
USDRUB, “US Dollar vs Russian Ruble”
USDRUB is still consolidating around 73.83; it has expanded the rage down to 73.65. Today, the pair may return to 73.83 and test it from below. After that, the instrument may resume trading within the downtrend with the short-term target at 73.00.
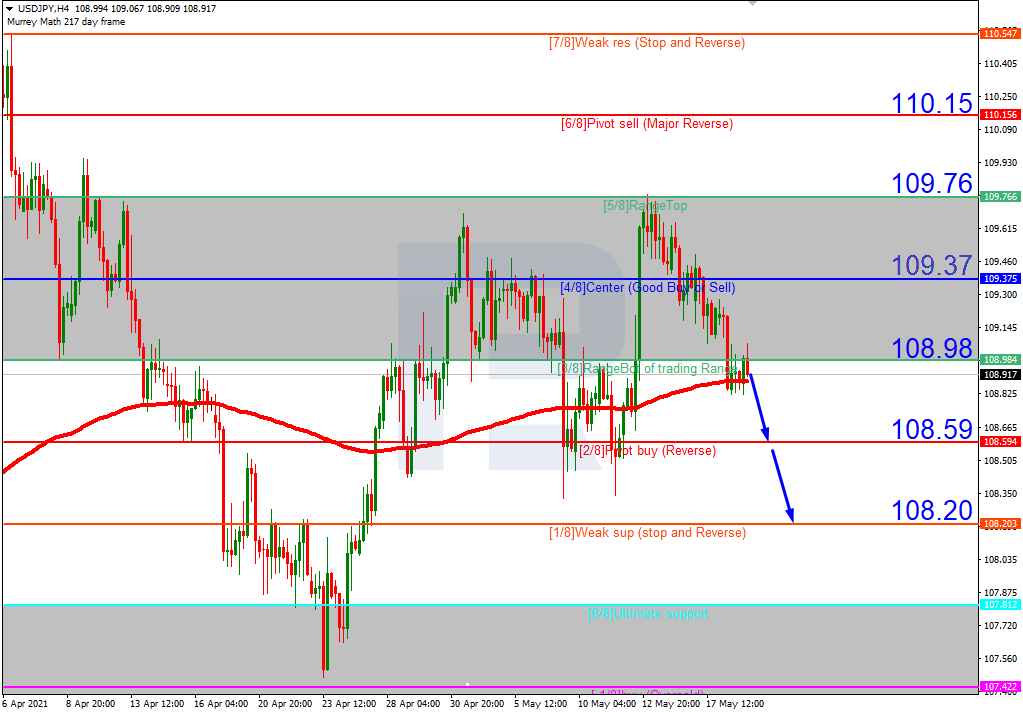
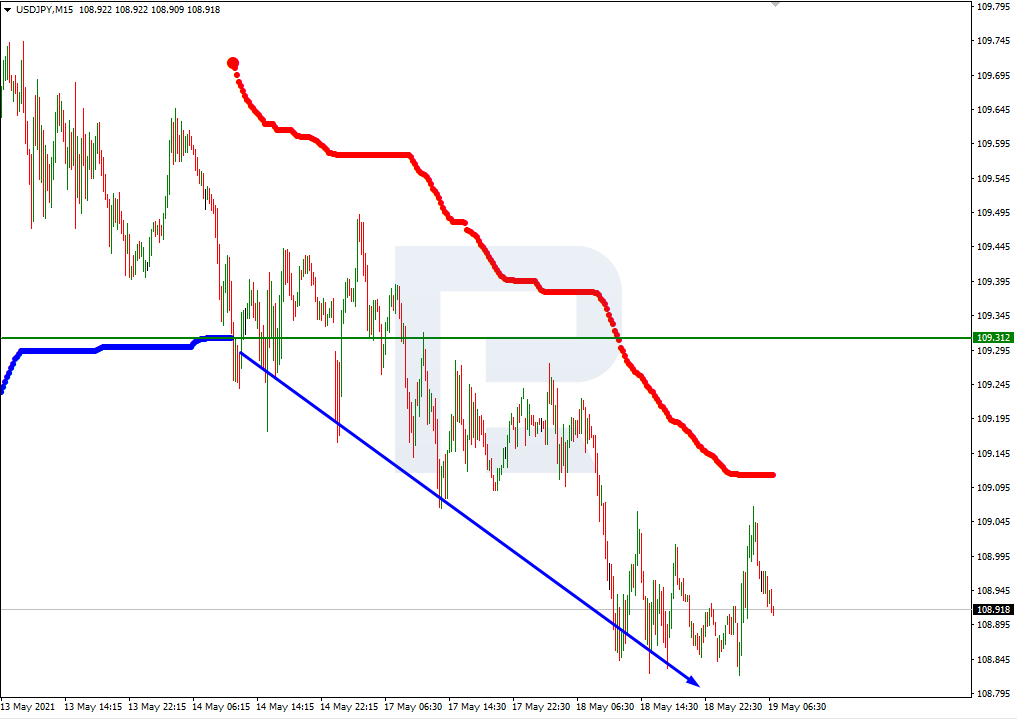
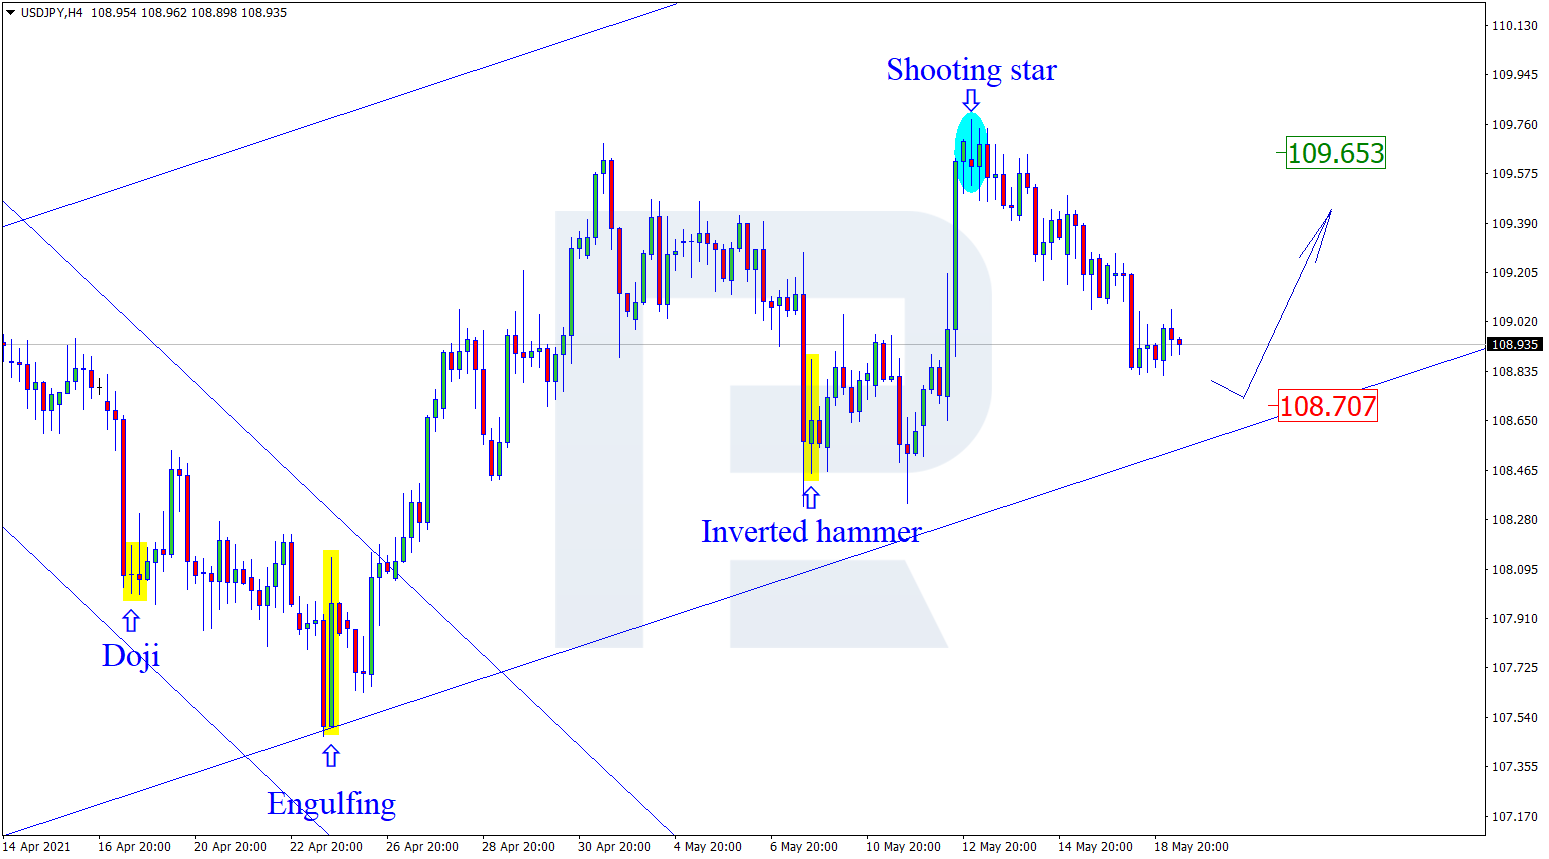
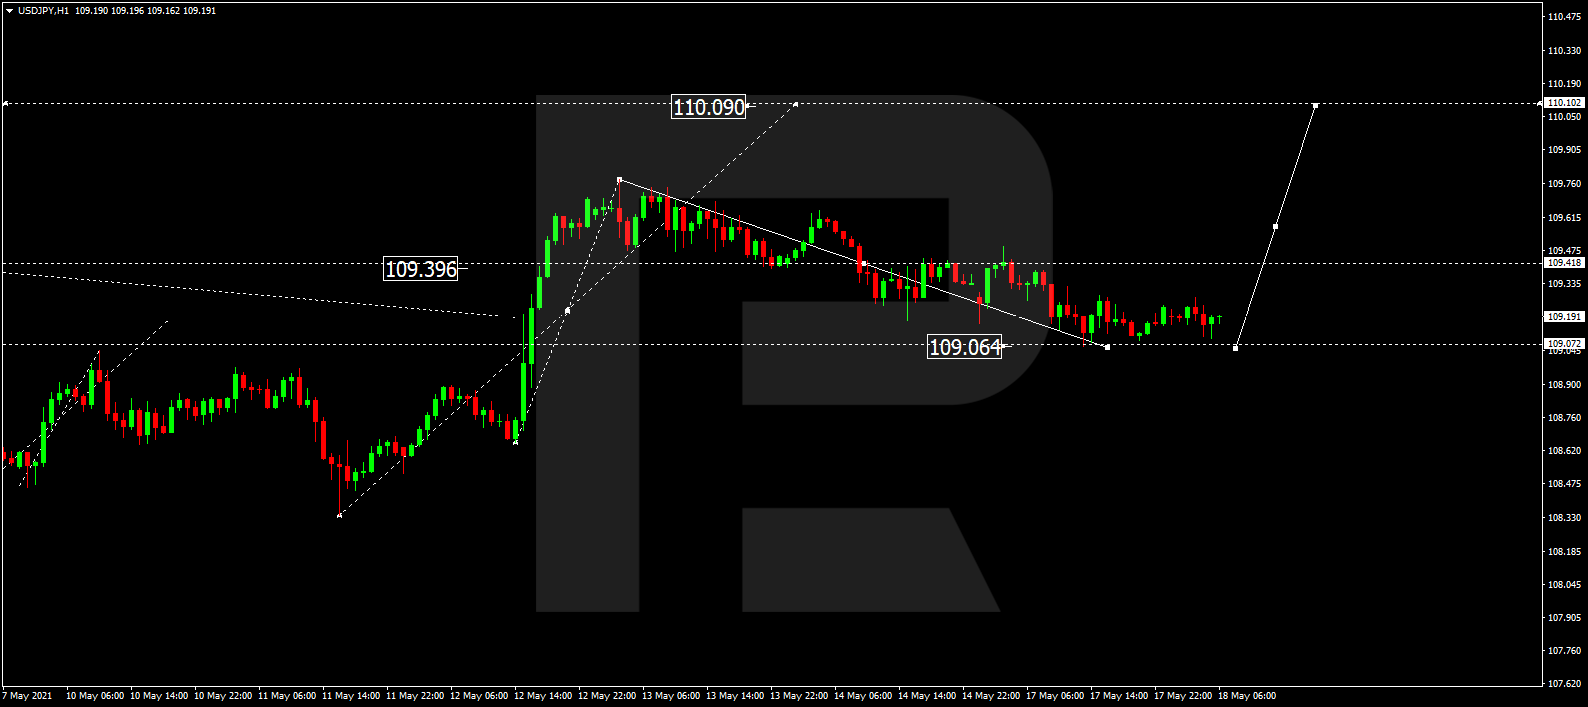
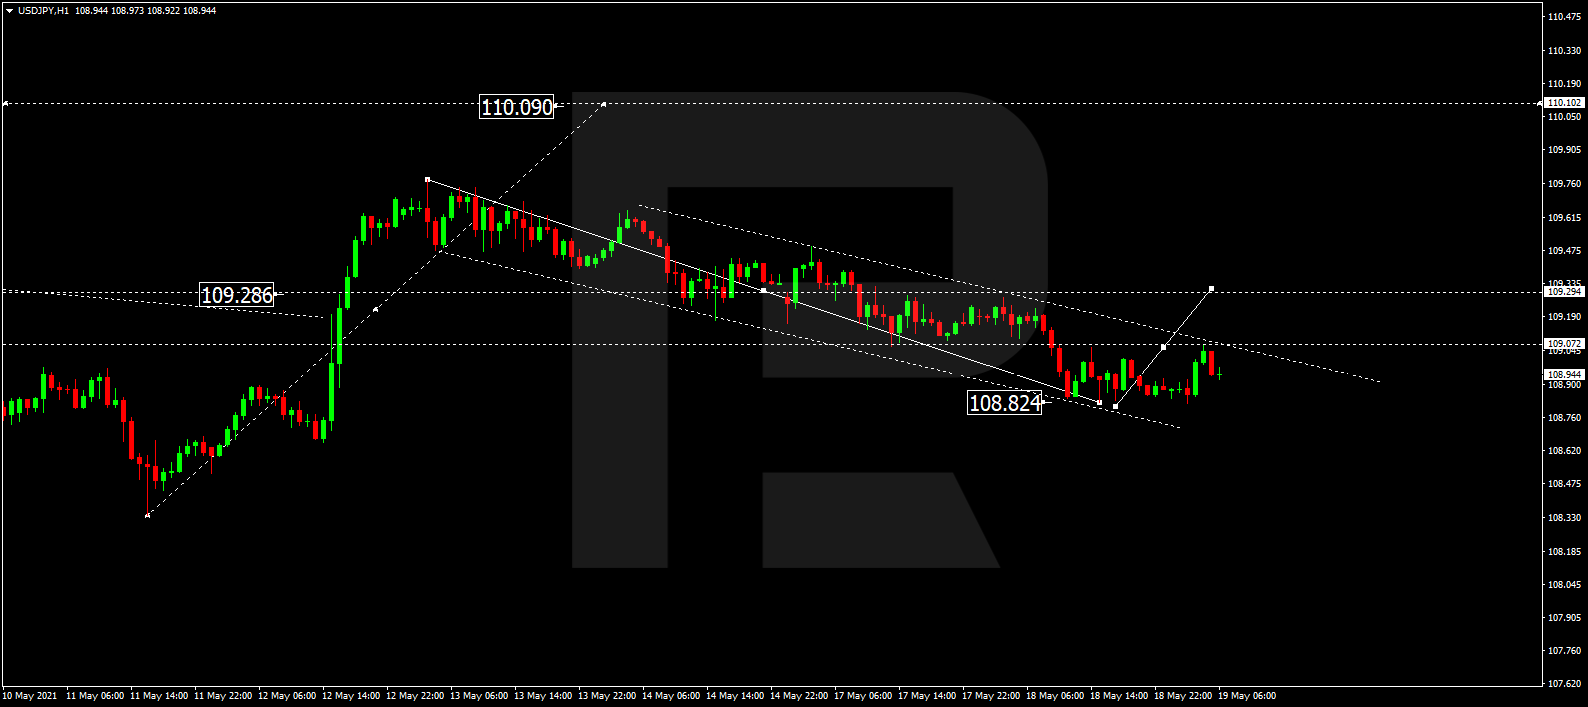
USDJPY, “US Dollar vs Japanese Yen”
After reaching 108.83, USDJPY continues falling; right now, it is forming a new consolidation range above the above-mentioned level. If later the price breaks this range to the upside, the market may form one more ascending structure to break 109.30 and then continue trading within the uptrend with the short-term target at 110.10.
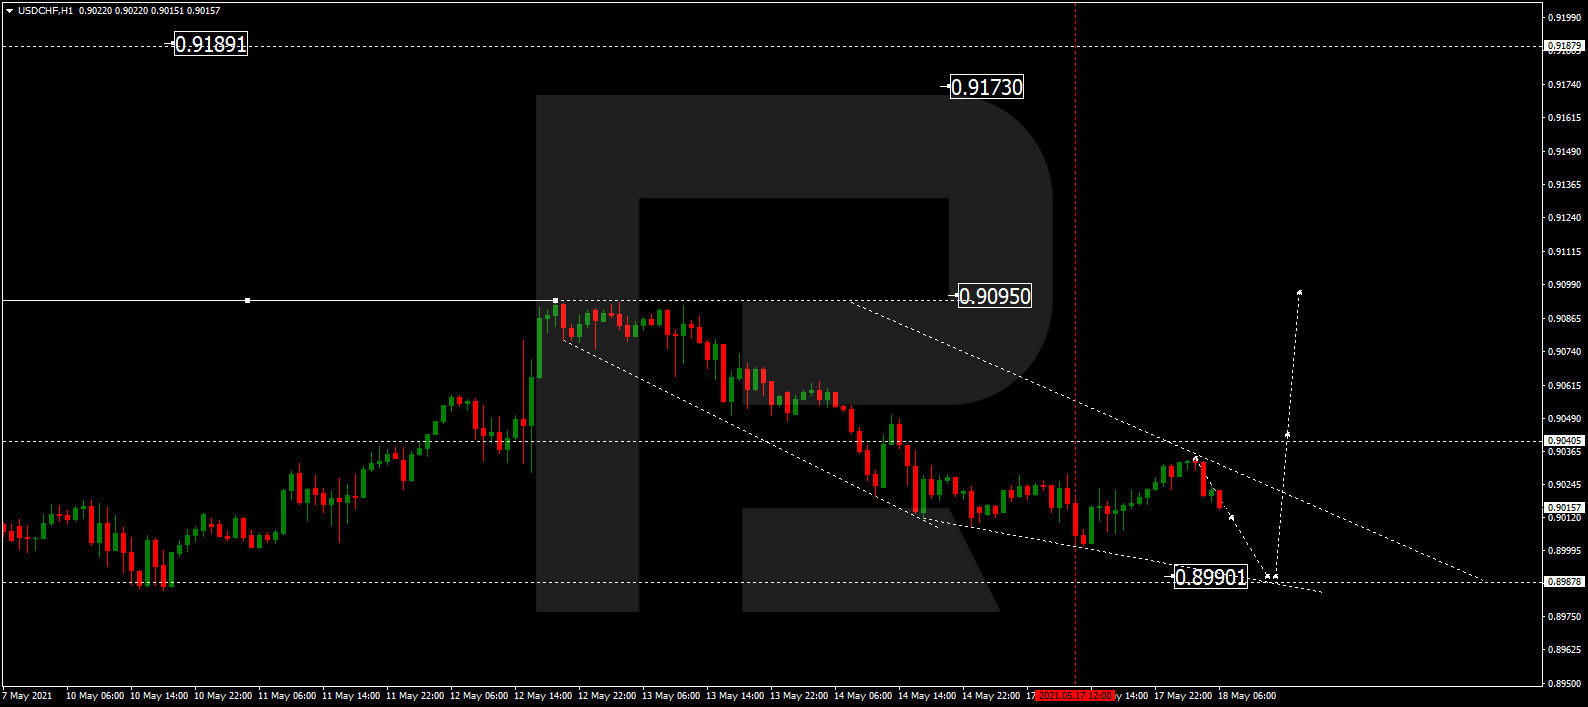
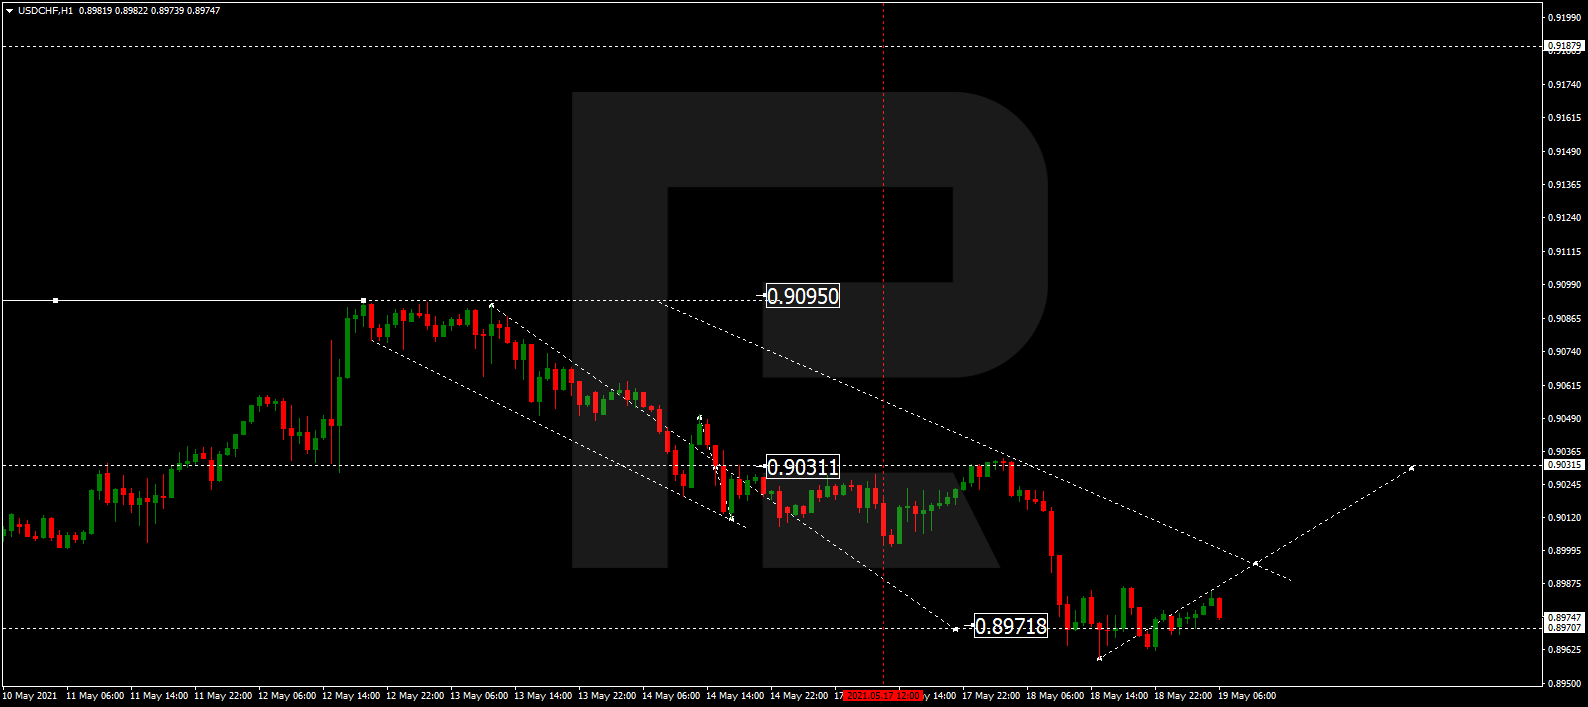
USDCHF, “US Dollar vs Swiss Franc”
After finishing the descending wave at 0.8971, USDCHF is consolidating above this level. Possibly, the pair may break the range to the upside and reach 0.9030. After that, the instrument may break this level as well and continue trading upwards with the target at 0.9095.
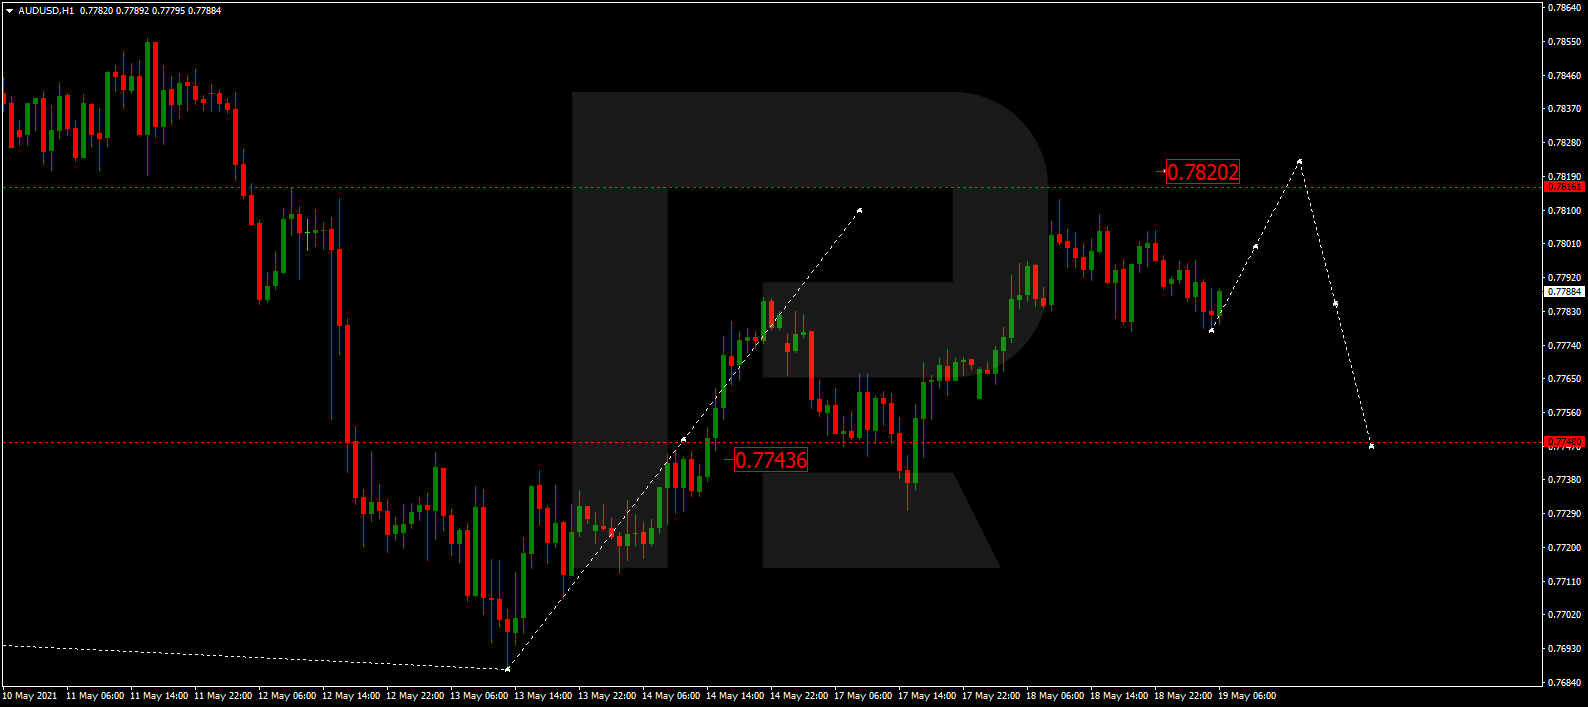
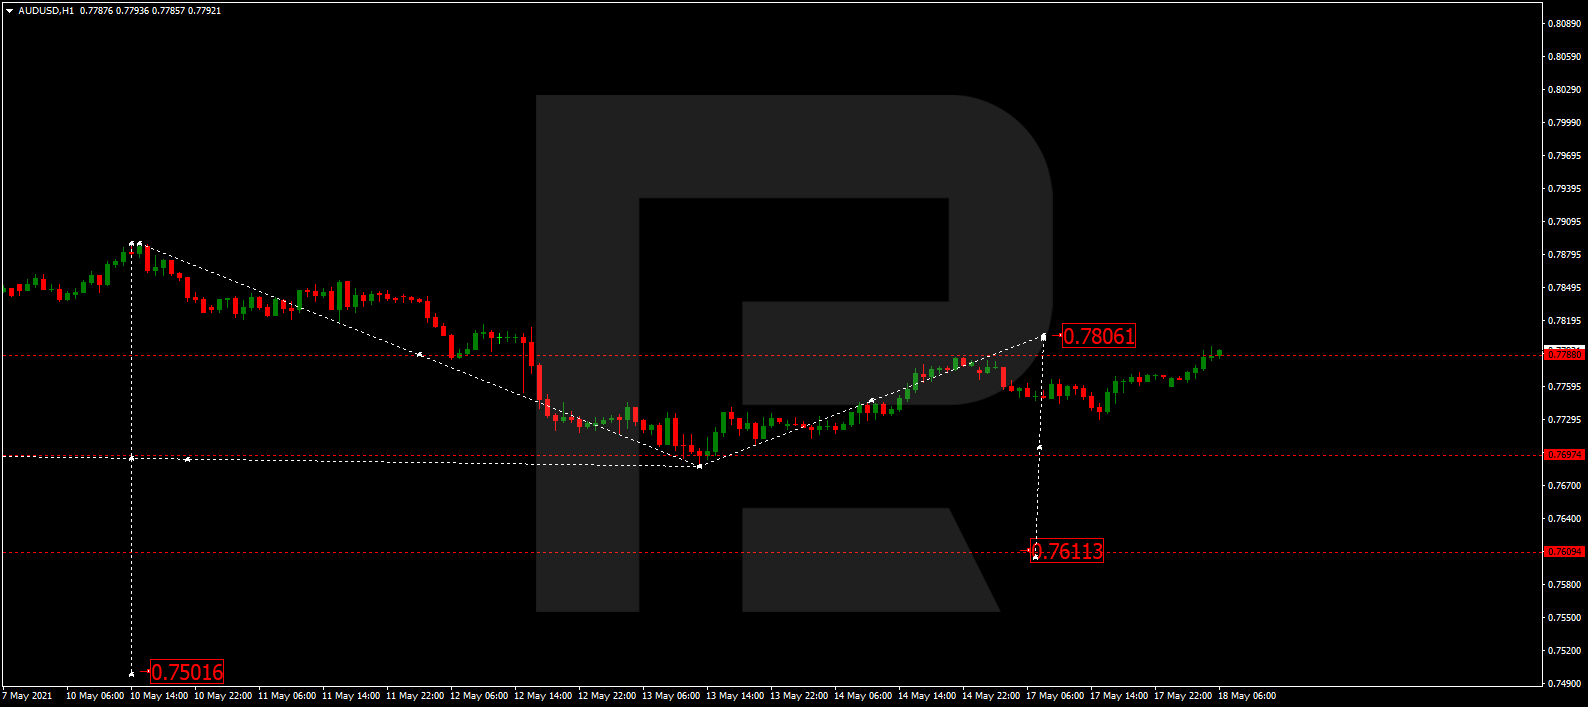
AUDUSD, “Australian Dollar vs US Dollar”
AUDUSD is growing towards 0.7820 and may later start another decline to reach 0.7743, thus forming a new consolidation range between these two levels. If the price breaks this range to the upside, the market may form one more ascending structure to reach 0.7900; if to the downside – resume falling with the target at 0.7611.