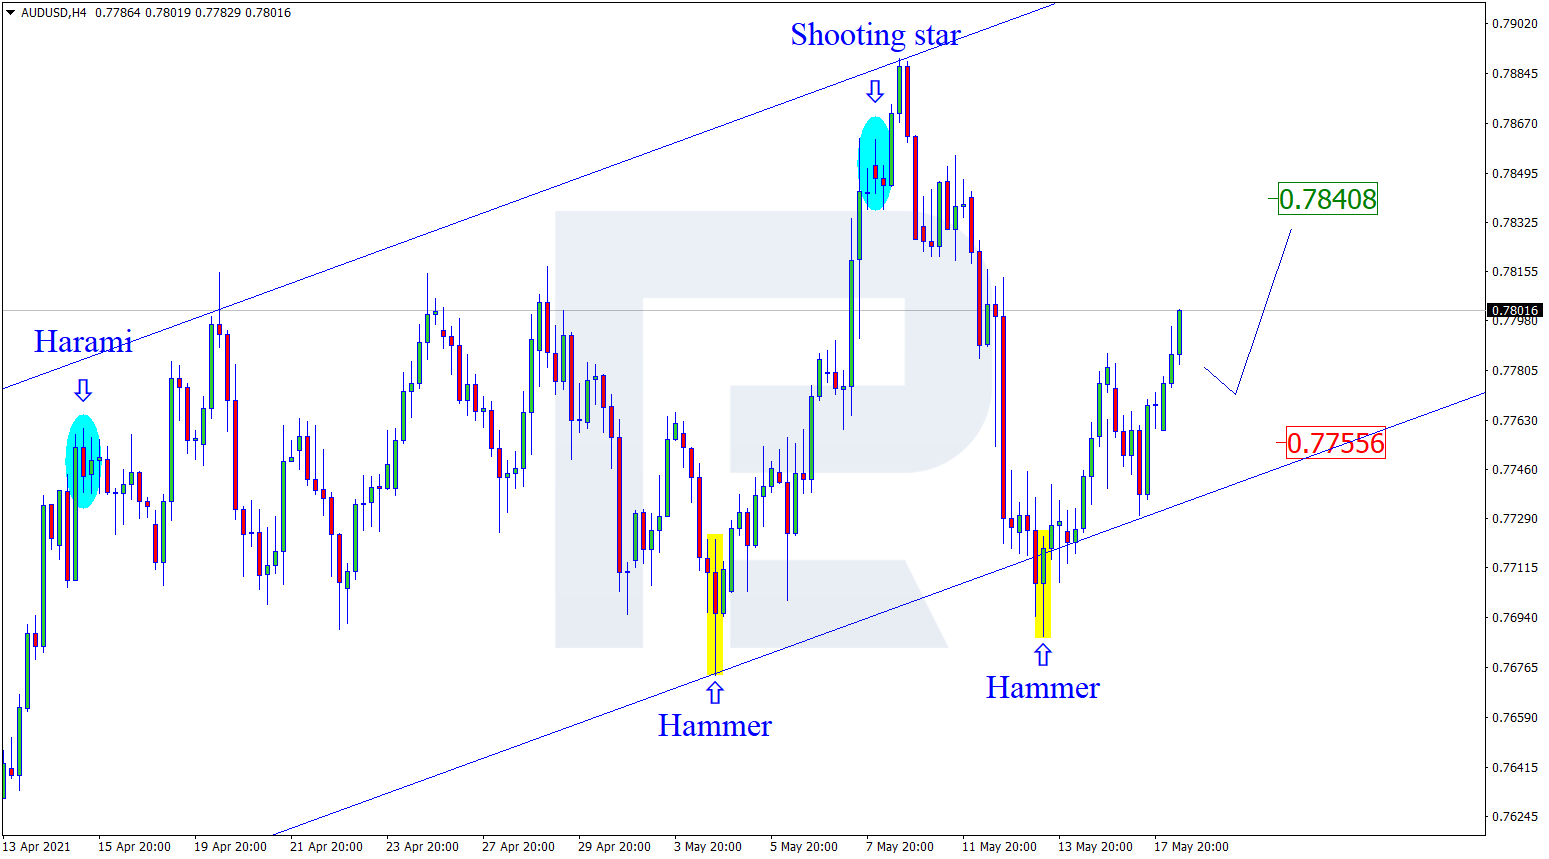
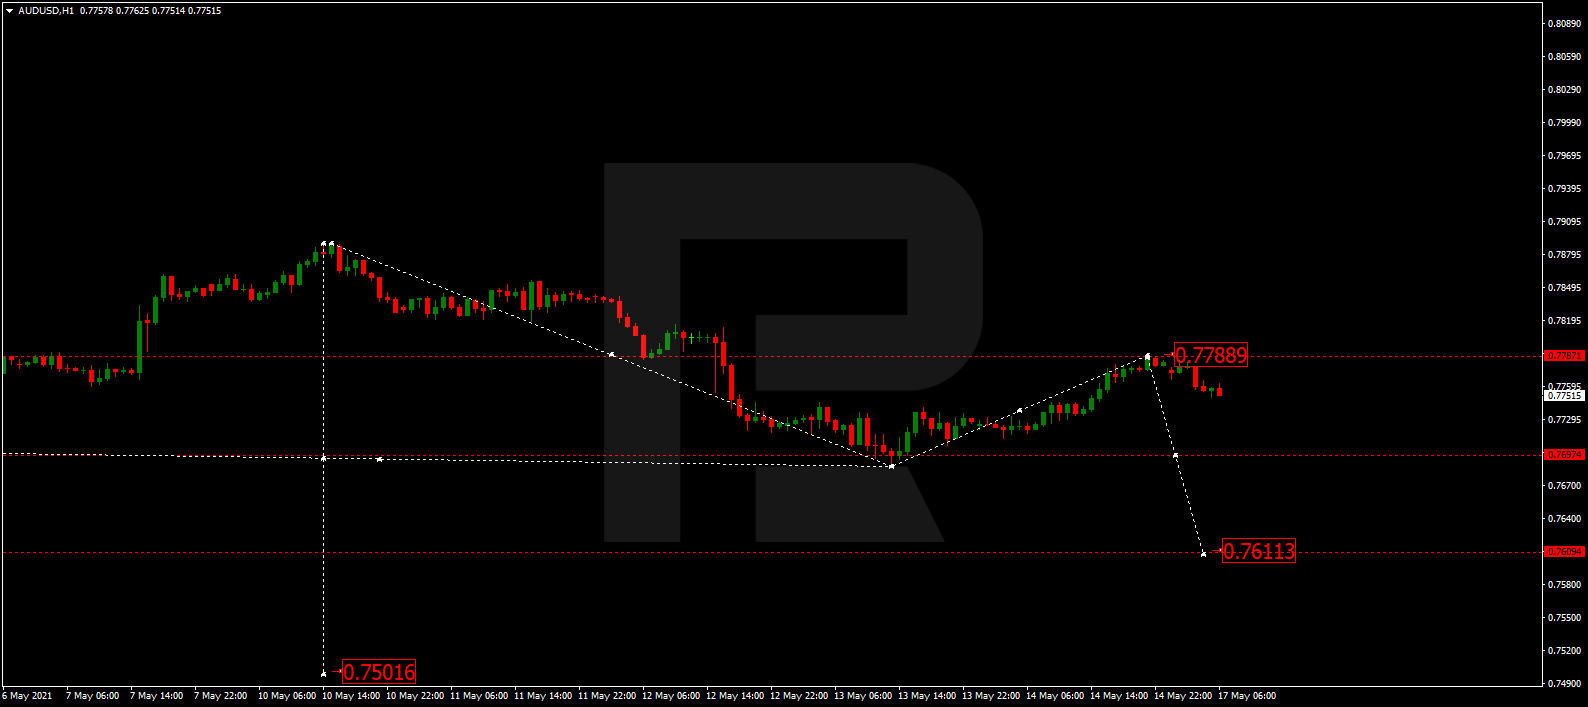
AUDUSD, “Australian Dollar vs US Dollar”
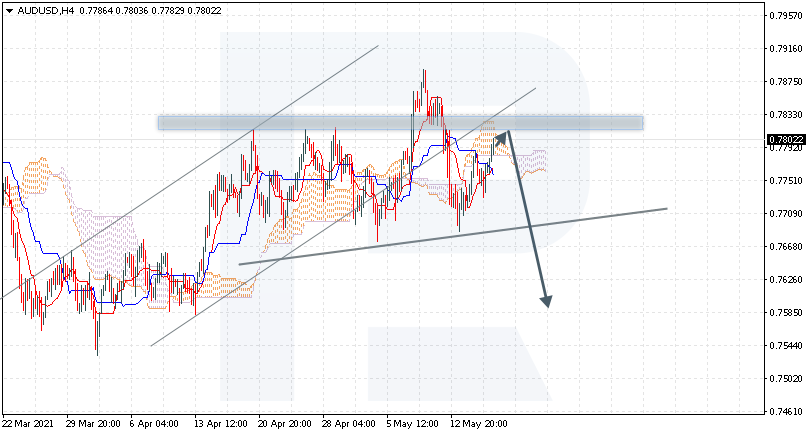
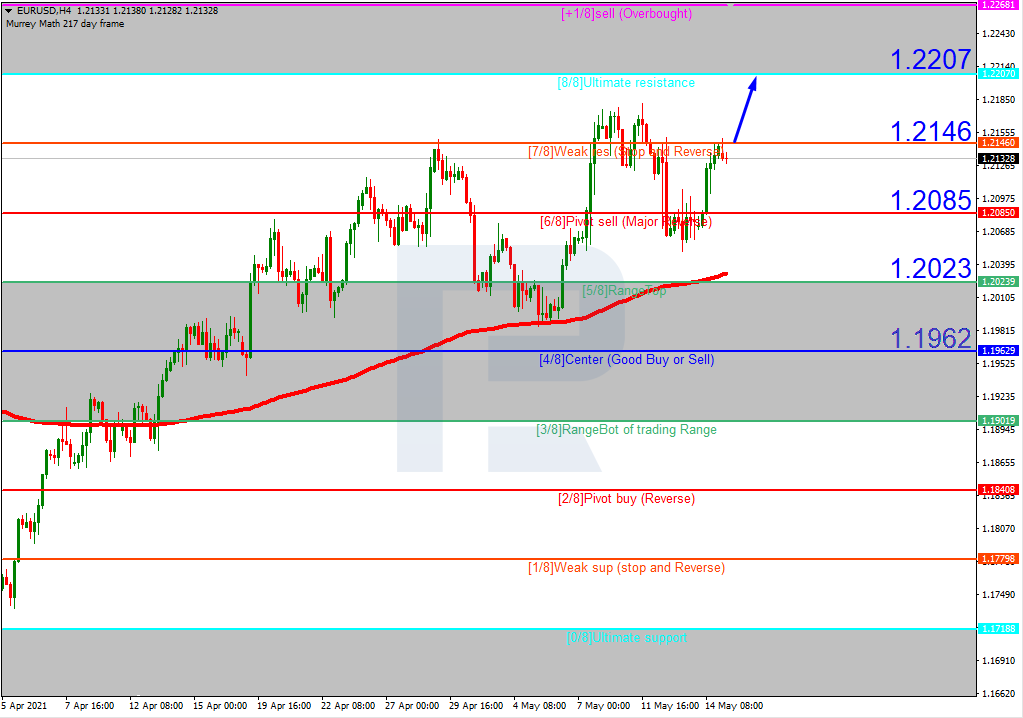
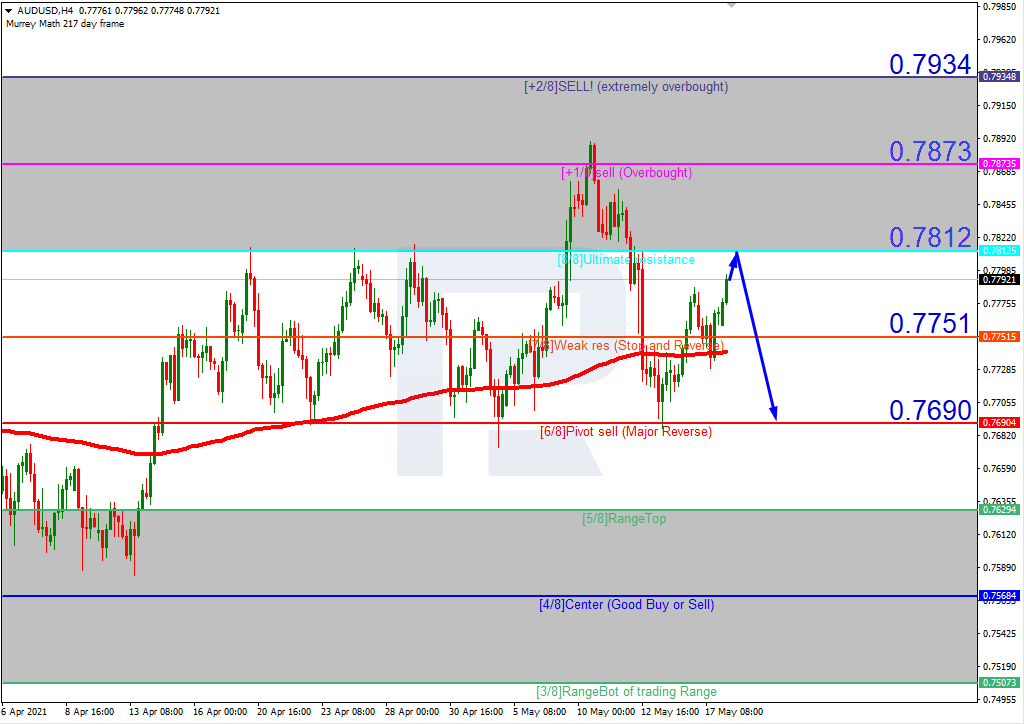
In the H4 chart, AUDUSD is heading towards the “overbought area”. In this case, the price is expected to test 8/8, rebound from it, and then resume moving downwards to reach the support at 6/8. However, this scenario may be canceled if the price breaks 8/8 to the upside. After that, the instrument may continue growing towards the resistance at +1/8.

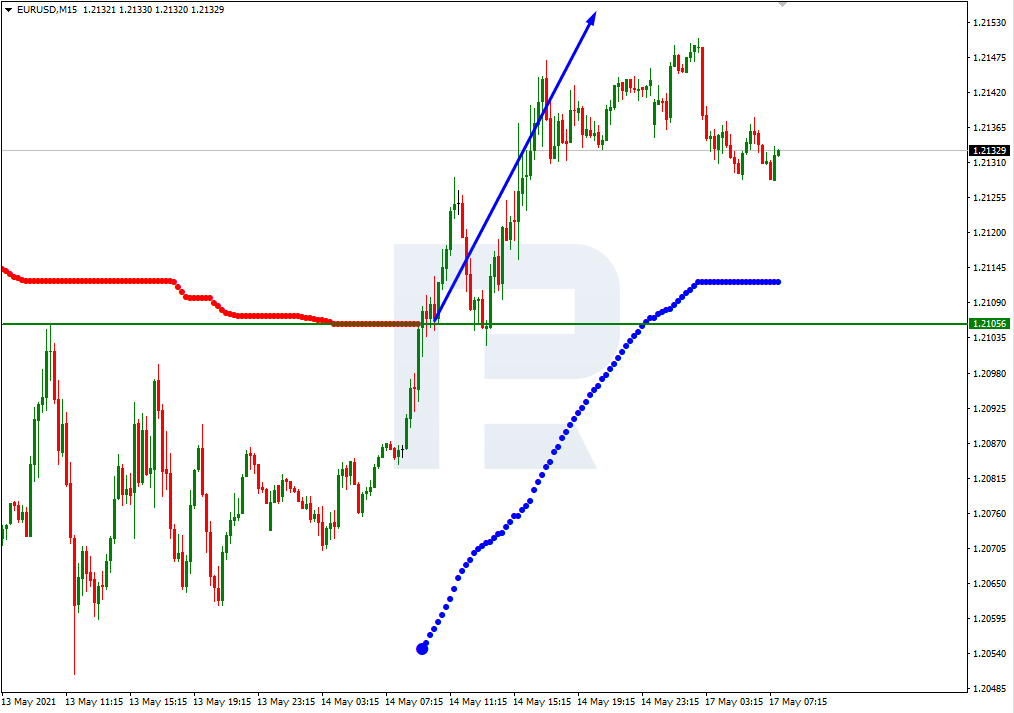
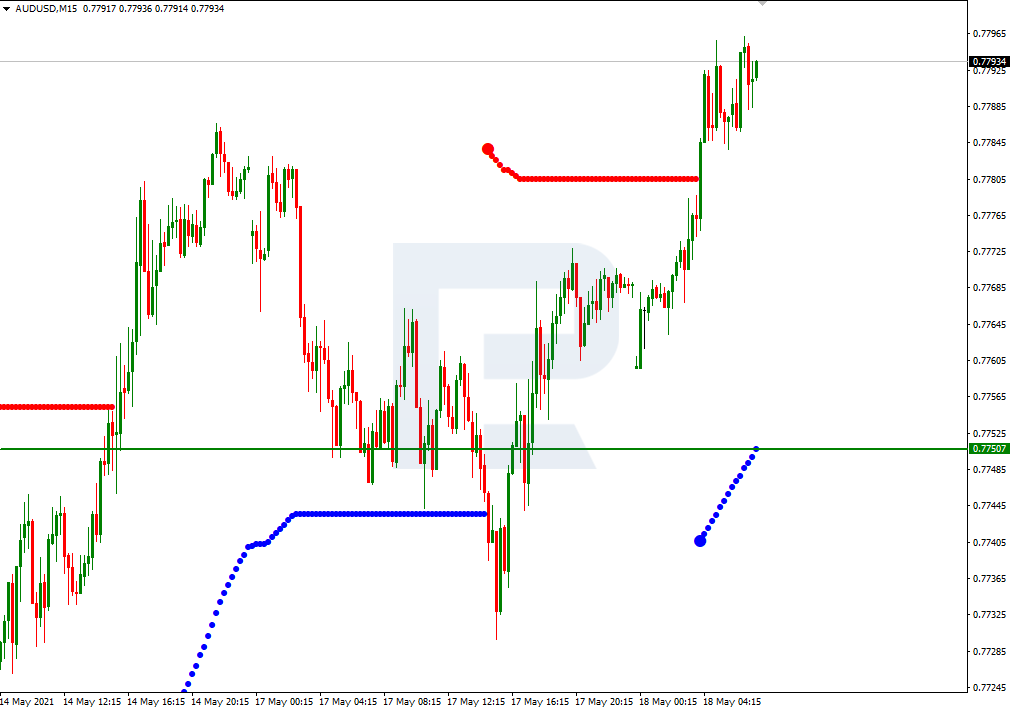
As we can see in the M15 chart, the downside line of the VoltyChannel indicator is pretty far away from the price, that’s why the pair may resume the descending tendency only after rebounding from 8/8 from the H4 chart.
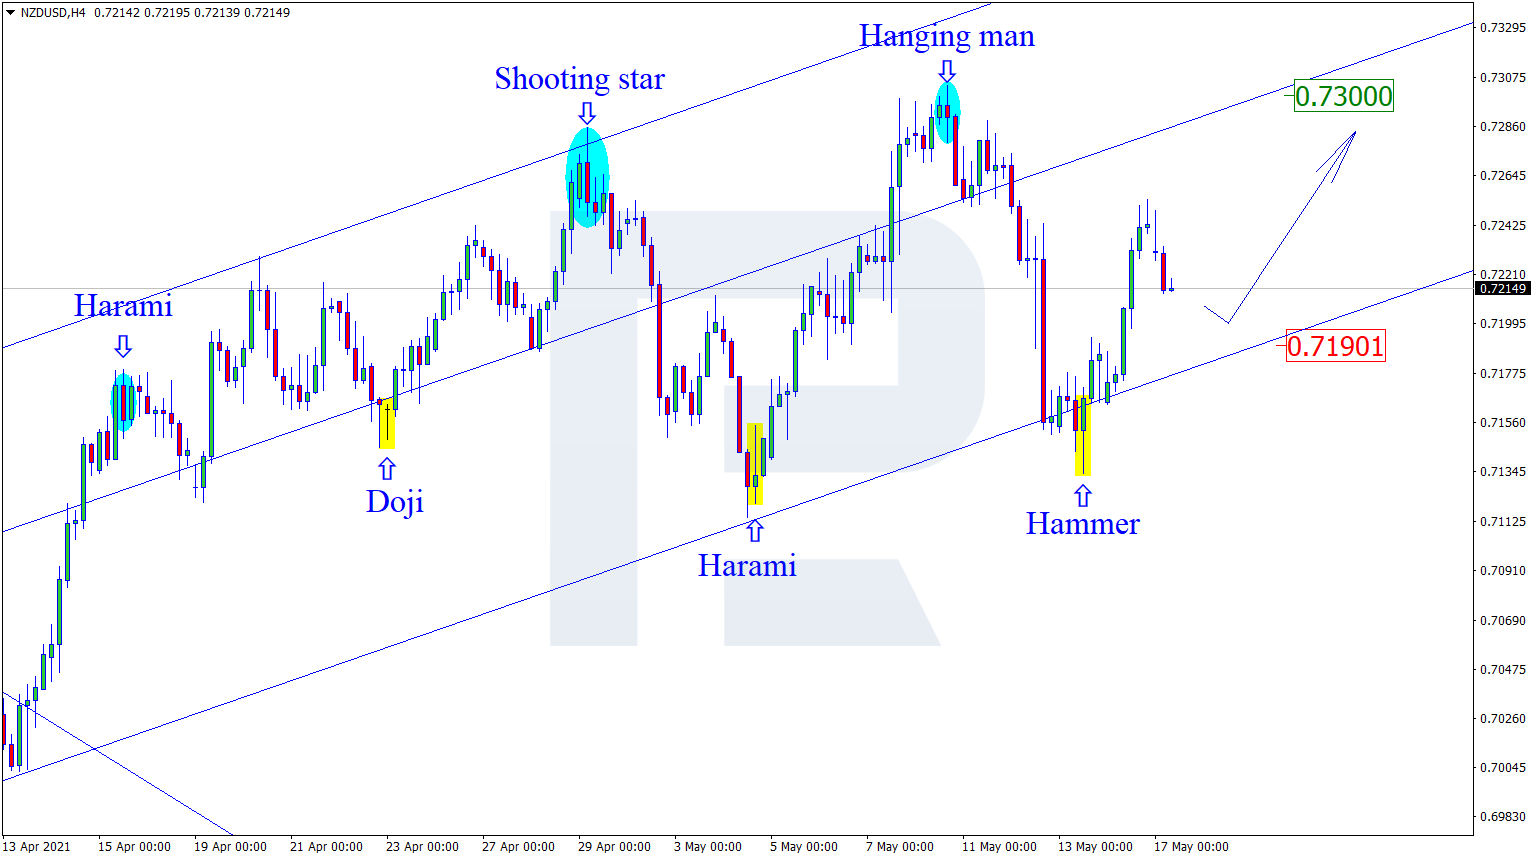
NZDUSD, “New Zealand Dollar vs US Dollar”
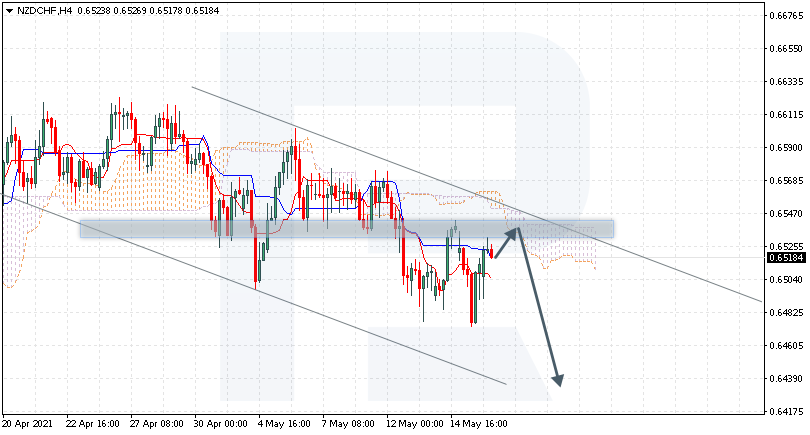
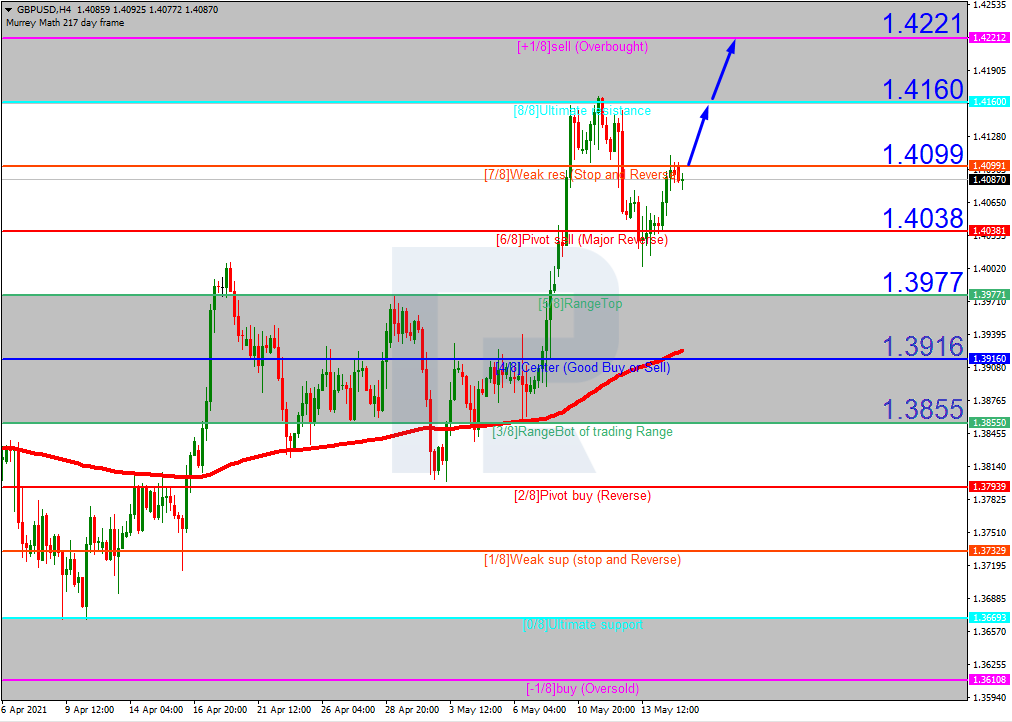
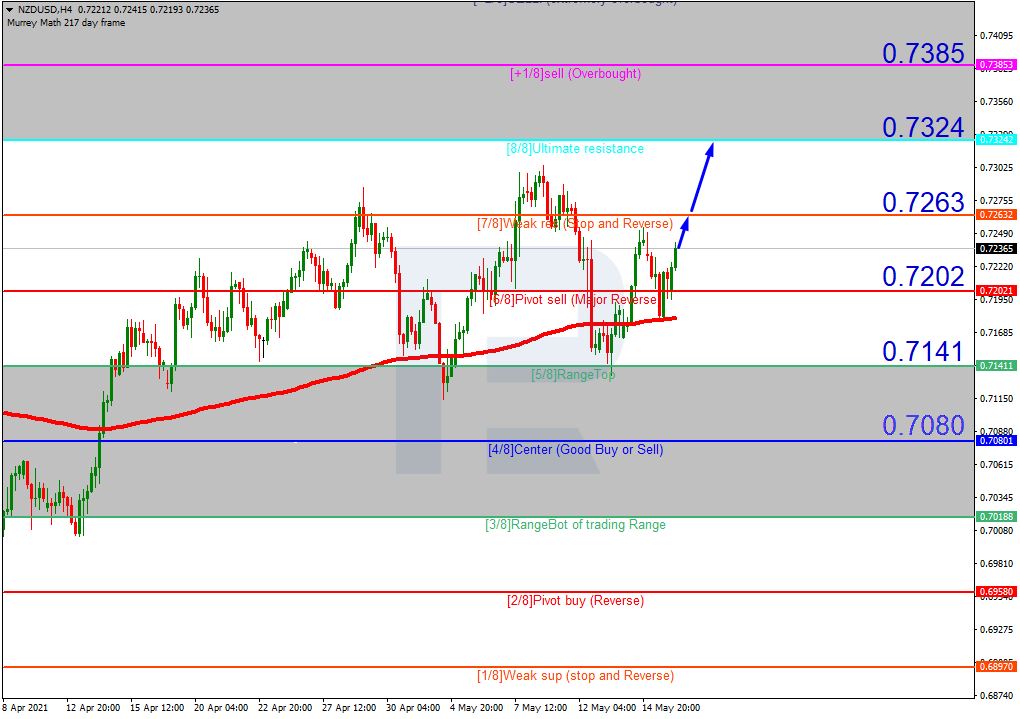
In the H4 chart, NZDUSD is trading above the 200-day Moving Average to indicate an ascending tendency. In this case, the price is expected to test 7/8, break it, and then continue growing to reach the resistance at 8/8. However, this scenario may no longer be valid if the price breaks 6/8 to the downside. In this case, the instrument may fall towards the support at 5/8.
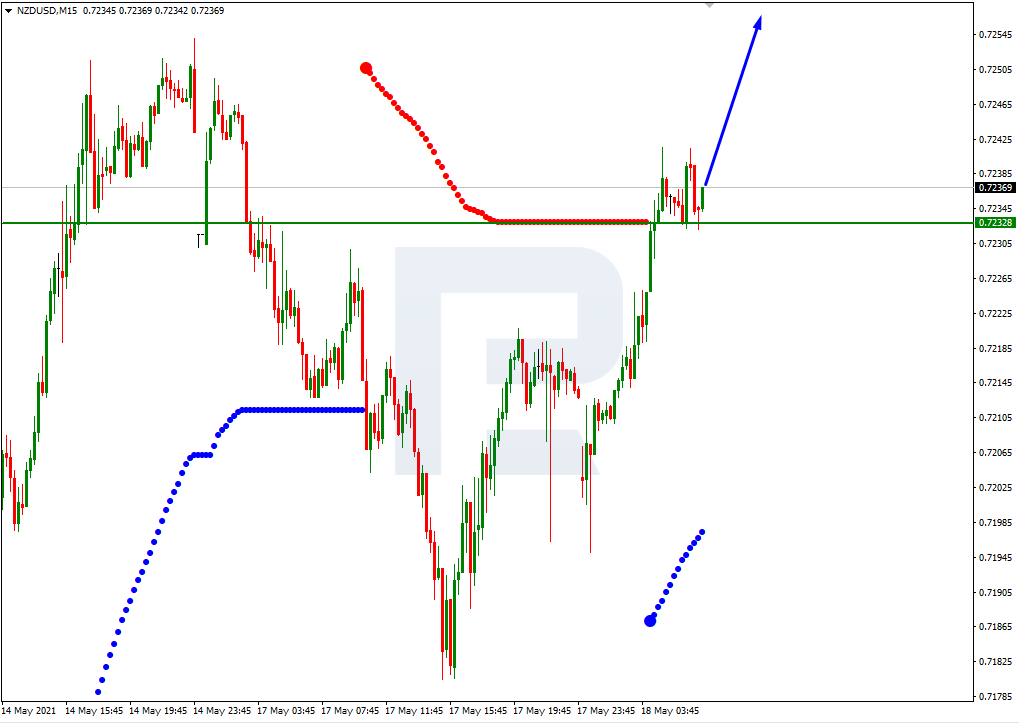
As we can see in the M15 chart, the pair has broken the upside line of the VoltyChannel indicator and, as a result, may continue its growth.