rfxsignals October 3, 2025 No Comments

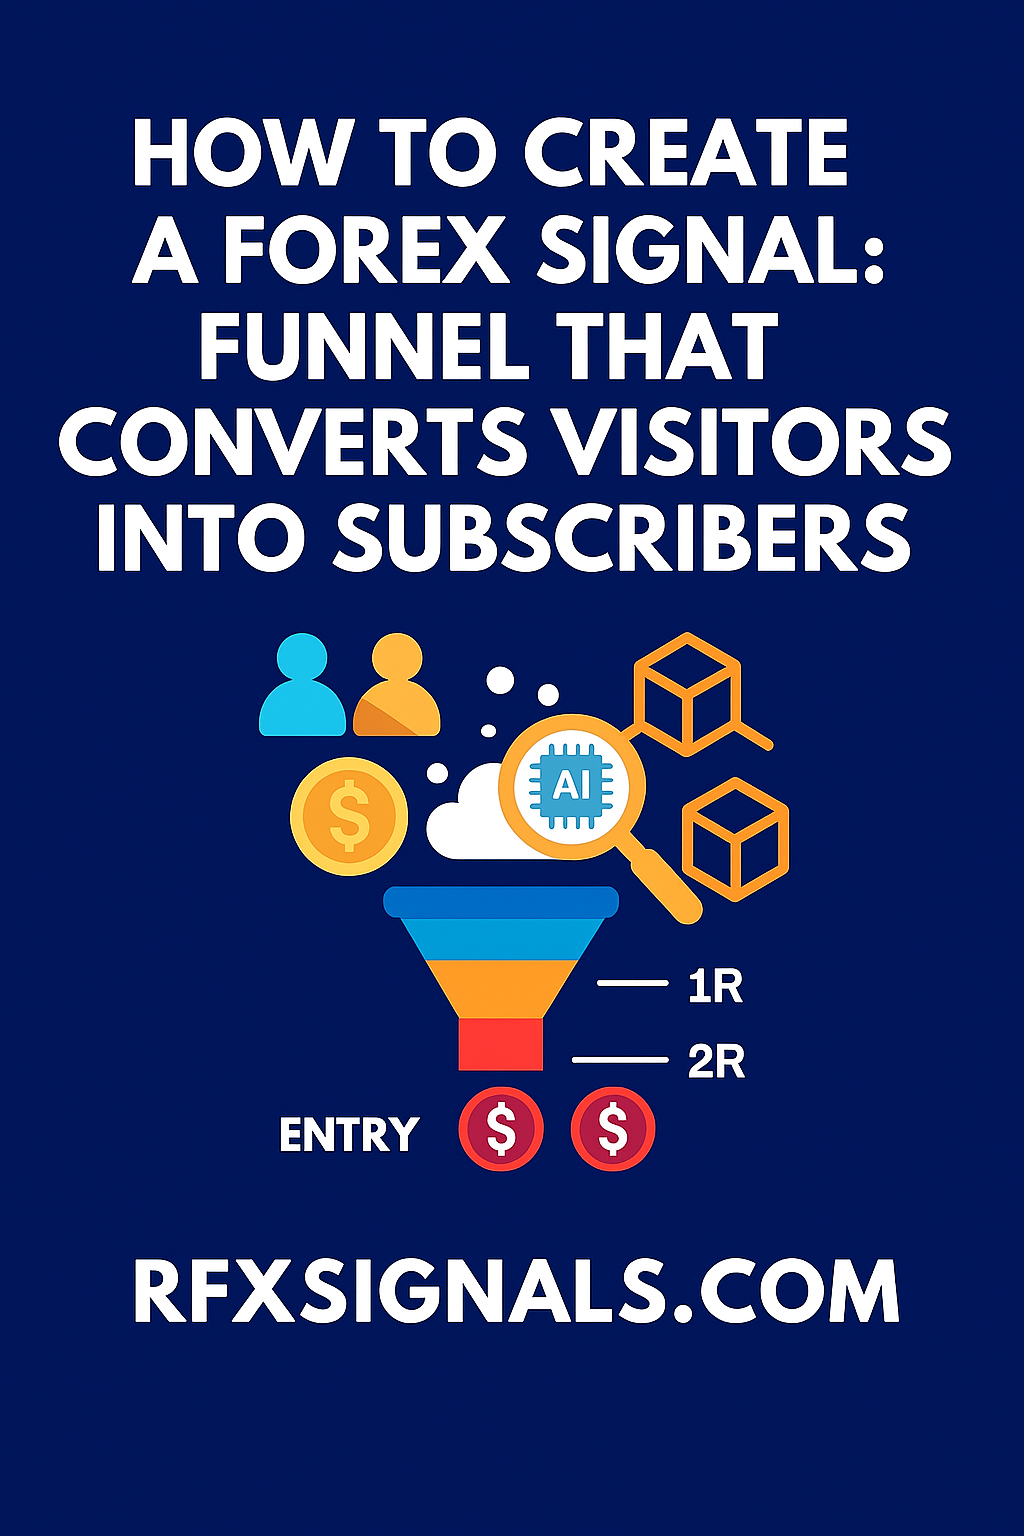
How to Create a Forex Signal Funnel That Converts Visitors into Subscribers

How to Create a Forex Signal Funnel That Converts Visitors into Subscribers
How to Create a Forex Signal Funnel That Converts Visitors into Subscribers | {{SITE_NAME}}

How to Create a Forex Signal Funnel That Converts Visitors into Subscribers

By • Estimated read: 8–10 minutes

Quick summary: A high-converting Forex signal funnel combines targeted landing pages, effective lead magnets, friction-free CTAs (WhatsApp, Telegram, email), automated nurture sequences, and data-driven testing. Below is a practical, step-by-step blueprint you can implement in Elementor and scale for organic traffic or paid campaigns.

Building a funnel isn’t just about capturing emails — it’s about capturing the right leads and moving them through a predictable path from visitor → trial subscriber → paid member. For Forex sites, trust and perceived value are paramount. Your funnel must reduce friction, prove signal performance quickly, and provide social proof that converts skeptics into subscribers.

1. Define the funnel stages

A simple, effective funnel has four stages:

  1. Attract: organic blog posts, SEO pages, PPC ads, and social content driving traffic to a landing page.
  2. Capture: landing page with lead magnet and clear CTA (WhatsApp, email, or Telegram opt-in).
  3. Nurture: automated email/WhatsApp sequences delivering value and proving signal credibility.
  4. Convert & Retain: onboarding, trial offers, member-only content, and upsell pathways for paid signals.

2. High-converting landing page elements

Your Elementor landing page should be lightweight and focused. Include:

  • Clear headline: promise a specific benefit (e.g., “Daily Forex Signals — Backtested & Real-Time”).
  • Concise subheadline: one-line reason to trust you (track record, transparency).
  • Lead magnet: free PDF, 3-day trial, or a live signal sample to demonstrate real value.
  • Social proof: time-stamped screenshots, case studies, or brief testimonials.
  • Primary CTA: WhatsApp/Email opt-in (use `wa.me` for mobile-friendly WhatsApp links).
  • Secondary CTA: “Learn More” to internal pages that support SEO and inbound links.

3. Choosing the best lead magnet for Forex signals

Lead magnet examples that convert well in trading niches:

  • “Top 5 High-Probability Setups” PDF with screenshots and historical results.
  • 3-day trial of live signals with reduced risk sizing.
  • Mini-course: “How We Build a Signal” — short videos + checklist.
  • Trade journal template (spreadsheet) pre-filled with example signals.

Pick one high-value magnet and A/B test the offer language and format.

4. Friction-free signup: forms, WhatsApp & Telegram

Minimal friction gets more subscribers. Options to consider:

  • One-field forms: ask only for email or phone number.
  • WhatsApp quick opt-in: `https://wa.me/{{WHATSAPP_NUMBER}}?text=...` prefilled message makes mobile conversions instant.
  • Telegram opt-in: for users who prefer channel-based delivery — `t.me/{{TELEGRAM_USERNAME}}`.

Provide alternative contact methods (email + WhatsApp) so users choose what’s easiest.

5. Nurture sequences that prove value

After capture, a carefully timed automation builds credibility and nudges conversion:

  1. Welcome message (immediate): deliver lead magnet and set expectations.
  2. Proof email (24 hours): show time-stamped past signals and outcomes.
  3. Education (day 3–7): short lessons on reading signals and risk management.
  4. Trial highlight (day 7–10): limited-time trial or discounted first month.
  5. Retarget & re-engage: if no conversion, use targeted content or WhatsApp reply prompts.

6. Segmentation and personalization

Not all visitors are the same. Segment by:

  • Experience level (beginner, intermediate, pro)
  • Preferred instrument (Forex pairs, crypto, indices)
  • Preferred delivery channel (WhatsApp, Telegram, Email)

Personalized messages increase conversion rates — e.g., “Here’s how EURUSD signals work” vs “Here’s our crypto signal process”.

7. Proof, transparency & trust signals

Forex audiences are skeptical. Use:

  • Public performance dashboards (daily P&L snapshots).
  • Third-party verification where possible (Myfxbook, FX Blue links — add outbound links for credibility).
  • Time-stamped screenshots and short video walk-throughs of live trades.

8. Pricing strategy & trial mechanics

Good strategies:

  • Free trial with limits: give sample signals but cap size or access duration.
  • Low entry pricing: a small monthly fee to qualify serious subscribers.
  • Tiered plans: Basic (daily signals), Pro (scaling entries + chat), VIP (1:1 support).

9. Measure, test & optimize

Key metrics to track:

  • Landing page conversion rate (visitors → leads)
  • Lead-to-subscriber conversion (trial → paid)
  • Churn rate and lifetime value (LTV)
  • Cost per acquisition (CPA) if using paid ads

Run A/B tests on headlines, lead magnets, CTA colors, and WhatsApp vs email opt-ins. Change only one element per test and run for a statistically significant period.

10. Automation stack & recommended tools

Lightweight stack suggestions:

  • Elementor (landing pages + forms)
  • Email automation: MailerLite, ConvertKit, or ActiveCampaign
  • WhatsApp business + `wa.me` links for direct chat
  • Telegram channel + bot for broadcast automation
  • Analytics: Google Analytics + Google Tag Manager + Funnel tracking
SEO & Link Strategy: Use internal links to related posts (signals, backtests, performance) and add outbound links to authoritative resources (regulatory guidance, industry tools). This improves topical relevance and link-building potential.

11. Retention: turning subscribers into long-term members

Retention beats acquisition. Tactics that work:

  • Weekly performance summaries and transparent P&L.
  • Monthly Q&A calls or webinars with trade rationale.
  • Member-only content and progressively valuable upgrades.
  • Referral incentives to turn members into evangelists.

12. Example funnel blueprint (practical)

Traffic source (SEO blog) → Landing page with PDF lead magnet → WhatsApp quick opt-in → Automated welcome + proof email → 3-day trial signals → Day 7 trial review & upsell → Paid onboarding with VIP channel access. Monitor conversion at each step and iterate monthly.

Conclusion

Building a high-converting Forex signal funnel requires clarity, proof, and low friction. Use Elementor to build fast landing pages, a WhatsApp/Telegram-first approach for instant conversions, and automation to scale nurture flows. Measure everything and iterate — small lifts across the funnel compound into large growth.
Disclaimer: Trading carries risk. This article is educational and not financial advice. Test funnel changes in small steps and measure impact before scaling.
rfxsignals October 3, 2025 No Comments

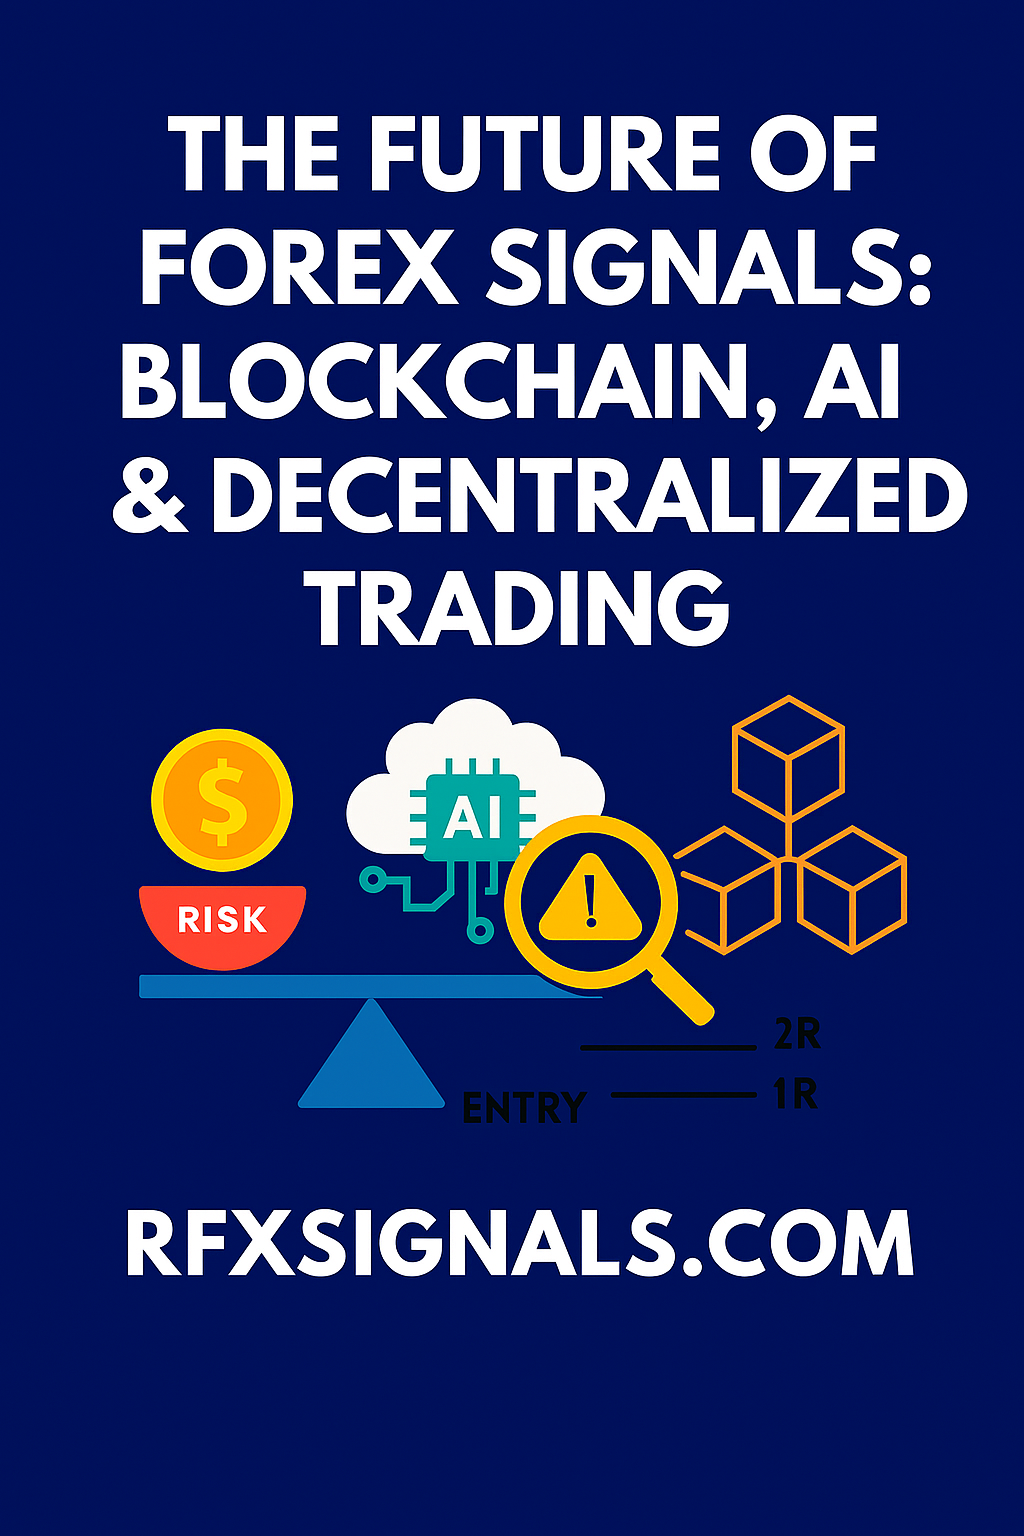
The Future of Forex Signals: Blockchain, AI & Decentralized Trading

The Future of Forex Signals: Blockchain, AI & Decentralized Trading

The Future of Forex Signals: Blockchain, AI & Decentralized Trading

The Forex trading world is evolving at a rapid pace. With the integration of Blockchain, Artificial Intelligence (AI), and Decentralized Trading platforms, the future of Forex signals looks more transparent, efficient, and profitable. In this guide, we will explore how these technologies are reshaping Forex trading and what traders can expect in the coming years.

1. Introduction to Forex Signals and Their Evolution

Forex signals have traditionally been generated by expert traders or trading software to guide others on when to buy or sell a currency pair. However, as markets become more complex and volatile, the demand for reliable, real-time, and transparent signals has grown significantly. This is where Blockchain, AI, and decentralized ecosystems come in to transform the industry.

2. The Role of Blockchain in Forex Signals

Blockchain technology ensures transparency and trust in Forex signals. By storing trade recommendations and results on an immutable ledger, traders can verify performance without manipulation.

  • Transparency: Every signal is recorded permanently.
  • Trustless environment: No middleman needed.
  • Fraud prevention: Impossible to alter past results.

3. Artificial Intelligence and Machine Learning in Forex

AI-powered algorithms analyze vast amounts of market data, detect hidden patterns, and predict potential outcomes. AI enhances the accuracy of signals by factoring in:

  • Market sentiment analysis
  • Historical price patterns
  • Volatility modeling
  • Risk-to-reward optimization

Machine learning allows systems to continuously learn and improve signal accuracy over time, making them far superior to traditional methods.

4. Decentralized Trading Platforms (DeFi in Forex)

Decentralized platforms eliminate intermediaries and give traders direct control of their funds and trades. These systems also allow peer-to-peer sharing of signals, ensuring:

  • Lower trading costs
  • Global accessibility
  • Greater security of funds
  • Democratization of trading signals

5. Benefits of Future Forex Signal Systems

The combination of Blockchain, AI, and decentralized platforms creates powerful advantages:

  • Transparency: No fake results.
  • Accuracy: AI-driven predictions.
  • Security: Decentralized data and funds.
  • Accessibility: Open to traders worldwide.

6. Challenges in Adopting These Technologies

Despite the potential, there are obstacles:

  • High cost of AI infrastructure
  • Regulatory uncertainties in decentralized systems
  • Technical knowledge required for adoption

7. The Road Ahead for Forex Traders

The future will likely see hybrid models where AI-driven signals are stored on blockchain ledgers and executed through decentralized platforms. This will give traders confidence, efficiency, and security.

🚀 Ready to Trade Smarter?

Join our community to access AI-powered, blockchain-backed Forex signals and trade with confidence.

Connect on WhatsApp Join on Telegram

© 2025 YourForexSite.com | All Rights Reserved.

rfxsignals October 3, 2025 No Comments

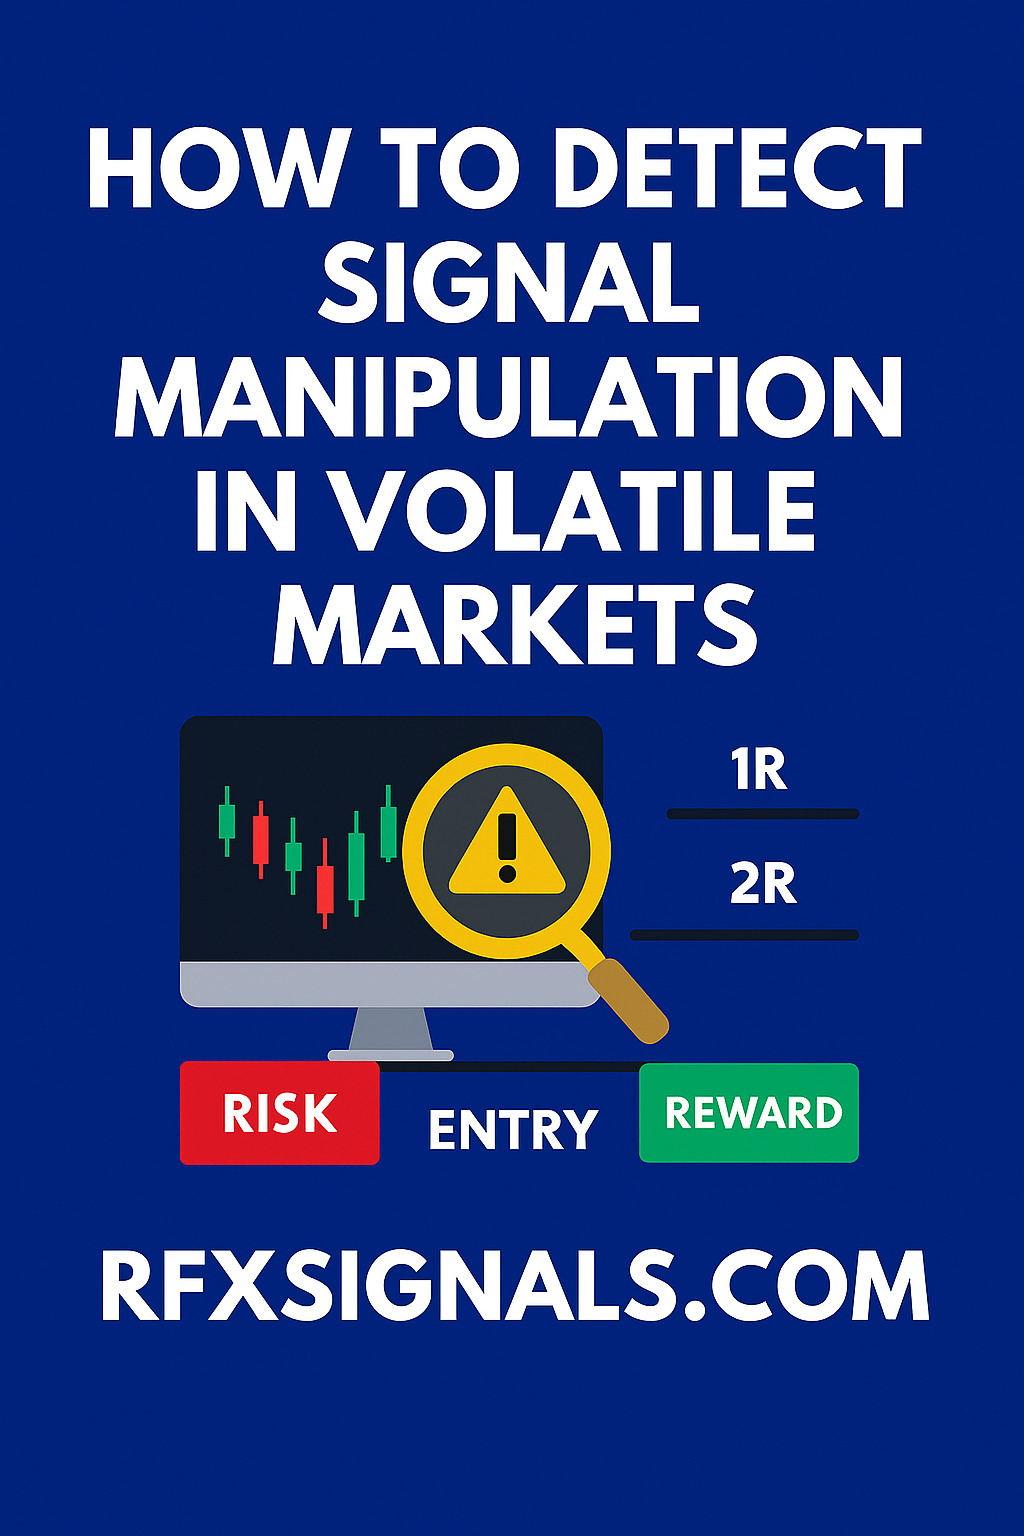
How to Detect Signal Manipulation in Volatile Markets

How to Detect Signal Manipulation in Volatile Markets
How to Detect Signal Manipulation in Volatile Markets | {{SITE_NAME}}

How to Detect Signal Manipulation in Volatile Markets

By Estimated read: 9–11 minutes

Overview: Volatile markets create fertile ground for legitimate signal noise and for deliberate signal manipulation. Knowing how to spot manipulation—fake fills, spoofing, coordinated alerts, and delayed data—helps you avoid poor trades and preserve capital. This guide lists red flags, diagnostic tests, and practical defensive rules you can implement immediately.

Volatile markets amplify every input — including the signals you follow. Distinguishing authentic signals from manipulated or low-quality alerts is essential for any trader relying on external feeds, community channels, or automated strategies. This article breaks detection into (A) red-flag behaviors, (B) data tests you can run, (C) cross-checks and forensic checks, and (D) defensive rules to keep your drawdown small when the market behaves badly.

1. Common types of signal manipulation

Understanding the methods helps detect them. Frequent manipulative behaviors include:

  • Spoofed fills: fake order information shown on some platforms but not actually executable on the exchange.
  • Delayed or stale data: feeds that lag market prices, making "real-time" signals inaccurate.
  • Coordinated pump-and-dump alerts: groups send bullish signals to create momentum, then exit.
  • Cherry-picked backtests: signals optimized for specific long-tailed periods that don’t hold live.
  • Wash alerts: test alerts sent to create perceived success before real trades are placed.

2. Red flags you should watch

If you see any of the following, treat the signal with suspicion:

  • Repeated "perfect" entries or exits with unrealistically tight stops.
  • Signals that arrive only after large market moves (late alerts).
  • High-volume claims without independent verification (no fill screenshots, no broker statements).
  • Channels that frequently change recommended targets/stops without transparent reasoning.
  • Pressure to act immediately or fear-of-missing-out (FOMO) prompts in messaging.

3. Quick data checks you can run (real-time)

When a signal arrives in a volatile market, run these rapid checks before risking capital:

  1. Timestamp check: Compare the signal timestamp to your price feed. If the signal refers to a price that happened >1–3 seconds earlier in a fast market, treat it as stale.
  2. Exchange verification: For crypto or ECN markets, verify the quoted level on the exchange's native order book or official API.
  3. Volume confirmation: Check whether volume on the move supports the claim. Low-volume moves during volatility often reverse quickly.
  4. Cross-feed confirmation: Look for the same move on a different data provider or broker.
  5. Order book depth: Observe whether large visible orders are genuine or vanish (a sign of spoofing).

4. Statistical and forensic tests (post-event)

For signals you already received, perform these retrospective checks to detect manipulation or poor signal hygiene:

  • Fill/Execution audit: Compare the claimed entry/exit to actual fills recorded by your broker; large discrepancies indicate misreporting.
  • Latency analysis: Measure the delay between alert and market price (log timestamps). A pattern of >X seconds delay in volatile periods is suspicious.
  • Correlation testing: Check if multiple symbols moved together artificially (e.g., many illiquid pairs spiking simultaneously).
  • Win/loss distribution review: Real strategies show varied outcomes; overly tidy drawdowns and smooth equity curves may be overfitted.

5. Cross-check sources and reputations

Signal quality depends on the sender. Maintain a source registry:

  • Grade sources by historical accuracy and transparency (A–F).
  • Prefer sources that publish post-trade evidence: time-stamped screenshots, broker reports, or public API calls.
  • Avoid exclusive-only groups that refuse to let you audit past signals.

6. Behavioral signs from chat/activity logs

Monitor the behavior of channel moderators or signal providers. Signs of manipulation include:

  • Deleting or altering messages after the fact to make a signal look better.
  • Amplifying FOMO with constant "now or never" messages.
  • Posting confusing mixed signals to create noise while insiders trade elsewhere.

7. Defensive trade rules to limit damage

You don’t need to root out every manipulative act; you need rules that protect capital. Implement these defensive rules:

  • Wait-for-confirmation: Require a price or volume confirmation before entering after a signal (e.g., close above/below the signal price on a 1-minute candle).
  • Reduced sizing in volatile windows: Scale position size down during scheduled news or extreme volatility.
  • Use limit entries with slippage caps: Only accept fills within acceptable slippage; reject fills beyond that to prevent chasing fake moves.
  • Predefine maximum exposure: Keep a portfolio-level cap; if multiple signals spike, reduce per-signal size.
  • Auto-stop audit: Keep logs of stop placement vs actual executed stop levels to detect mismatches quickly.

8. Automation & monitoring tools

Automation helps detect patterns faster than manual checks. Consider:

  • Recording all incoming alerts with timestamps and automatically matching them to price feed snapshots.
  • Setting automated alerts when fill slippage exceeds thresholds or when the order book shows disappearing liquidity.
  • Using simple statistical dashboards to flag sources whose reported results deviate significantly from actual fills.

9. Legal & ethical considerations

Some manipulative behaviors are illegal in regulated markets. If you suspect fraud (coordinated pump-and-dump, spoofing on regulated exchanges), document evidence and report to the relevant market regulator or exchange. Private chat disputes are common — preserve logs and timestamps before attempting to escalate.

Quick Checklist: 1) Always verify timestamps and price sources; 2) Check volume and order-book depth; 3) Reduce size in volatile windows; 4) Keep an audit trail for suspicious signals.

10. Example: a real-world detection workflow

Scenario: You receive a bullish breakout alert during a major economic release.

  1. Immediately snapshot the price from your primary feed and a secondary feed (exchange API or alternative broker).
  2. Check volume on the breakout candle; if volume is muted, treat the breakout as weak.
  3. If the order book shows large orders that vanish after you attempt to take them, abort the trade.
  4. If you still enter, reduce size by 50% and set a stricter slippage/stop rule.
  5. Log all timestamps and reconcile fills after the event — if your fills consistently differ, remove the source.

Conclusion

Signal manipulation is not always obvious, especially during high volatility. The best defense is a combination of skepticism, fast data checks, source auditing, and conservative trade rules that limit downside. Build these checks into your workflow and automate where possible — preserving capital during manipulated conditions is the fastest path to long-term profitability.

Disclaimer: This content is educational and not financial advice. Trading involves risk. Always test rules in a demo environment before scaling live.
rfxsignals October 3, 2025 No Comments

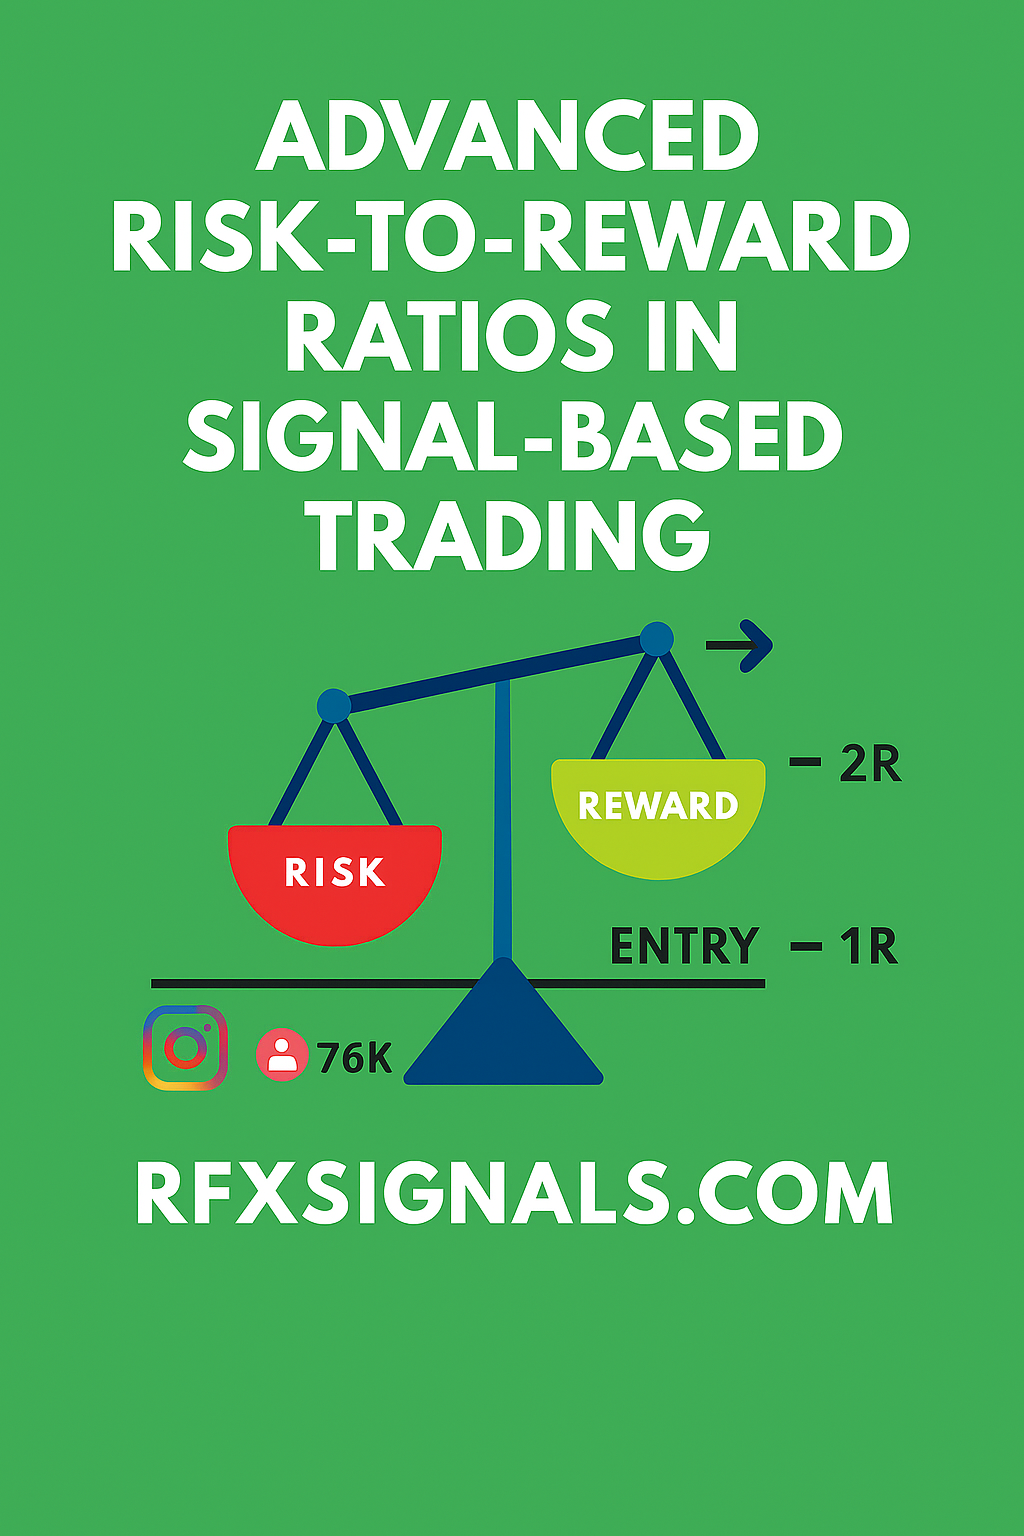
Advanced Risk-to-Reward Ratios in Signal-Based Trading

Advanced Risk-to-Reward Ratios in Signal-Based Trading
Advanced Risk-to-Reward Ratios in Signal-Based Trading | {{SITE_NAME}}

Advanced Risk-to-Reward Ratios in Signal-Based Trading

By Estimated read: 9 minutes

Summary: Signal-based trading requires more than following alerts — it needs a disciplined approach to risk-to-reward (R:R). This guide shows advanced methods to determine R:R in multi-signal setups, how to size positions for edge preservation, and practical rules to improve long-term expectancy.

Signal-based trading transforms subjective market views into repeatable processes. But without robust risk-to-reward rules, winning signals can be eroded by poor sizing and mismanaged stop placement. This article explores advanced R:R concepts tailored for traders who rely on signals — whether algorithmic, manual, or community-driven — and want to convert positive hit-rate signals into long-term profitability.

1. Why R:R matters more with signals

Signals often arrive clustered (several signals in a narrow time window) or as contradicting messages from different indicators. A naive, fixed R:R (like 1:2 always) ignores context: market volatility, signal quality, and overlapping exposure. Advanced traders adapt R:R dynamically to preserve edge while keeping drawdown under control.

2. Signal quality and expected value (EV)

Before assigning R:R, evaluate signal quality. Key metrics:

  • Historical hit rate (over similar conditions)
  • Average win and loss size
  • Signal correlation with price regime (trending vs range)

Use these to estimate EV. If a signal historically shows a 40% win rate with an average win 2× average loss, the expectancy per trade = 0.4×2 − 0.6×1 = 0.2 units; this positive EV lets you accept lower R:R (e.g., 1:1) while maintaining profitability.

3. Dynamic R:R: volatility and regime adjustment

Set stops and targets relative to volatility (ATR or realized volatility). Rules of thumb:

  • Low-volatility regime → tighter stops, smaller targets (preserve capital)
  • High-volatility regime → widen stops but increase target multiples to maintain R:R
  • Use ATR multiples to compute stop distance and derive target = stop_distance × desired_RR

Example: ATR(14) = 20 pips. If your signal is strong in trending markets, set stop = 1×ATR (20 pips) and target = 3×ATR (60 pips) for R:R 1:3.

4. Combining multiple signals: scaling and staggered R:R

When two or more signals (e.g., indicator + price action) align, you can scale position entries and use staggered R:R:

  1. Entry A (initial signal): 50% position, stop at conservative level, target at 1:1.5
  2. Entry B (confirming signal): add 30%, tighter stop trailing to breakeven, target at 1:3
  3. Final add (strong macro confirmation): 20%, wider target 1:4 if trend continuation confirmed

Staggering reduces risk when signal reliability is uncertain and magnifies profits on strong trends.

5. Position sizing rules for multi-signal exposure

Preserve account equity by sizing to total exposure, not per signal. Use these steps:

  1. Decide max account risk per trade (e.g., 1% of equity).
  2. If you expect multiple correlated signals, reduce per-signal risk (e.g., 1% total split into 0.5% and 0.5%).
  3. Calculate lot size = (account_risk_amount) ÷ (stop_distance in quote currency).

This prevents over-leveraging when several signals hit simultaneously.

6. Trade management: moving stops, partial exits, and expectancy preservation

After entry, follow a documented rule set:

  • At +1R, move stop to breakeven for initial portion to eliminate downside for the remainder.
  • Use partial exits at key levels (support/resistance or Fibonacci) instead of arbitrary fixed profits.
  • Trail stop after the trade achieves target multiples to lock in gains and let winners run.

Well-structured management can turn a moderate R:R into superior system expectancy.

7. Handling correlated alerts and portfolio-level R:R

Many signals are correlated (e.g., EURUSD and GBPUSD). Treat correlated trades as a single portfolio exposure. Compute portfolio R:R by aggregating potential P&L and risk across correlated positions and size accordingly to keep total risk within limits.

8. Backtesting R:R strategies on signal streams

Backtest using realistic assumptions: slippage, spread, and partial fills. Test several R:R bands (1:1, 1:2, 1:3) across different market regimes and measure drawdowns and Sharpe/Sortino ratios. Focus on metrics that matter to you — a higher R:R with rare wins may still underperform a lower R:R with higher hit rate.

9. Psychological & operational considerations

Higher R:R often means fewer wins and requires discipline. Use automation for signal execution where possible to remove execution hesitation. Document every trade and review monthly to refine R:R rules.

Quick Checklist: 1) Measure signal EV; 2) Adjust R:R by volatility; 3) Size per total exposure; 4) Use staggered entries for confirmation; 5) Backtest with realistic costs.

10. Practical example (step-by-step)

Signal: Breakout + momentum confirmation on 1H chart.

  1. ATR(14)=18 pips → stop = 1×ATR = 18 pips
  2. Target = 3×ATR = 54 pips → R:R = 1:3
  3. Account risk = 1% → risk per trade = $100 on $10,000 account
  4. Position size = $100 ÷ (18 pips × pip_value) → compute lots accordingly
  5. At +1R, move 50% of position to breakeven, trail remainder with 0.5×ATR

11. SEO & link strategy (for publishers)

When publishing signal-based content, link internally to relevant pages (e.g., /signals, /case-studies, /pricing) and externally to authoritative sources (e.g., educational resources). Use anchor text naturally: “signal performance report,” “ATR volatility guide,” etc. This article includes suggested internal links to improve thematic relevance and outbound links to trusted learning resources.

Conclusion

Advanced R:R in signal-based trading is a multi-dimensional problem: balance signal quality, volatility, and total portfolio exposure. Dynamic R:R, staggered entries, and disciplined sizing transform signals from noisy alerts into a sustainable advantage. Use consistent backtests and keep the rules simple enough to follow in real-time.

Disclaimer: Trading carries risk. Past performance is not indicative of future results. This content is educational and not financial advice.