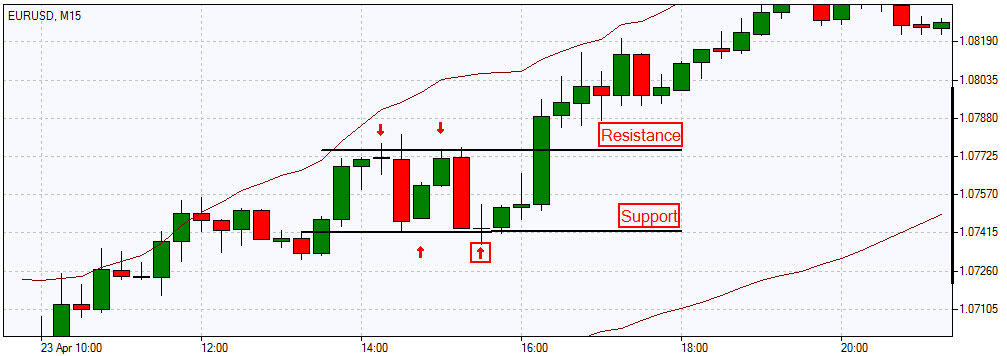
Support and Resistance Trading Strategy
In order to completely understand the essence of support and resistance trading strategy you should firstly know what a horizontal level is. Actually, it is a price level indicating either a support or resistance in the market. The support and resistance in technical analysis are the terms for price lows and highs respectively. The term support indicates the area on the chart where the buying interest is significantly strong and surpasses the selling pressure. It is usually marked by previous troughs. Resistance level, contrary to the support level, represents an area on the chart where selling interest overcomes buying pressure. It is usually marked by previous peaks.

In order to develop a support and resistance strategy you should be well aware of how the trend is identified through these horizontal levels. Thus, for an uptrend to go on, each successive support level should be higher than the previous one, and each successive resistance level should be higher than the one preceding it.
In case this is not so, for instance, if the support level comes down to the previous trough, it may signify that the uptrend is coming to the end or at least it is turning into a sideways trend. It is likely that trend reversal from up to down will occur. The opposite situation takes place in a downtrend; the failure of each support level to move lower than the previous trough may again signal changes in the existing trend.
The concept behind support and resistance trading is still the same – buying a security when we expect it to increase in price and sell when expecting its price to go down. Thus, when the price falls to the support level, traders decide to buy creating demand and driving the price up. In the same way, when the price rises to a resistance level, traders decide to sell, creating a downward pressure and driving the price down.