Fibonacci Retracements Analysis 03.03.2020 (EURUSD, USDJPY)
EURUSD, “Euro vs US Dollar”
As we can see in the daily chart, the convergence on MACD made EURUSD start a quick and steady growth, which may indicate a reversal of the long-term tendency. By now, the pair has reached 23.6% fibo at 1.1196; later, it may test it and start a new pullback. The next upside targets may be 38.2% and 50.0% fibo at 1.1456 and 1.1665 respectively. The key support is the low at 1.0777.


In the H4 chart, the pair is approaching 23.6% fibo at 1.1196.


USDJPY, “US Dollar vs. Japanese Yen”
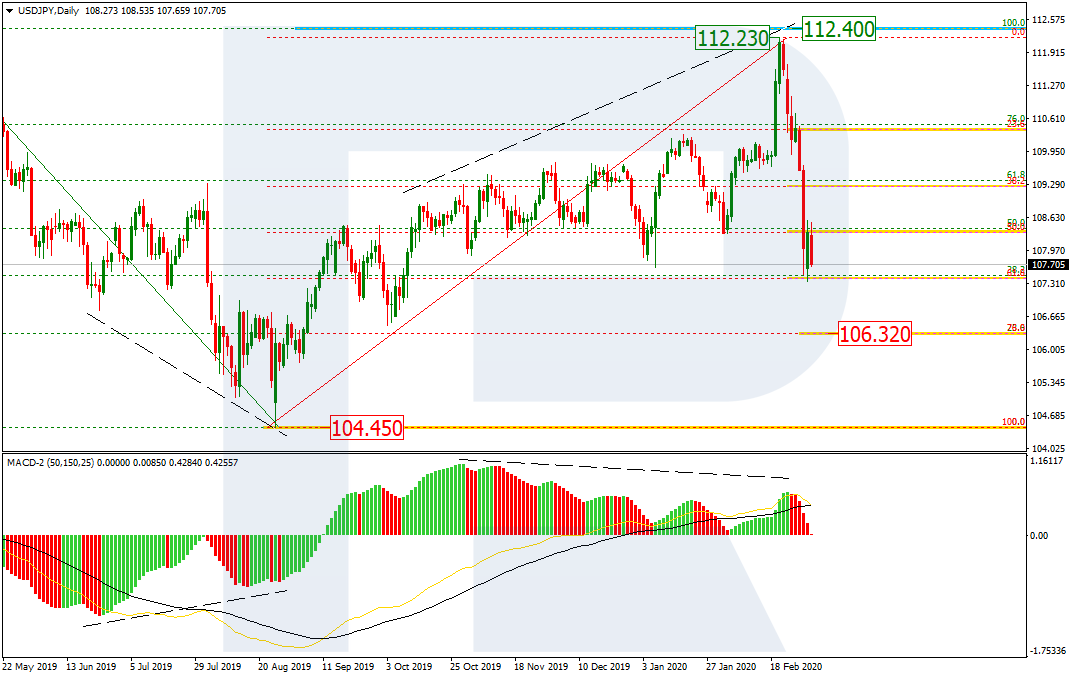
As we can see in the daily chart, USDJPY has failed to reach the fractal high at 112.40: there was a divergence that made the pair stat a new descending impulse towards 61.8% fibo. After reaching it, the instrument may continue falling; the targets are 76.0% fibo and the long-term low at 106.32 and 104.45 respectively.


In the H1 chart, the pair is correcting after a descending impulse and has already reached 23.6% fibo and may continue towards 38.2% fibo at 108.64 or even 50.0% fibo at 109.03. if the price breaks the support at 107.36, the mid-term downtrend will continue.
