Murrey Math Lines 29.01.2021 (Brent, S&P 500)
BRENT
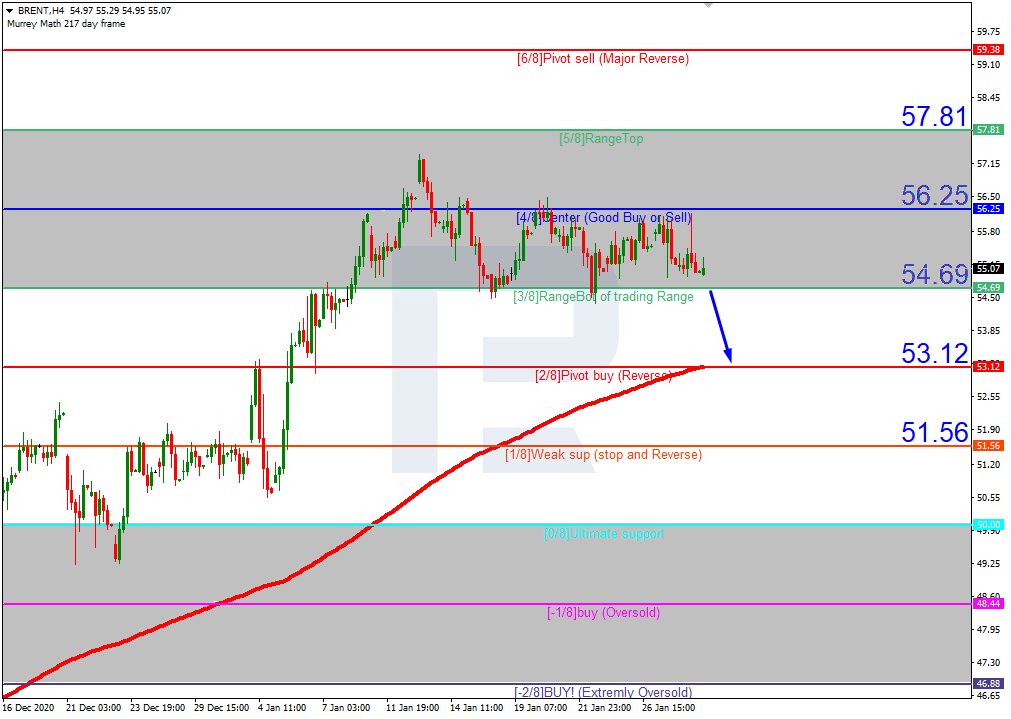
In the H4 chart, Brent is consolidating between 3/8 and 4/8. The instrument made several attempts to break the resistance at 4/8 but failed each time. In this case, the asset is expected to break 3/8 and then correct downwards to reach the support at 2/8. However, this scenario may no longer be valid if the price breaks 4/8 to the upside. After that, the instrument may continue growing towards the resistance at 5/8.

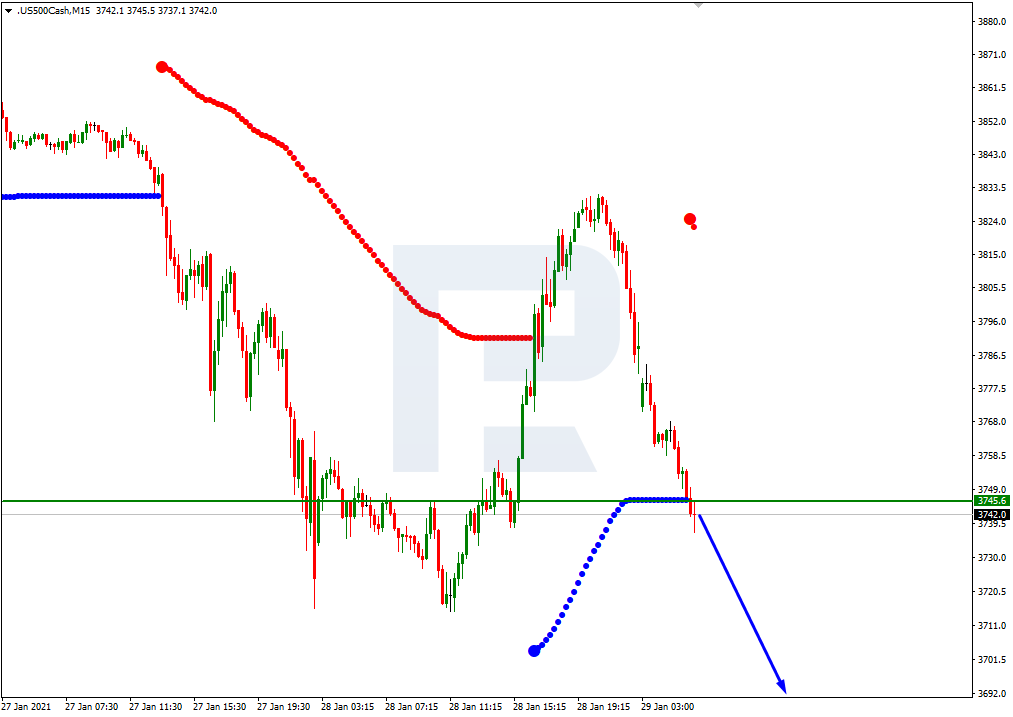
As we can see in the M15 chart, the price has broken the downside line of the VoltyChannel indicator and, as a result, may continue the descending tendency.
S&P 500
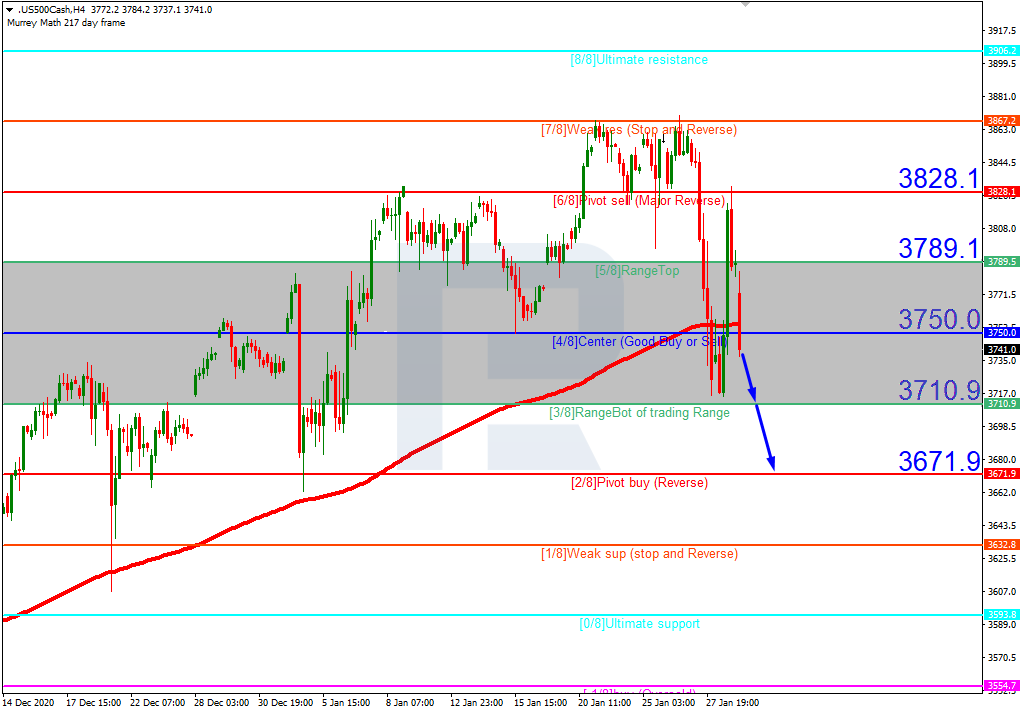
In the H4, after breaking the 200-day Moving Average, the S&P Index is moving below it. In this case, the asset is expected to break the closest support at 3/8 and then continue falling towards the next support at 2/8. However, this scenario may no longer be valid if the price fixes above 4/8. After that, the instrument may recover and reach the resistance at 5/8.
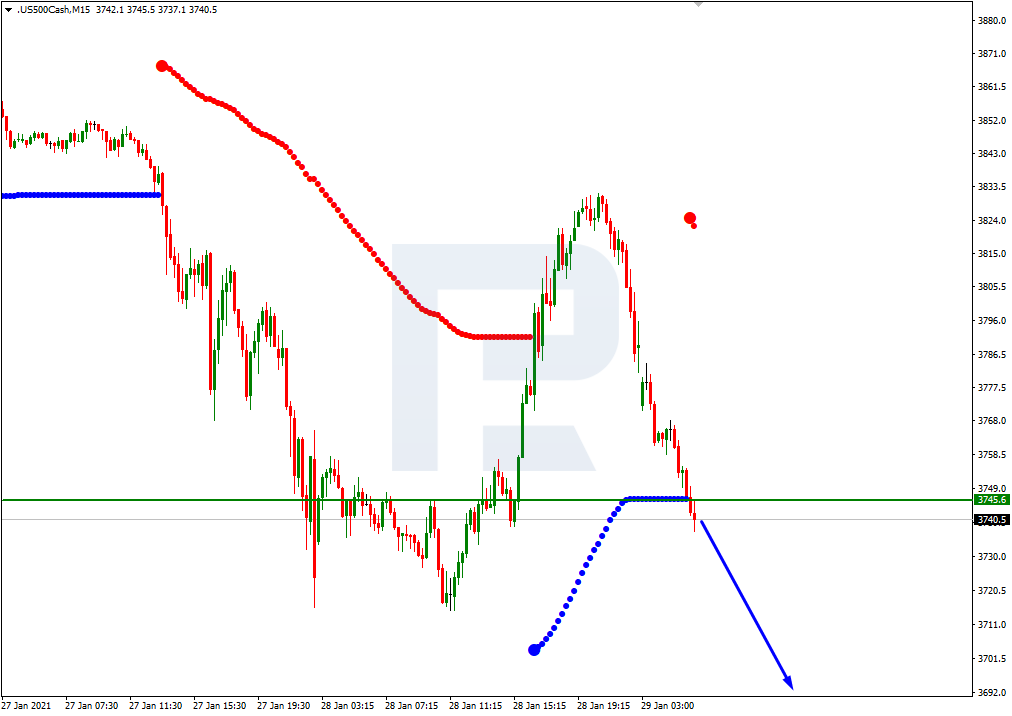
As we can see in the M15 chart, the price has broken the downside line of the VoltyChannel indicator and, as a result, may continue its decline.