AUDUSD, “Australian Dollar vs US Dollar”
In the H4 chart, after breaking 61.8% fibo at 0.7379, the downtrend has failed to reach 76.0% fibo at 0.7236. At the same time, we can see divergence on MACD, which may force the asset to start a pullback to the upside. However, this ascending movement is not expected to reach the high at 0.8007. In the future, this pullback may be followed by another descending wave to reach the fractal support at 0.6991.


The H1 chart of AUDUSD shows potential correctional targets after convergence on MACD, which are 23.6%, 38.2%, and 50.0% fibo at 0.7431, 0.7519, and 0.7590 respectively. A breakout of the low at 0.7289 will result in a further downtrend.


USDCAD, “US Dollar vs Canadian Dollar”
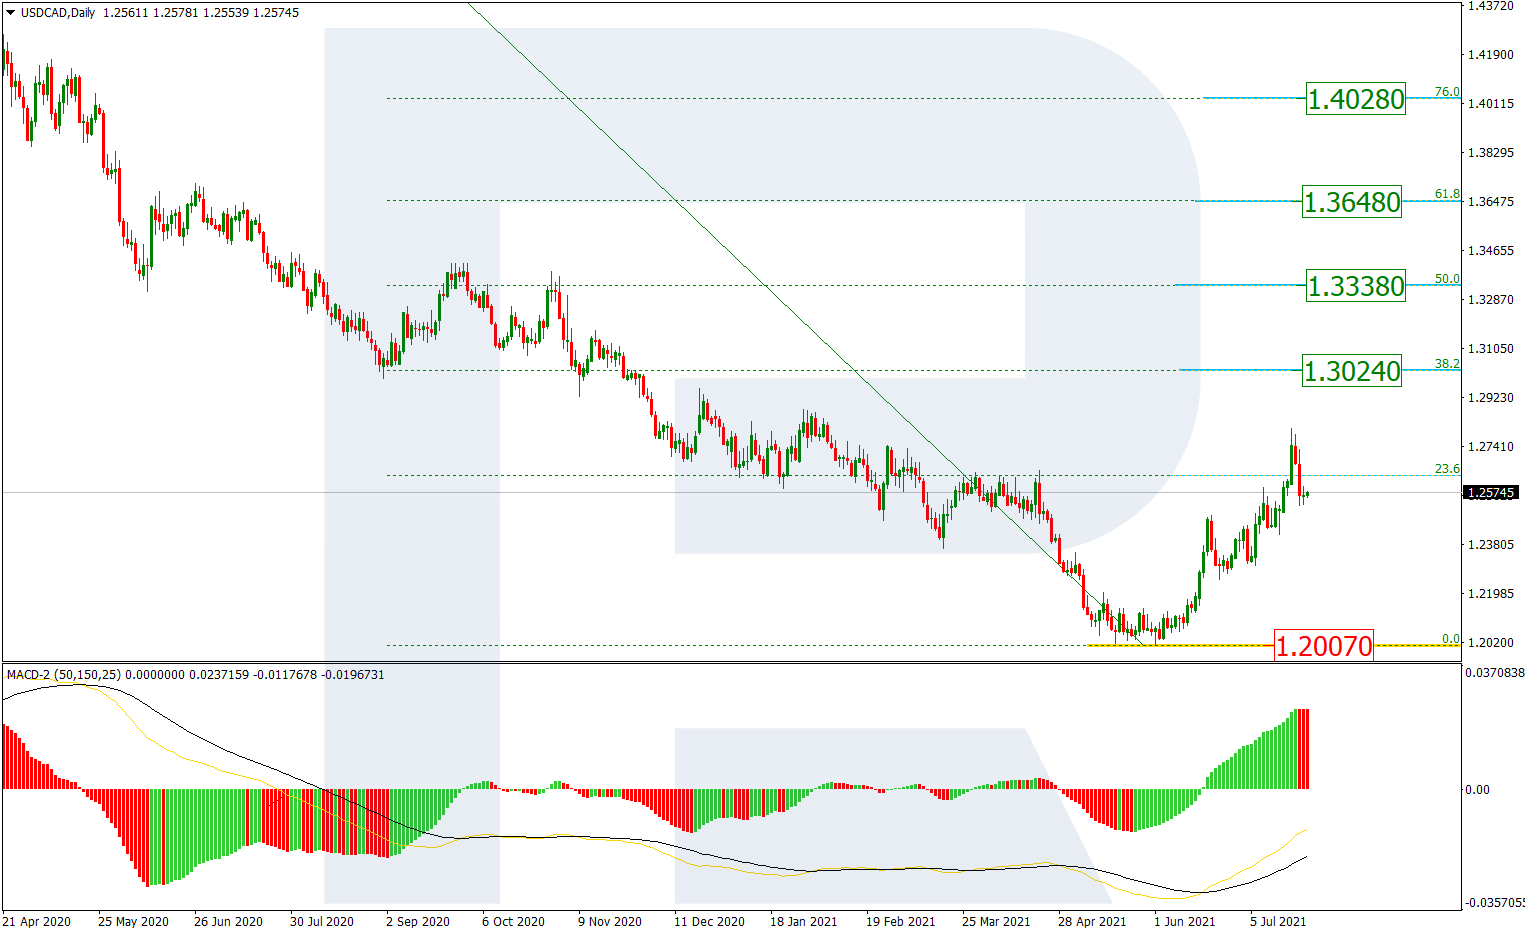
As we can see in the daily chart, after finishing the first ascending wave at 23.6% fibo, USDCAD is correcting and may later resume its mid-term uptrend towards 38.2%, 50.0%, 61.8%, and 76.0% fibo at 1.3024, 1.3338, 1.3648, and 1.4028 respectively. The key support remains at the low at 1.2007.


The H4 chart shows a descending correction after divergence on MACD, which has already broken 23.6% fibo and may later continue towards 38.2%, 50.0%, 61.8%, and 76.0% fibo at 1.2501, 1.2406, 1.3212, and 1.21999 respectively. The local resistance is at 1.2807.

