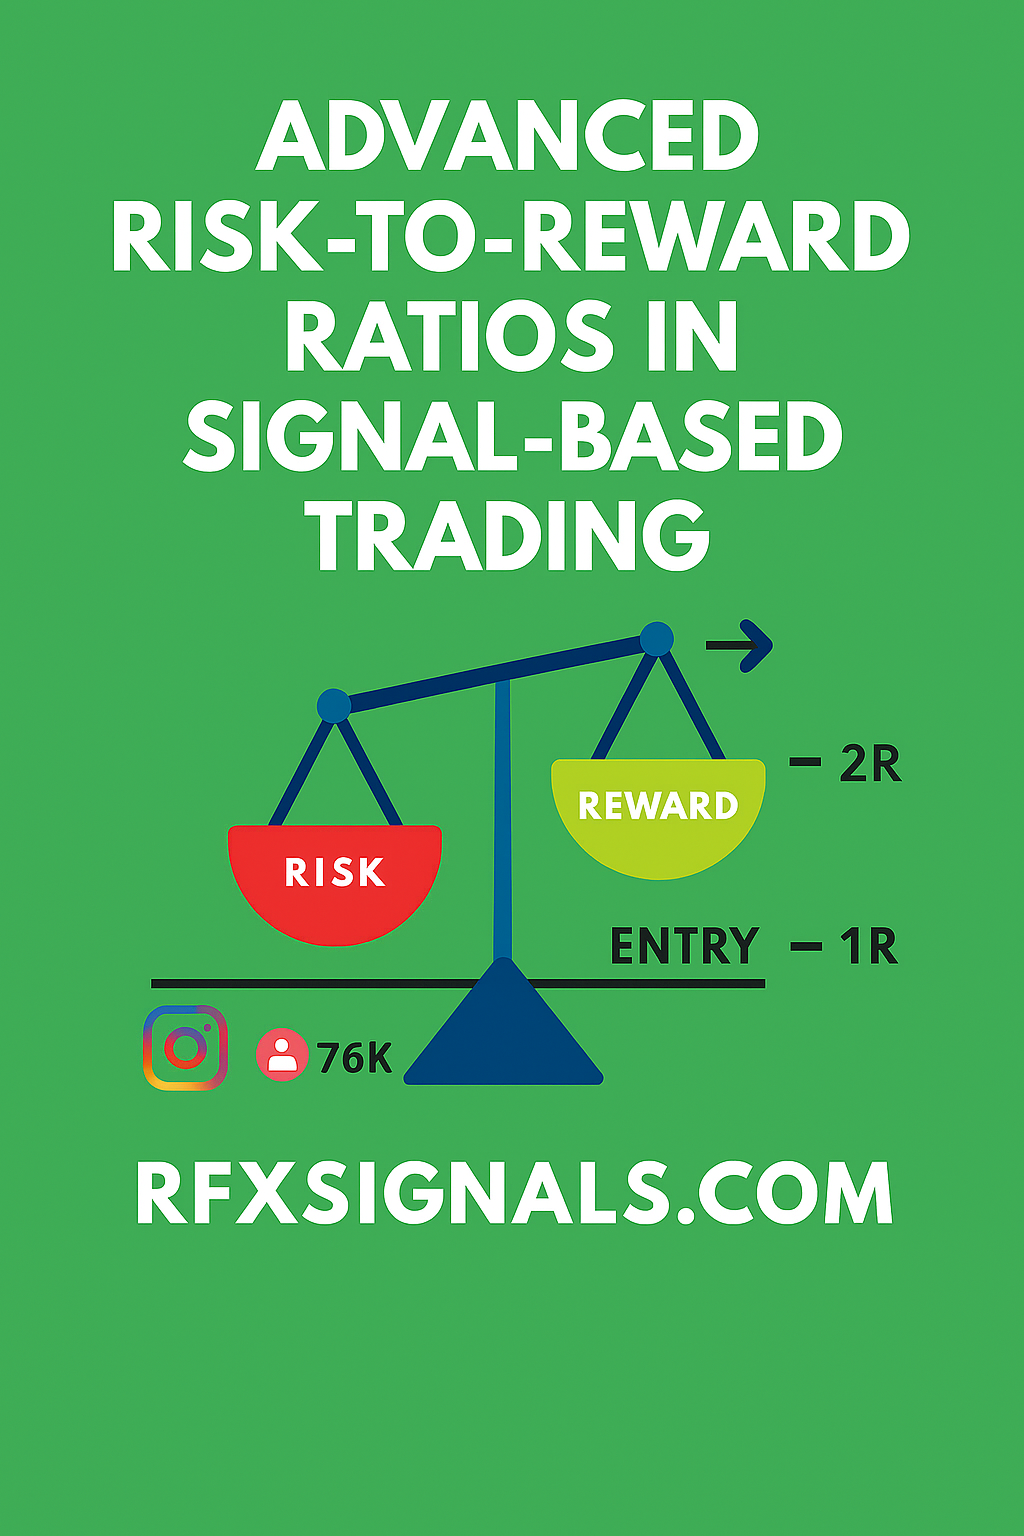
Advanced Risk-to-Reward Ratios in Signal-Based Trading
Summary: Signal-based trading requires more than following alerts — it needs a disciplined approach to risk-to-reward (R:R). This guide shows advanced methods to determine R:R in multi-signal setups, how to size positions for edge preservation, and practical rules to improve long-term expectancy.
Signal-based trading transforms subjective market views into repeatable processes. But without robust risk-to-reward rules, winning signals can be eroded by poor sizing and mismanaged stop placement. This article explores advanced R:R concepts tailored for traders who rely on signals — whether algorithmic, manual, or community-driven — and want to convert positive hit-rate signals into long-term profitability.
1. Why R:R matters more with signals
Signals often arrive clustered (several signals in a narrow time window) or as contradicting messages from different indicators. A naive, fixed R:R (like 1:2 always) ignores context: market volatility, signal quality, and overlapping exposure. Advanced traders adapt R:R dynamically to preserve edge while keeping drawdown under control.
2. Signal quality and expected value (EV)
Before assigning R:R, evaluate signal quality. Key metrics:
- Historical hit rate (over similar conditions)
- Average win and loss size
- Signal correlation with price regime (trending vs range)
Use these to estimate EV. If a signal historically shows a 40% win rate with an average win 2× average loss, the expectancy per trade = 0.4×2 − 0.6×1 = 0.2 units; this positive EV lets you accept lower R:R (e.g., 1:1) while maintaining profitability.
3. Dynamic R:R: volatility and regime adjustment
Set stops and targets relative to volatility (ATR or realized volatility). Rules of thumb:
- Low-volatility regime → tighter stops, smaller targets (preserve capital)
- High-volatility regime → widen stops but increase target multiples to maintain R:R
- Use ATR multiples to compute stop distance and derive target = stop_distance × desired_RR
Example: ATR(14) = 20 pips. If your signal is strong in trending markets, set stop = 1×ATR (20 pips) and target = 3×ATR (60 pips) for R:R 1:3.
4. Combining multiple signals: scaling and staggered R:R
When two or more signals (e.g., indicator + price action) align, you can scale position entries and use staggered R:R:
- Entry A (initial signal): 50% position, stop at conservative level, target at 1:1.5
- Entry B (confirming signal): add 30%, tighter stop trailing to breakeven, target at 1:3
- Final add (strong macro confirmation): 20%, wider target 1:4 if trend continuation confirmed
Staggering reduces risk when signal reliability is uncertain and magnifies profits on strong trends.
5. Position sizing rules for multi-signal exposure
Preserve account equity by sizing to total exposure, not per signal. Use these steps:
- Decide max account risk per trade (e.g., 1% of equity).
- If you expect multiple correlated signals, reduce per-signal risk (e.g., 1% total split into 0.5% and 0.5%).
- Calculate lot size = (account_risk_amount) ÷ (stop_distance in quote currency).
This prevents over-leveraging when several signals hit simultaneously.
6. Trade management: moving stops, partial exits, and expectancy preservation
After entry, follow a documented rule set:
- At +1R, move stop to breakeven for initial portion to eliminate downside for the remainder.
- Use partial exits at key levels (support/resistance or Fibonacci) instead of arbitrary fixed profits.
- Trail stop after the trade achieves target multiples to lock in gains and let winners run.
Well-structured management can turn a moderate R:R into superior system expectancy.
7. Handling correlated alerts and portfolio-level R:R
Many signals are correlated (e.g., EURUSD and GBPUSD). Treat correlated trades as a single portfolio exposure. Compute portfolio R:R by aggregating potential P&L and risk across correlated positions and size accordingly to keep total risk within limits.
8. Backtesting R:R strategies on signal streams
Backtest using realistic assumptions: slippage, spread, and partial fills. Test several R:R bands (1:1, 1:2, 1:3) across different market regimes and measure drawdowns and Sharpe/Sortino ratios. Focus on metrics that matter to you — a higher R:R with rare wins may still underperform a lower R:R with higher hit rate.
9. Psychological & operational considerations
Higher R:R often means fewer wins and requires discipline. Use automation for signal execution where possible to remove execution hesitation. Document every trade and review monthly to refine R:R rules.
10. Practical example (step-by-step)
Signal: Breakout + momentum confirmation on 1H chart.
- ATR(14)=18 pips → stop = 1×ATR = 18 pips
- Target = 3×ATR = 54 pips → R:R = 1:3
- Account risk = 1% → risk per trade = $100 on $10,000 account
- Position size = $100 ÷ (18 pips × pip_value) → compute lots accordingly
- At +1R, move 50% of position to breakeven, trail remainder with 0.5×ATR
11. SEO & link strategy (for publishers)
When publishing signal-based content, link internally to relevant pages (e.g., /signals, /case-studies, /pricing) and externally to authoritative sources (e.g., educational resources). Use anchor text naturally: “signal performance report,” “ATR volatility guide,” etc. This article includes suggested internal links to improve thematic relevance and outbound links to trusted learning resources.
Conclusion
Advanced R:R in signal-based trading is a multi-dimensional problem: balance signal quality, volatility, and total portfolio exposure. Dynamic R:R, staggered entries, and disciplined sizing transform signals from noisy alerts into a sustainable advantage. Use consistent backtests and keep the rules simple enough to follow in real-time.