Fibonacci Retracements Analysis 25.10.2019 (BITCOIN, ETHEREUM)

25.10.2019

BTCUSD, “Bitcoin vs US Dollar”

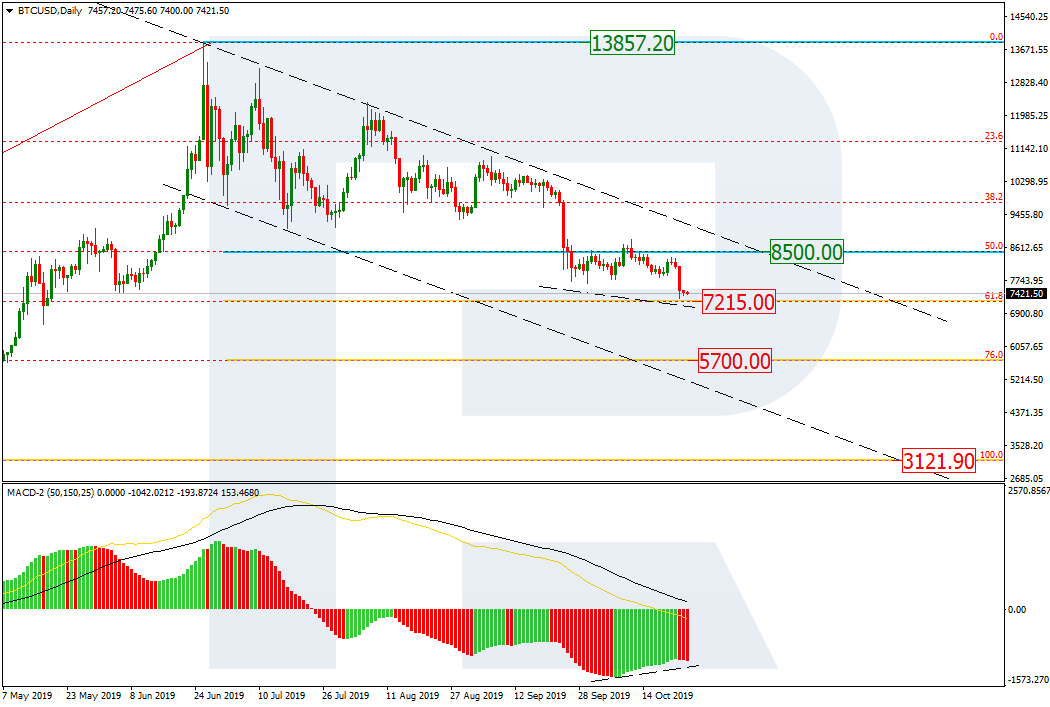
As we can see in the daily chart, the descending tendency continues. After completing the short-term correction, BTCUSD started a new descending impulse, which has almost reached 61.8% fibo at 7215.00. Later, the price may continue trading towards 76.0% fibo at 5700.00. However, the key mid-term target is the long-term low at 3121.90. The previous impulse has moved the resistance, which is currently at 50.0% fibo at 8500.00.

BITCOIN_D1
Risk Warning: the result of previous trading operations do not guarantee the same results in the future

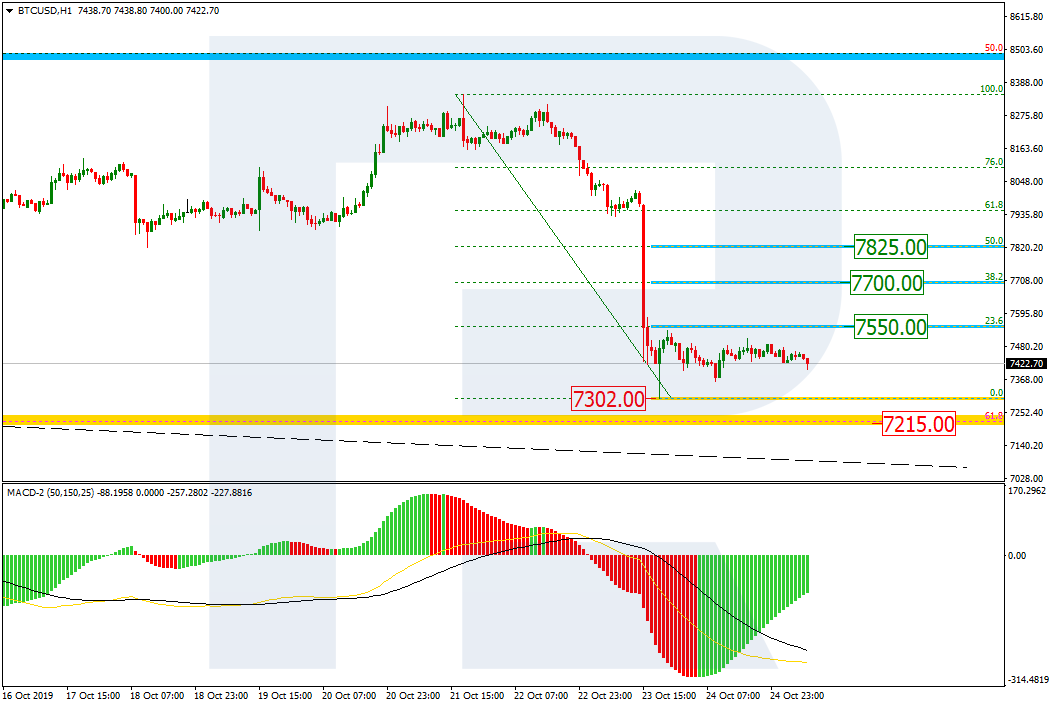
In the H1 chart, the pair is correcting sideways; right now, it is moving between the local low at 7302.00 and 23.6% fibo at 7550.00. In the future, the instrument may yet continue the correction towards 38.2% and 50.0% fibo at 7700.00 and 7825.00 respectively, but it’s highly unlikely.

BITCOIN_H1
Risk Warning: the result of previous trading operations do not guarantee the same results in the future

ETHUSD, “Ethereum vs. US Dollar”

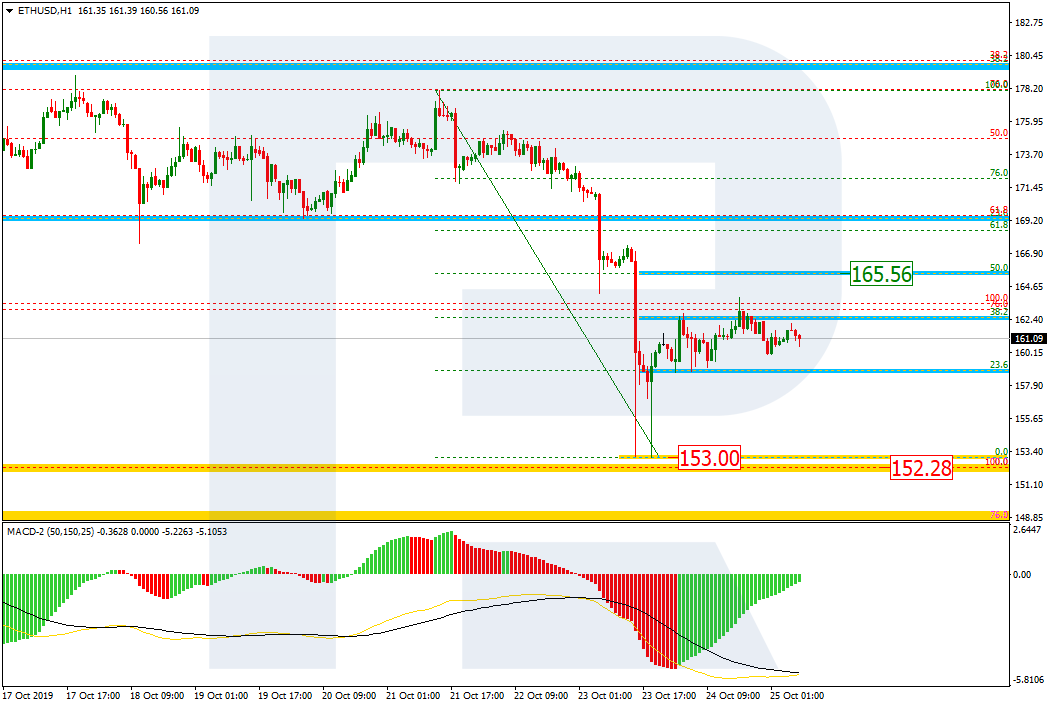
As we can see in the H4 chart, after finishing the correction, ETHUSD started a new decline, which has almost reached the low at 152.28. If the price breaks the low, the pair may continue trading towards 76.0% fibo at 148.60 and then the post-correctional extension area between 138.2% and 161.8% fibo at 135.30 and 124.40 respectively.

ETHEREUM_H4
Risk Warning: the result of previous trading operations do not guarantee the same results in the future

In the H1 chart, the instrument is correcting upwards and has already reached 38.2% fibo. The next upside target is 50.0% fibo at 165.56. the support is the local low at 153.00.

ETHEREUM_H1
Risk Warning: the result of previous trading operations do not guarantee the same results in the future

Fibonacci Retracements Analysis 24.10.2019 (AUDUSD, USDCAD)

24.10.2019

AUDUSD, “Australian Dollar vs US Dollar”

As we can see in the H4 chart, the convergence made the pair start a new growth; by now, it has fixed above 23.6% fibo. In the nearest future, AUDUSD may start a new pullback and return to this level. After the pullback, the correctional uptrend may continue towards 38.2% and 50.0% fibo at 0.6909 and 0.6983 respectively. The key support is the fractal at 0.6670.

AUDUSD_H4
Risk Warning: the result of previous trading operations do not guarantee the same results in the future

In the H1 chart, AUDUSD is correcting downwards after the divergence and has already reached 23.6% fibo. The next downside targets may be 38.2% and 50.0% fibo at 0.6821 and 0.6802 respectively.

AUDUSD_H1
Risk Warning: the result of previous trading operations do not guarantee the same results in the future

USDCAD, “US Dollar vs Canadian Dollar”

As we can see in the daily chart, USDCAD has been moving between 23.6% and 38.2% fibo for quite a long time; right now, the pair is again moving to test 38.2% fibo and the low at 1.3015, which means that the price is probably about to start a new descending impulse within the bearish trend. The next downside targets inside the post-correctional extension area between 138.2% and 161.8% fibo at 1.2877 and 1.2789 respectively. Moreover, mid-term 50.0% fibo at 1.2865 is also there.

USDCAD_D1
Risk Warning: the result of previous trading operations do not guarantee the same results in the future

The H4 chart shows more detailed structure of the current decline after the divergence. The closest downside target is the low at 1.3015.

USDCAD
Risk Warning: the result of previous trading operations do not guarantee the same results in the future
rfxsignals October 24, 2019 No Comments

DAILY FREE FOREX SIGNALS FOR 24-10-2019 | Форекс – Сообщество Трейдеров |إشارات الفوركس|외환 신호

GBPUSD SELL-1.28828
SL-1.29240
TP1-1.28590
TP2-1.28376

EURUSD SELL-1.11275
SL-1.11694
TP1-1.11061
TP2-1.10816

AUDUSD SELL-0.68236
SL-0.68692
TP1-0.68041
TP2-0.67848

NZDUSD SELL-0.63856
SL-0.64234
TP1-0.63671
TP2-0.63530

GBPCHF SELL-1.27615
SL-1.27990
TP1-1.27412
TP2-1.27210

EURJPY SELL-120.923
SL-121.304
TP1-120.761
TP2-120.573

CADJPY SELL-83.048
SL-83.454
TP1-82.831
TP2-82.618

Fibonacci Retracements Analysis 23.10.2019 (GBPUSD, EURJPY)

23.10.2019

GBPUSD, “Great Britain Pound vs US Dollar”

As we can see in the H4 chart, there was a divergence on MACD, which made GBPUSD complete the rising wave at 76.0% fibo at 1.3040 and start a new pullback. The downside targets are 23.6%, 38.2%, 50.0%, and 61.8% fibo at 1.2819, 1.2700, 1.2600, and 1.2506 respectively.

GBPUSD_H4
Risk Warning: the result of previous trading operations do not guarantee the same results in the future

The H1 chart shows more detailed structure of the current descending correction after the divergence.

GBPUSD_H1
Risk Warning: the result of previous trading operations do not guarantee the same results in the future

EURJPY, “Euro vs. Japanese Yen”

As we can see in the H4 chart, there was a divergence on MACD, which made EURJPY finish the ascending wave at 76.0% fibo at 121.55 and start a new decline, which has already reached 23.6% fibo. The next downside targets are 38.2%, 50.0%, and 61.8% fibo at 119.79, 119.27, and 118.75 respectively. the resistance is the high at 121.47.

EURJPY_H4
Risk Warning: the result of previous trading operations do not guarantee the same results in the future

In the H1 chart, the pair is about to reach 23.6% fibo.

EURJPY_H1
Risk Warning: the result of previous trading operations do not guarantee the same results in the future

Fibonacci Retracements Analysis 22.10.2019 (EURUSD, USDJPY)

22.10.2019

EURUSD, “Euro vs US Dollar”

It would be better to analyze the current EURUSD situation in the daily chart. As we can see, there was a convergence on MACD, which made the pair start a new rising impulse. This impulse may be a part of the long-term tendency reverse. The closest target is 23.6% fibo at 1.1275, while the next ones may be 38.2% and 50.0% fibo at 1.1520 and 1.1716 respectively. The support is the low at 1.0879.

EURUSD_D1
Risk Warning: the result of previous trading operations do not guarantee the same results in the future

The H4 chart shows the more detailed structure of the current rising tendency that started after the convergence. By now, the correctional uptrend has reached 50.0% fibo and may be followed by a new short-term pullback soon. After completing the pullback, the instrument may continue growing towards 61.8% and 76.0% fibo at 1.1208 and 1.1284 respectively.

EURUSD_H4
Risk Warning: the result of previous trading operations do not guarantee the same results in the future

USDJPY, “US Dollar vs. Japanese Yen”

As we can see in the H4 chart, after breaking the highs, USDJPY is trying to fix above them to continue forming the rising tendency. The upside targets are inside the post-correctional extension area between 138.2% and 161.8% fibo at 109.23 and 109.70 respectively; mid-term 61.8% fibo at 109.37 is also there. The key support is at 106.48.

USDJPY_H4
Risk Warning: the result of previous trading operations do not guarantee the same results in the future

In the H1 chart, the local divergence made the pair start a new correction, which has already reached 23.6% fibo. The next downside targets may be 38.2% and 50.0% fibo at 107.99 and 107.71 respectively. The resistance is the high at 108.93.

USDJPY_H1
Risk Warning: the result of previous trading operations do not guarantee the same results in the future
rfxsignals October 21, 2019 No Comments

DAILY FREE FOREX SIGNALS FOR 21-10-2019 | Форекс – Сообщество Трейдеров |إشارات الفوركس|외환 신호

GBPUSD BUY-1.29939
SL-1.29407
TP1-1.30299
TP2-1.30681

GBPCHF BUY -1.27885
SL-1.27295
TP1-1.28128
TP2-1.28390

EURCAD SELL-1.46387
SL-1.46827
TP1-1.46218
TP2-1.46084

EURGBP SELL-0.85974
SL-0.86460
TP1-0.85780
TP2-0.85604

GBPJPY BUY -141.060
SL-140.280
TP1-141.331
TP2-141.546

EURNZD SELL-1.74210
SL-1.74840
TP1-1.74027
TP2-1.73805

CADCHF BUY -0.75132
SL-0.74839
TP1-0.75346
TP2-0.75553

EURAUD SELL-1.62344
SL-1.62731
TP1-1.62171
TP2-1.62033

RESULT

Yesterday GBPCHF BUY SIGNAL reaches target 1 and we get 24 pips profit now 🙂

Yesterday EURCAD SELL SIGNAL reaches target 2 and we get 30 pips profit now 🙂

Yesterday EURGBP SELL SIGNAL reaches target 1 and we get 18 pips profit now 🙂

Yesterday GBPJPY BUY SIGNAL reaches target 1 and we get 27 pips profit now 🙂

Yesterday EURNZD SELL SIGNAL reaches target 2 and we get 40 pips profit now 🙂

Yesterday CADCHF BUY SIGNAL reaches target 1 and we get 20 pips profit now 🙂

Yesterday EURAUD SELL SIGNAL reaches target 1 and we get 16 pips profit now 🙂

rfxsignals October 18, 2019 No Comments

DAILY FREE FOREX SIGNALS FOR 18-10-2019 | Форекс – Сообщество Трейдеров |إشارات الفوركس|외환 신호

EURJPY BUY -120.970
SL-120.564
TP1-121.159
TP2-121.313

GBPUSD BUY -1.29169
SL-1.28294
TP1-1.29425
TP2-1.29685

GBPCHF BUY -1.27538
SL-1.26592
TP1-1.27874
TP2-1.28192

USDCAD SELL-1.31338
SL-1.31656
TP1-1.31175
TP2-1.31004

CADJPY BUY -82.757
SL-82.376
TP1-82.899
TP2-83.051

GBPJPY BUY -140.371
SL-139.478
TP1-140.649
TP2-140.905

EURGBP SELL-0.86179
SL-0.86675
TP1-0.86007
TP2-0.85846

GBPCAD BUY -1.69599
SL-1.68691
TP1-1.69894
TP2-1.70177

AUDJPY BUY -74.342
SL-74.000
TP1-74.608
TP2-74.947

rfxsignals October 17, 2019 No Comments

DAILY FREE FOREX SIGNALS FOR 17-10-2019 | Форекс – Сообщество Трейдеров |إشارات الفوركس|외환 신호

GBPUSD SELL-1.27577
SL-1.28362
TP1-1.27341
TP2-1.27131

GBPJPY SELL-138.768
SL-139.632
TP1-138.499
TP2-138.230

GBPCAD SELL-1.68421
SL-1.69258
TP1-1.68190
TP2-1.67908

GBPAUD SELL-1.88041
SL-1.89074
TP1-1.87652
TP2-1.87274

GBPNZD SELL-2.02802
SL-2.03870
TP1-2.02441
TP2-2.02156

GBPCHF SELL-1.26694
SL-1.27394
TP1-1.26432
TP2-1.26232

EURGBP BUY -0.86814
SL-0.86087
TP1-0.87068
TP2-0.87287

Fibonacci Retracements Analysis 16.10.2019 (GBPUSD, EURJPY)

16.10.2019

GBPUSD, “Great Britain Pound vs US Dollar”

As we can see in the H4 chart, GBPUSD is rising within the mid-term correction. After the convergence, the pair has broken the high, as well as 50.0% fibo. Right now, the price is heading to reach its next upside target, 61.8% and 76.0% fibo at 1.2837 and 1.3040 respectively. The support is 38.2% fibo at 1.2500.

GBPUSD_H4
Risk Warning: the result of previous trading operations do not guarantee the same results in the future

In the H1 chart, there is a divergence on MACD, which indicates a new pullback in the nearest future. Possibly, the pair may reach 61.8% fibo at 1.2837 and then start a new descending correction. The targets are 23.6%, 38.2%, 50.0%, and 61.8% fibo at 1.2686, 1.2592, 1.2516, and 1.2441 respectively.

GBPUSD_H1
Risk Warning: the result of previous trading operations do not guarantee the same results in the future

EURJPY, “Euro vs. Japanese Yen”

As we can see in the H4 chart, EURJPY is testing its previous high. The current rising impulse helped to continue the mid-term correction; the closest upside target is 61.8% fibo at 120.50. The next targets may be inside the post-correctional extension area between 138.2% and 161.8% fibo at 121.14 and 121.82 respectively. Inside the same area, there is mid-term 76.0% fibo at 121.55. The support is at 117.07.

EURJPY_H4
Risk Warning: the result of previous trading operations do not guarantee the same results in the future

In the H1 chart, there is a divergence on MACD. We may assume that after reaching 61.8% fibo at 120.50, the instrument may resume falling towards 23.6%, 38.2%, 50.0%, and 61.8% fibo at 119.69, 119.19, 118.79, and 118.38 respectively.

EURJPY_H1