Fibonacci Retracements Analysis 26.09.2019 (AUDUSD, USDCAD)

26.09.2019

AUDUSD, “Australian Dollar vs US Dollar”

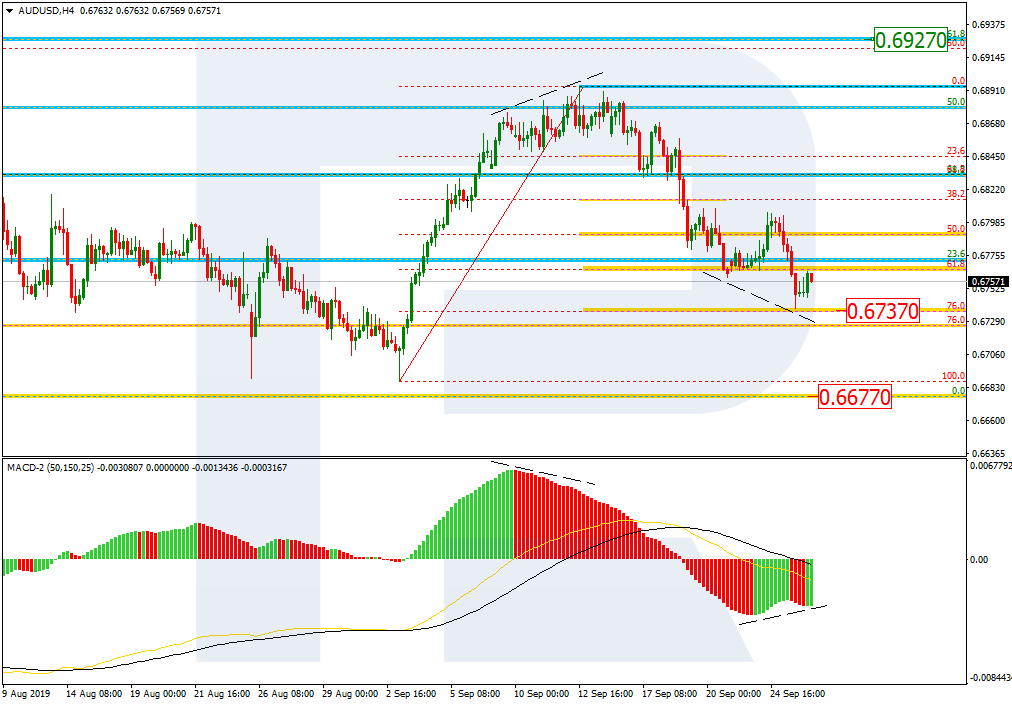
As we can see in the H4 chart, the current descending wave after the divergence has almost reached 76.0% fibo at 0.6737. The stable descending movement along with MACD lines indicate at further decline to reach and break the key low at 0.6677. At the same time, a local convergence on the Oscillator may hint at another pullback or even a new rising impulse towards 61.8% fibo at 0.6927.

AUDUSD_H4
Risk Warning: the result of previous trading operations do not guarantee the same results in the future

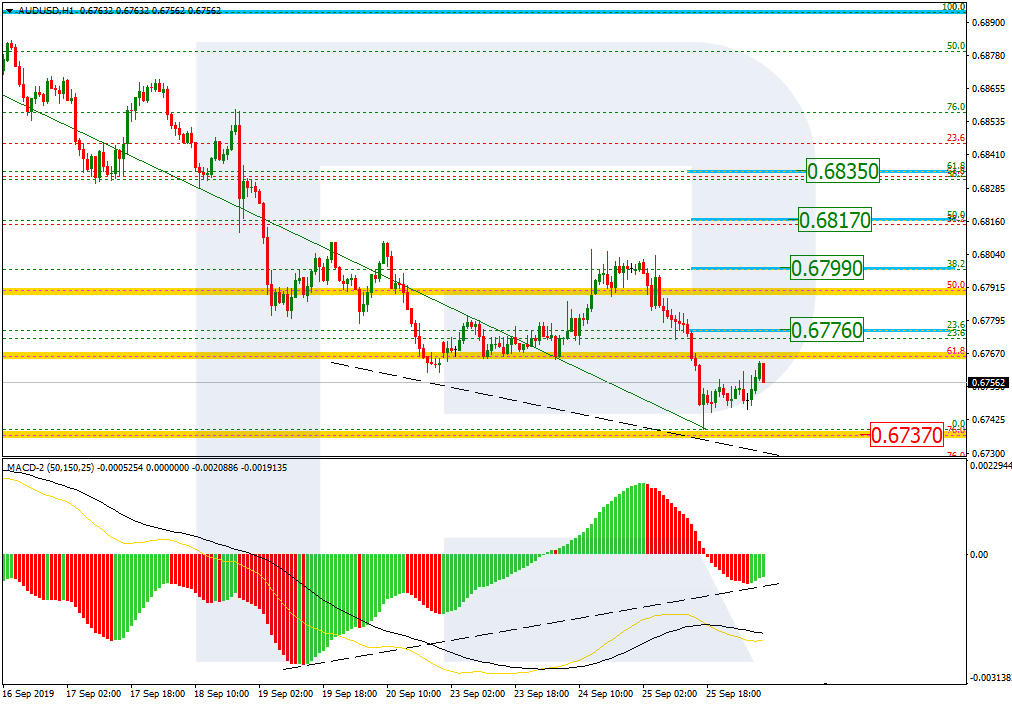
Taking into account the convergence on MACD in the H1 chart, we may assume that AUDUSD may correct towards 23.6%, 38.2%, 50.0%, and 61.8% fibo at 0.6776, 0.6799, 0.6817, and 0.6835 respectively. The support is the low at 0.6737.

AUDUSD_H1
Risk Warning: the result of previous trading operations do not guarantee the same results in the future

USDCAD, “US Dollar vs Canadian Dollar”

As we can see in the H4 chart, after finishing the ascending impulse, USDCAD has started a new correction, which may later transform into a new descending wave towards mid-term 76.0% fibo at 1.3103. However, if the correction breaks the local high at 1.3310, the instrument may continue growing to reach 1.3382.

USDCAD_H4
Risk Warning: the result of previous trading operations do not guarantee the same results in the future

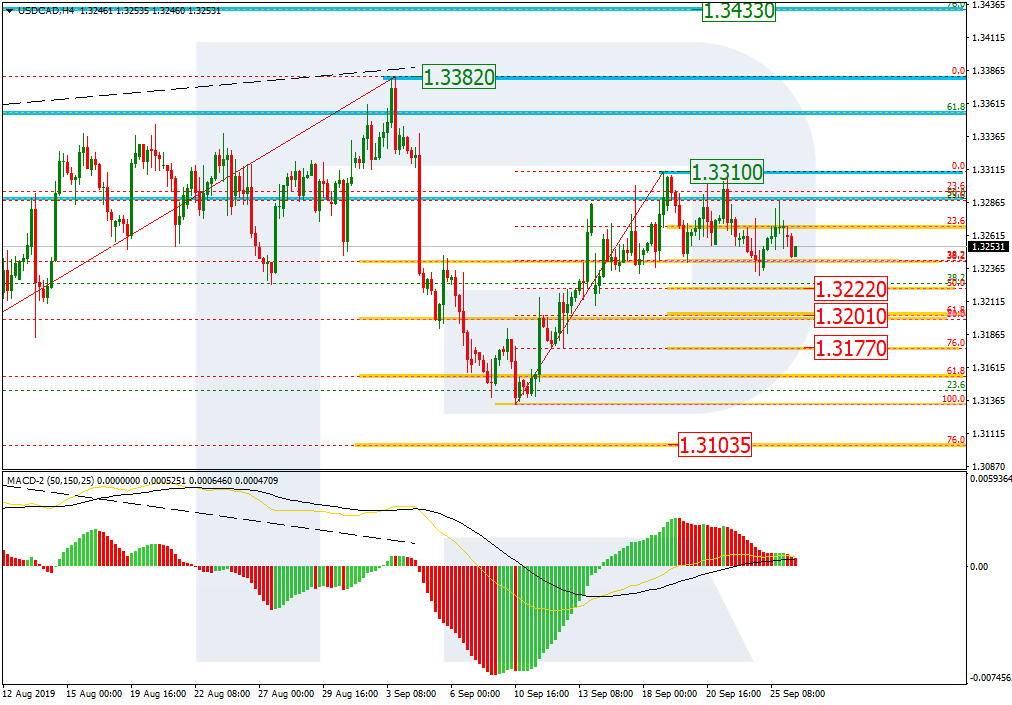
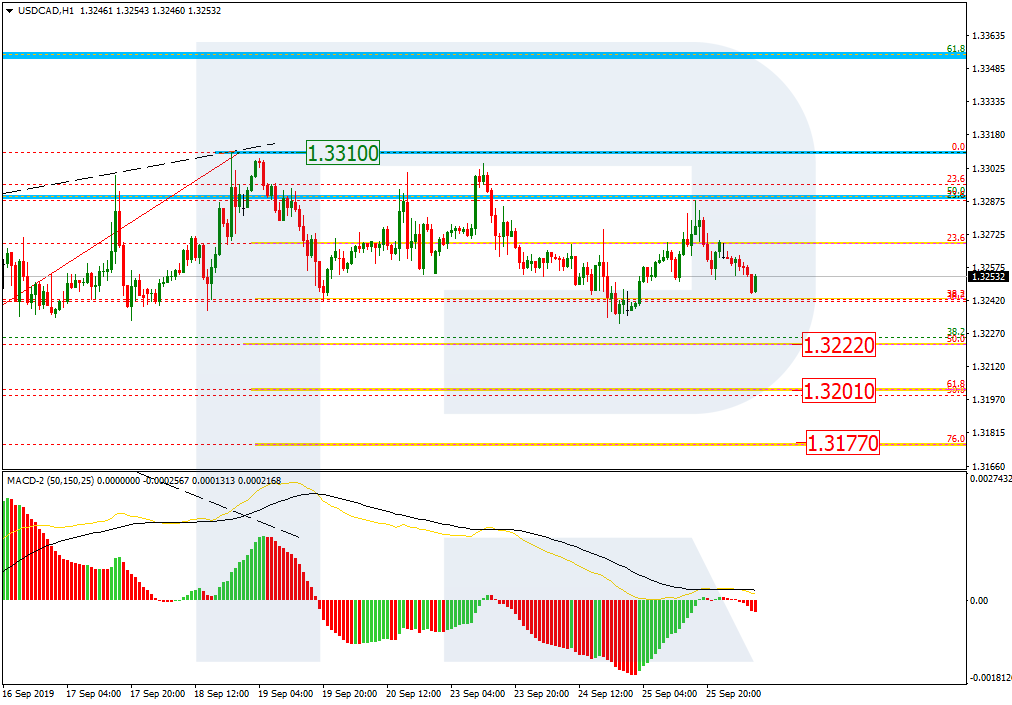
In the H1 chart, the divergence on MACD made the pair start a new decline, which has already reached 38.2% fibo. In the future, the price may continue falling towards 50.0%, 61.8%, and 76.0% fibo at 1.3222, 1.3201, and 1.3177 respectively. The resistance is the high at 1.3310.

USDCAD_H1
Risk Warning: the result of previous trading operations do not guarantee the same results in the future
rfxsignals September 26, 2019 No Comments

DAILY FREE FOREX SIGNALS FOR 26-09-2019 | Форекс – Сообщество Трейдеров |إشارات الفوركس|외환 신호

GBPAUD SELL-1.82765
SL-1.83489
TP1-1.82572
TP2-1.82344

EURCAD SELL-1.44990
SL-1.45443
TP1-1.44789
TP2-1.44541

EURAUD SELL-1.61949
SL-1.62399
TP1-1.61751
TP2-1.61550

GBPCAD SELL-1.63489
SL-1.64204
TP1-1.63231
TP2-1.63015

CADCHF BUY -0.74995
SL-0.74535
TP1-0.75193
TP2-0.75395

GBPNZD SELL-1.95776
SL-1.96638
TP1-1.95438
TP2-1.95079

NZDCHF BUY -0.62635
SL-0.62086
TP1-0.62862
TP2-0.63054

EURNZD SELL-1.73601
SL-1.74534
TP1-1.73324
TP2-1.73056

EURJPY SELL-117.746
SL-118.192
TP1-117.556
TP2-117.379

GBPUSD SELL-1.23279
SL-1.24001
TP1-1.23040
TP2-1.22804

rfxsignals September 25, 2019 No Comments

DAILY FREE FOREX SIGNALS FOR 25-09-2019 | Форекс – Сообщество Трейдеров |إشارات الفوركس|외환 신호

EURJPY SELL-117.928
SL-118.361
TP1-117.769
TP2-117.627

GBPCHF SELL-1.22620
SL-1.23283
TP1-1.22375
TP2-1.22124

GBPUSD SELL-1.24431
SL-1.24848
TP1-1.24224
TP2-1.23982

GBPNZD SELL-1.96828
SL-1.97239
TP1-1.96590
TP2-1.96309

AUDCHF SELL-0.66865
SL-0.67253
TP1-0.66662
TP2-0.66514

AUDNZD SELL-1.07135
SL-1.07724
TP1-1.06916
TP2-1.06705

AUDUSD SELL-0.67777
SL-0.68248
TP1-0.67546
TP2-0.67329

AUDCAD SELL-0.89890
SL-0.90325
TP1-0.89688
TP2-0.89479

Fibonacci Retracements Analysis 25.09.2019 (GBPUSD, EURJPY)

25.09.2019

GBPUSD, “Great Britain Pound vs US Dollar”

As we can see in the H4 chart, there was a divergence on MACD, which made the pair start a new descending tendency after reaching 50.0% fibo. GBPUSD is slowly falling to reach 23.6% fibo, but a local ascending impulse hints at a new growth towards the high at 1.2518 and then mid-term 61.8% fibo at 1.2710. However, the key scenario implies further decline towards 38.2%, 50.0%, and 61.8% fibo at 1.2344, 1.2270, and 1.2197 respectively.

GBPUSD_H4
Risk Warning: the result of previous trading operations do not guarantee the same results in the future

In the H1 chart, the pair is forming a new short-term correction after finishing another descending impulse. By now, the pullback has already reached 50.0% fibo and may yet continue towards 61.8% fibo at 1.2517. If the price breaks the local low at 1.2412, the mid-term decline may continue.

GBPUSD_H1
Risk Warning: the result of previous trading operations do not guarantee the same results in the future

EURJPY, “Euro vs. Japanese Yen”

As we can see in the H4 chart, after completing the correctional uptrend at 50.0% fibo, EURJPY is quickly trading downwards. By now, it has already reached 50.0% fibo. After finishing a short-term correction, the price may continue falling towards 61.8% and 76.0% fibo at 117.45 and 116.86 respectively. The key support is the low at 115.86.

EURJPY_H4
Risk Warning: the result of previous trading operations do not guarantee the same results in the future

In the H1 chart, the price is correcting upwards and has already reached 38.2% fibo. The next correctional wave may be heading towards 50.0% and 61.8% fibo at 118.79 and 119.02 respectively. The support is the low at 117.75.

EURJPY_H1
Risk Warning: the result of previous trading operations do not guarantee the same results in the future

Back to listAttention!

Forecasts presented in this section only reflect the author’s private opinion and should not be considered as guidance for trading. RoboForex bears no responsibility for trading results based on trading recommendations described in these analytical reviews.

rfxsignals September 24, 2019 No Comments

DAILY FREE FOREX SIGNALS FOR 24-09-2019 | Форекс – Сообщество Трейдеров |إشارات الفوركس|외환 신호

USDZAR 14.91130
SL-14.86887
TP1-14.92517
TP2-14.94403

AUDCHF BUY -0.67124
SL-0.66767
TP1-0.67317
TP2-0.67457

GBPAUD SELL-1.83411
SL-1.84059
TP1-1.83123
TP2-1.82895

USDJPY BUY -107.648
SL-107.276
TP1-107.872
TP2-108.074

EURAUD SELL-1.62005
SL-1.62563
TP1-1.61732
TP2-1.61453

AUDJPY BUY -73.021
SL-72.602
TP1-73.196
TP2-73.373

USDCAD SELL-1.32560
SL-1.33027
TP1-1.32373
TP2-1.32177

AUDUSD BUY -0.67826
SL-0.67440
TP1-0.68044
TP2-0.68295

NZDJPY BUY -67.848
SL-67.376
TP1-68.059
TP2-68.266

NZDUSD BUY -0.63039
SL-0.62641
TP1-0.63256
TP2-0.63398

rfxsignals September 20, 2019 No Comments

DAILY FREE FOREX SIGNALS FOR 20-09-2019 | Форекс – Сообщество Трейдеров |إشارات الفوركس|외환 신호

EURAUD SELL-1.62548
SL-1.62988
TP1-1.62361
TP2-1.62218

GBPCHF SELL-1.23907
SL-1.24400
TP1-1.23674
TP2-1.23405

EURJPY SELL-119.209
SL-119.634
TP1-119.035
TP2-118.877

EURCAD SELL-1.46406
SL-1.46859
TP1-1.46218
TP2-1.46042

AUDUSD SELL-0.67896
SL-0.68295
TP1-0.67709
TP2-0.67551

CADJPY BUY -81.427
SL-81.056
TP1-81.550
TP2-81.732

rfxsignals September 19, 2019 No Comments

DAILY FREE FOREX SIGNALS FOR 19-09-2019 | Форекс – Сообщество Трейдеров |إشارات الفوركس|외환 신호

USDCHF SELL-0.99083
SL-0.99618
TP1-0.98883
TP2-0.98694

GBPUSD BUY -1.25008
SL-1.24497
TP1-1.25255
TP2-1.25543

USDJPY SELL-107.966
SL-108.464
TP1-107.773
TP2-107.595

GBPJPY BUY -134.988
SL-134.404
TP1-135.220
TP2-135.448

GBPCAD BUY -1.66169
SL-1.65525
TP1-1.66412
TP2-1.66682

GBPNZD BUY -1.98002
SL-1.97131
TP1-1.98342
TP2-1.98644

GBPCHF SELL-1.23722
SL-1.24253
TP1-1.23524
TP2-1.23347

EURUSD BUY -1.10748
SL-1.10418
TP1-1.10858
TP2-1.10989

GBPUSD BUY -1.25127
SL-1.24739
TP1-1.25311
TP2-1.25523

CHFJPY BUY -108.985
SL-108.763
TP1-109.155
TP2-109.307

EURCAD BUY -1.47006
SL-1.46637
TP1-1.47207
TP2-1.47375

GBPJPY SELL-134.600
SL-135.131
TP1-134.363
TP2-134.174

EURGBP BUY -0.88793
SL-0.88249
TP1-0.89006
TP2-0.89209

GOLD BUY -1497.72
SL-1490.39
TP1-1500.19
TP2-1503.09

GBPAUD SELL-1.83415
SL-1.84568
TP1-1.82751
TP2-1.82038
TP3-1.80690

Fibonacci Retracements Analysis 17.09.2019 (EURUSD, USDJPY)

17.09.2019

EURUSD, “Euro vs US Dollar”

As we can see in the H4 chart, after reaching the post-correctional extension area between 138.2% and 161.8% fibo at 1.0942 and 1.0889 respectively again, EURUSD tried to grow and reach 61.8% fibo at 1.1126, but unsuccessfully. The current decline may be considered as a descending correction. The structure of this correction indicates uncertainty among investors, “turbulence” on the market, and a possibility of further expansion of the range, but the descending tendency is not over yet. Hence, the correction may yet continue to reach 61.8% and 76.0% fibo at 1.1126 and 1.1172 respectively in the short-term, but the key long-term targets are below the lows.

EURUSD_H4
Risk Warning: the result of previous trading operations do not guarantee the same results in the future

In the H1 chart, the local correction has reached 61.8% fibo, but the decline may yet continue towards 76.0% fibo at 1.0971. Later, the instrument may start a new rising impulse to reach the high at 1.1109.

EURUSD_H1
Risk Warning: the result of previous trading operations do not guarantee the same results in the future

USDJPY, “US Dollar vs. Japanese Yen”

As we can see in the H4 chart, the correctional uptrend continues; it has almost reached 50.0% fibo at 108.42. At the same time, there is a divergence on MACD, which indicates a possible short-term pullback towards 38.2% fibo at 107.48. After the correction, USDJPY may resume moving upwards to reach 61.8% fibo at 109.37.

USDJPY_H4
Risk Warning: the result of previous trading operations do not guarantee the same results in the future

In the H1 chart, there is a divergence on MACD within the uptrend, so we may try to define possible targets of the oncoming pullback. In case of the correctional downtrend, they may be 23.6%, 38.2%, and 50.0% fibo at 107.75, 107.36, and 107.06 respectively.

USDJPY_H1
Risk Warning: the result of previous trading operations do not guarantee the same results in the future

Back to listAttention!

Forecasts presented in this section only reflect the author’s private opinion and should not be considered as guidance for trading. RoboForex bears no responsibility for trading results based on trading recommendations described in these analytical reviews.

rfxsignals September 18, 2019 No Comments

DAILY FREE FOREX SIGNALS FOR 18-09-2019 | Форекс – Сообщество Трейдеров |إشارات الفوركس|외환 신호

EURUSD SELL-1.10634
SL-1.11029
TP1-1.10427
TP2-1.10218

GBPUSD SELL-1.24805
SL-1.25329
TP1-1.24584
TP2-1.24388

GBPCHF SELL01.24032
SL-1.24370
TP1-1.23892
TP2-1.23727

AUDUSD SELL-0.68471
SL-0.68897
TP1-0.68285
TP2-0.68103

EURCAD SELL-1.46621
SL-1.47090
TP1-1.46459
TP2-1.46301

AUDCAD SELL-0.90739
SL-0.91227
TP1-0.90513
TP2-0.90277

GBPCAD SELL-1.65407
SL-1.65994
TP1-1.65204
TP2-1.65018

NZDUSD SELL-0.63336
SL-0.63722
TP1-0.63139
TP2-0.62962

Fibonacci Retracements Analysis 16.09.2019 (GOLD, USDCHF)

16.09.2019

XAUUSD, “Gold vs US Dollar”

As we can see in the H4 chart, after reaching 38.2% fibo, XAUUSD has returned to 23.6% fibo. The current movement may be considered as a short-term correction before a new descending wave. The next downside targets may be 50.0%, 61.8%, and 76.0% fibo at 1478.60, 1460.25, and 1438.20 respectively. The key resistance is the high at 1557.00.

GOLD_H4
Risk Warning: the result of previous trading operations do not guarantee the same results in the future

In the H1 chart, the convergence made the pair start a new pullback to the upside, which has already reached 50.0% fibo. The next upside targets may be 61.8% and 76.0% fibo at 1529.35 and 1539.60 respectively. The key support is the low at 1484.38.

GOLD_H1
Risk Warning: the result of previous trading operations do not guarantee the same results in the future

USDCHF, “US Dollar vs Swiss Franc”

As we can see in the H4 chart, the correctional uptrend has already reached 50.0% fibo. At the same time, there is a divergence on MACD, which may indicates a new descending wave. However, as long as the price doesn’t break the support at 0.9797, USDCHF is expected to continue growing towards the post-correctional extension area between 138.2% and 161.8% fibo at 0.9980 and 1.0010 respectively, as well as 61.8% fibo at 1.0016.

USDCHF_H4
Risk Warning: the result of previous trading operations do not guarantee the same results in the future

In the H1 chart, after reaching 61.8% fibo, USDCHF is correcting upwards. As long as the indicator lines are directed to the downside, one shouldn’t exclude a possibility that the price may fall to reach 76.0% fibo at 09833, while the rising impulse will be heading towards 0.9947.

USDCHF_H1
Risk Warning: the result of previous trading operations do not guarantee the same results in the future

Back to listAttention!

Forecasts presented in this section only reflect the author’s private opinion and should not be considered as guidance for trading. RoboForex bears no responsibility for trading results based on trading recommendations described in these analytical reviews.