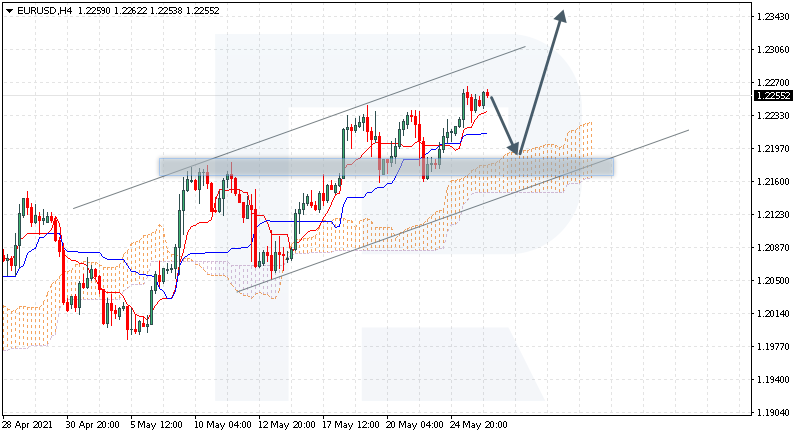
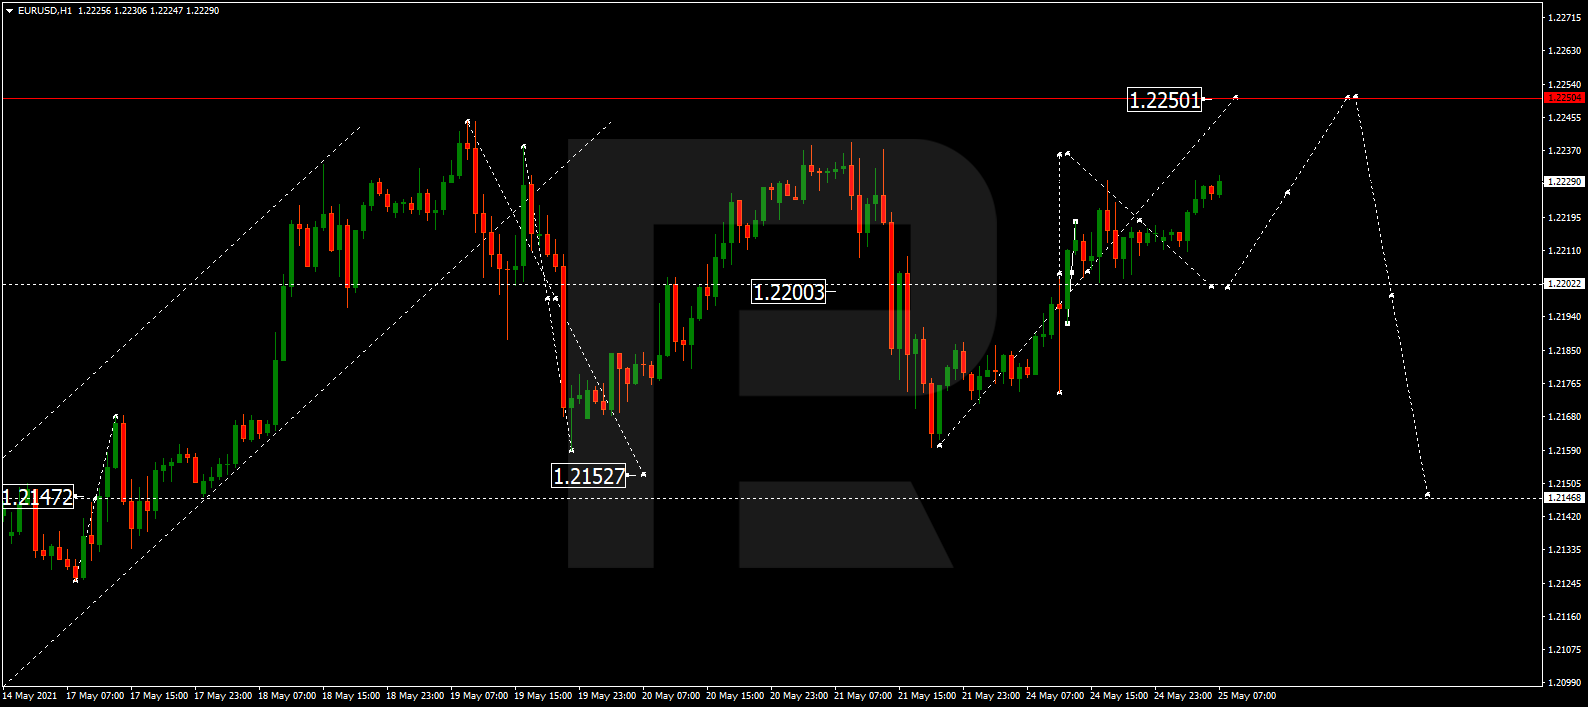
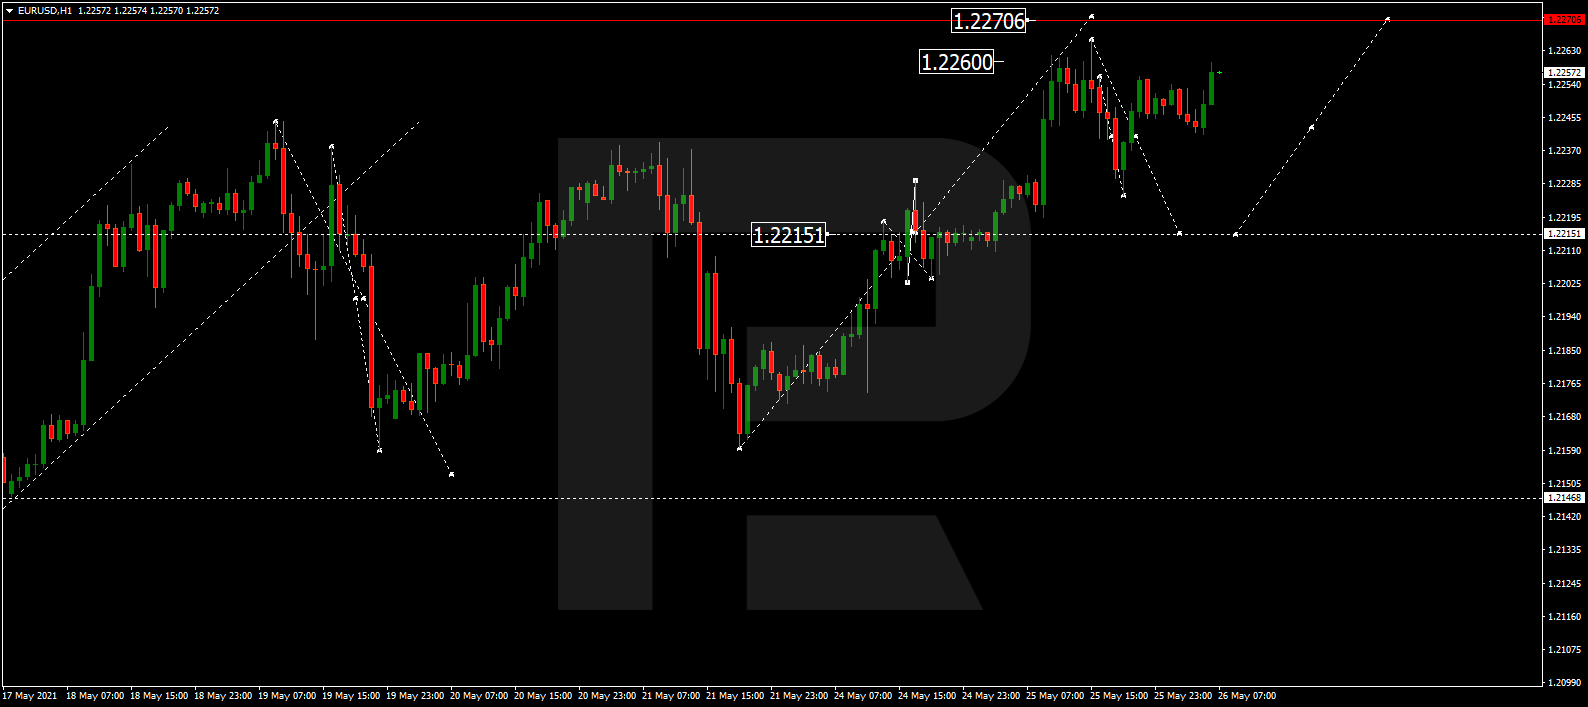
EURUSD, “Euro vs US Dollar”
After finishing the ascending structure at 1.2215 and forming a new consolidation range around this level, EURUSD has broken it to the upside to reach the short-term target at 1.2260. Today, the pair may correct to test 1.2215 from above and then form one more ascending structure to reach 1.2270. Later, the market may break this level and continue trading downwards with the target at 1.2150.

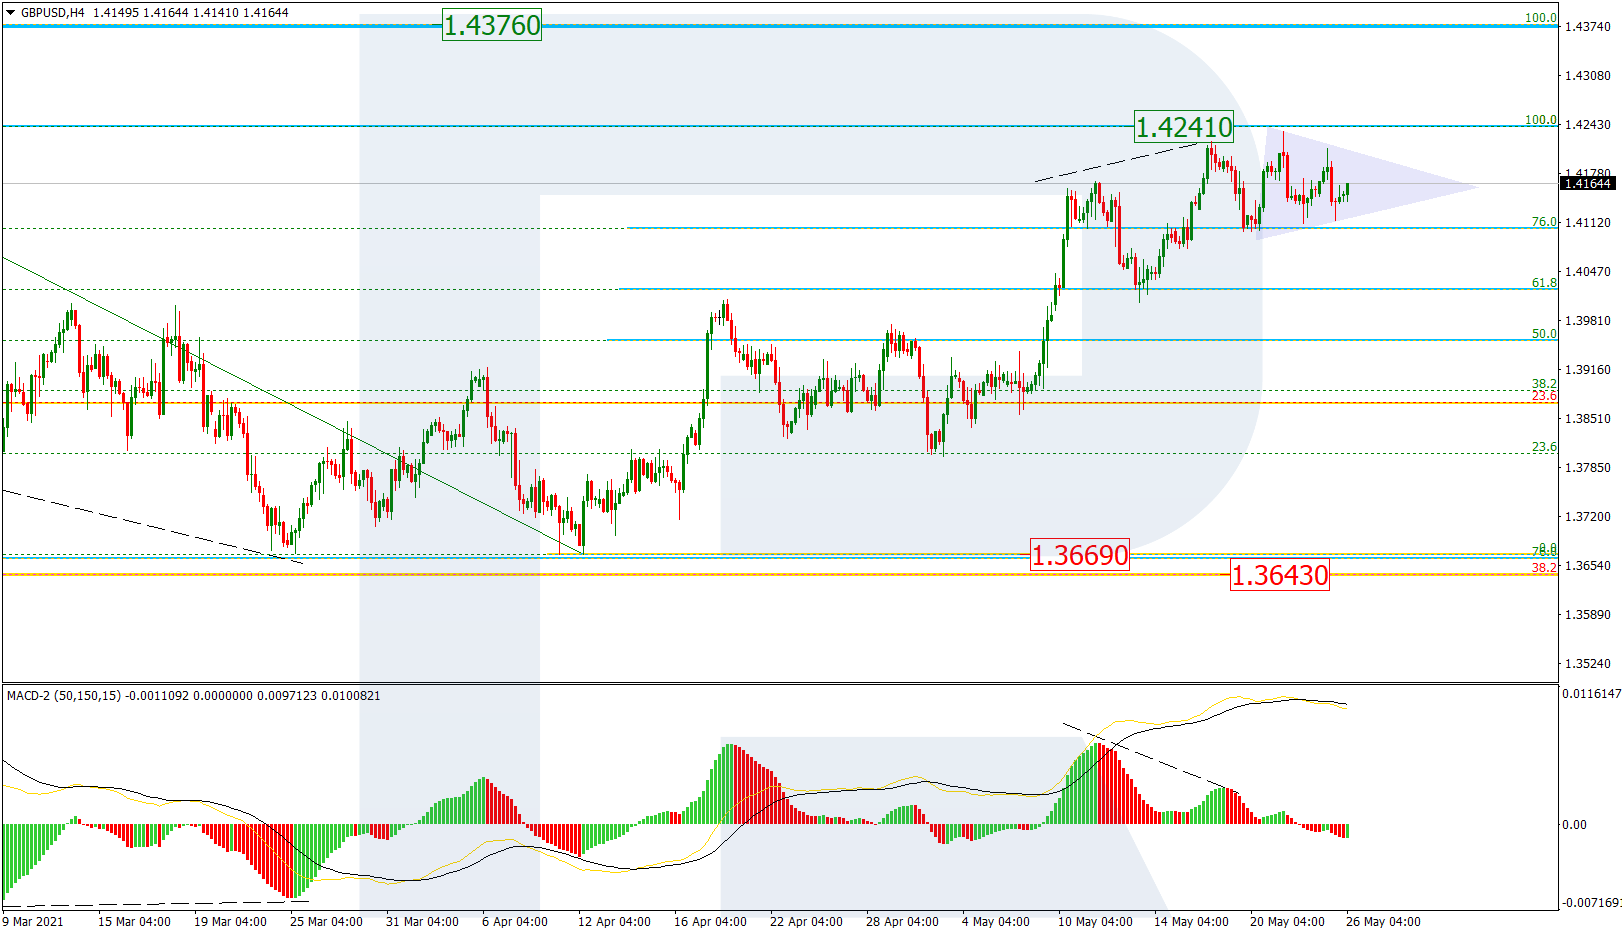
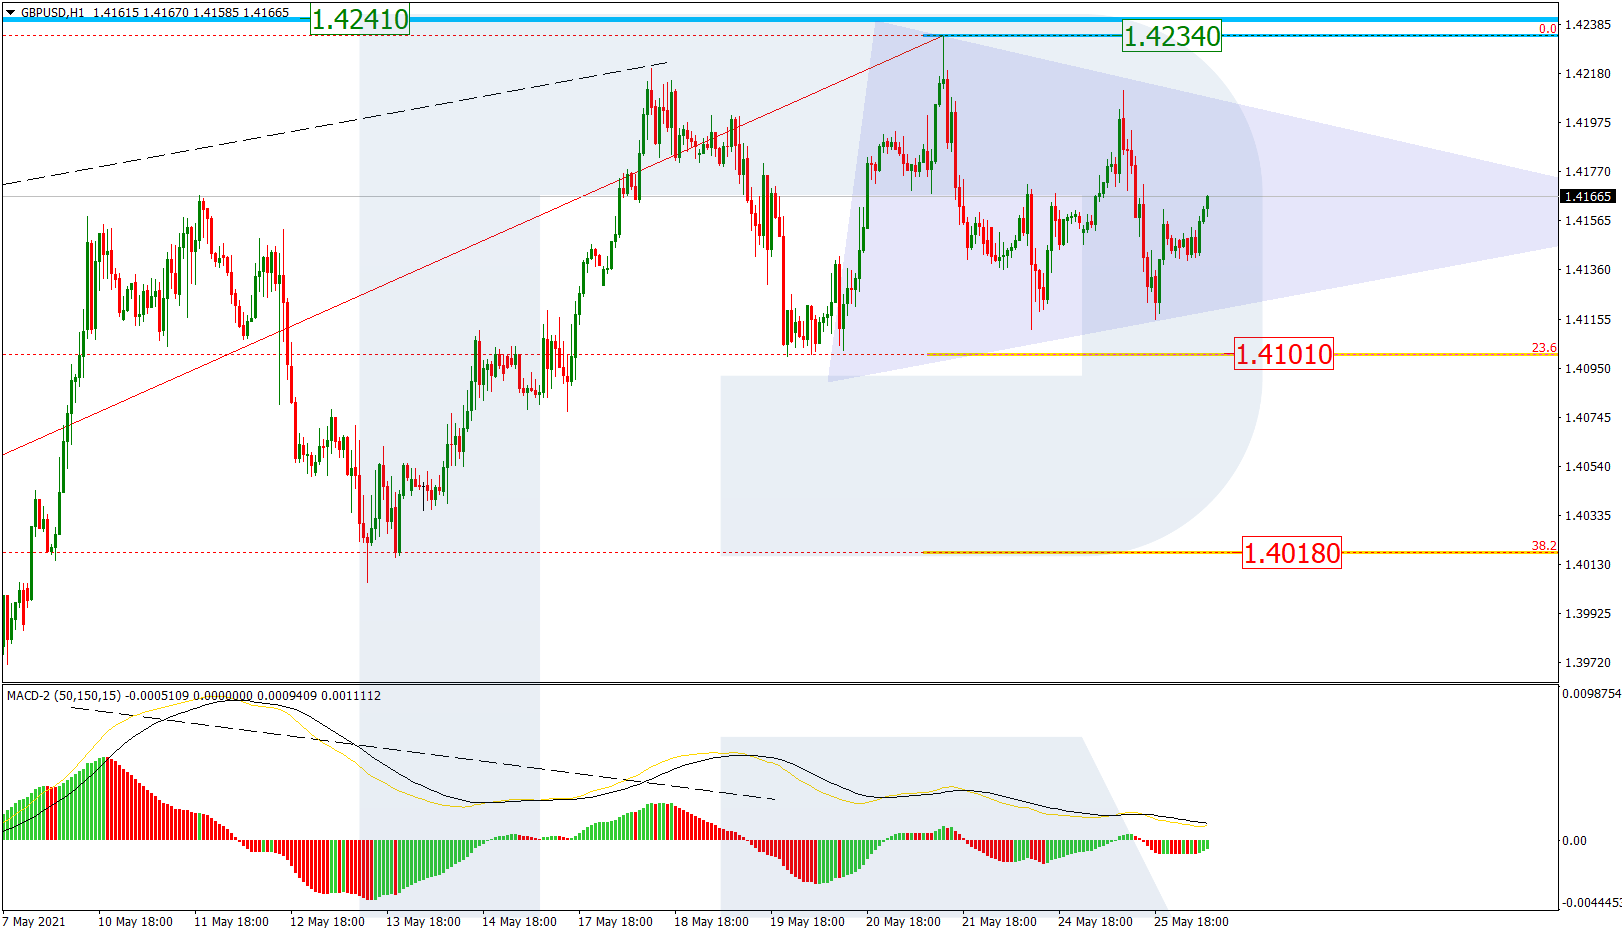
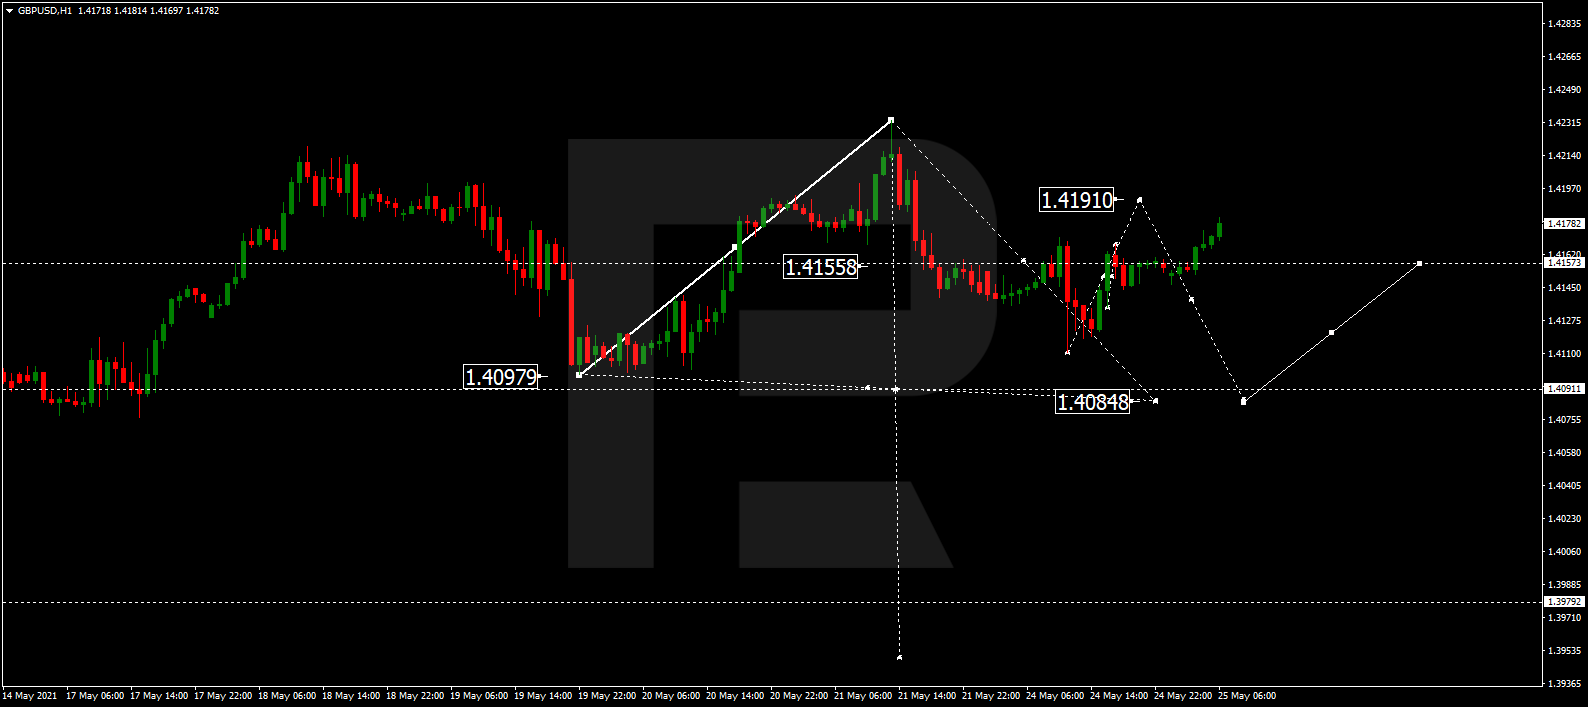
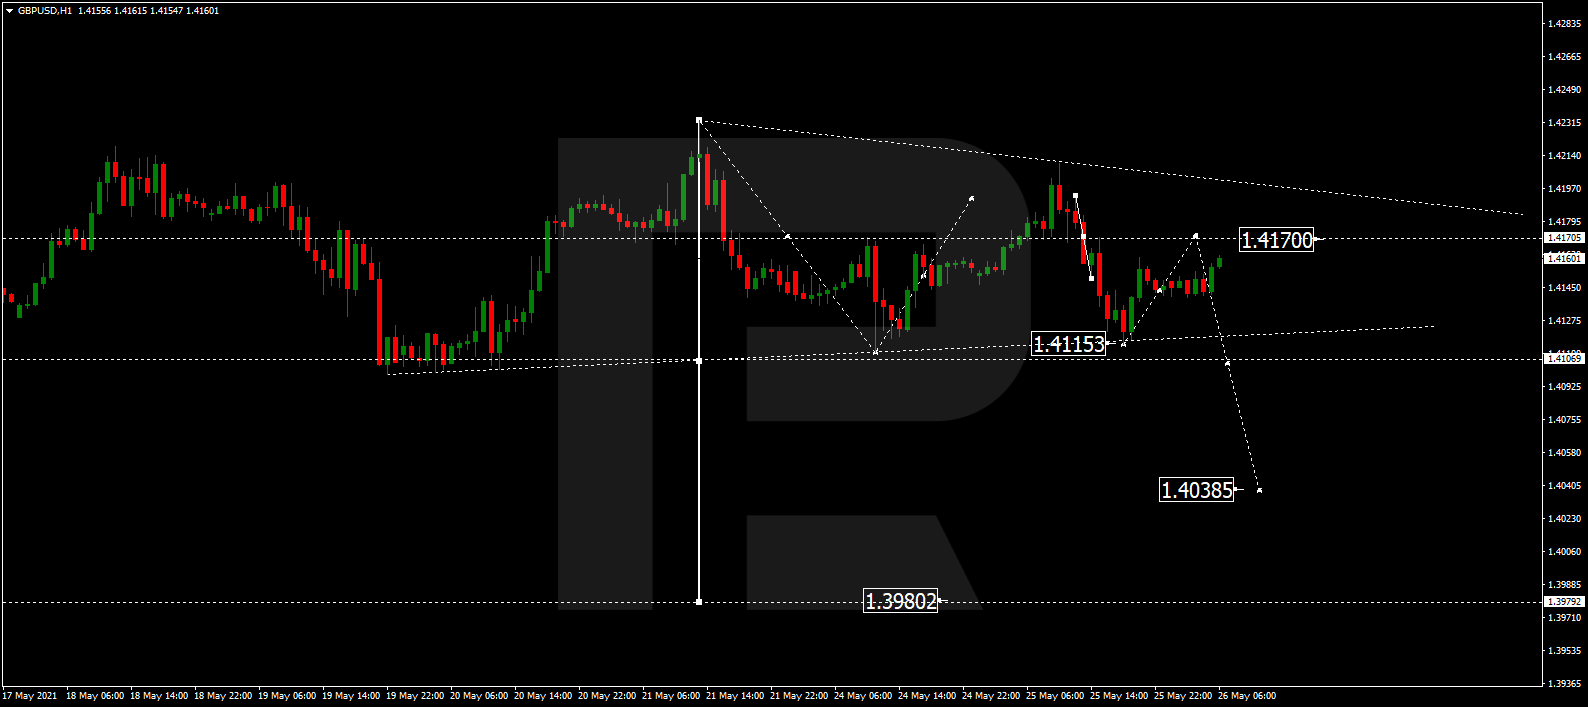
GBPUSD, “Great Britain Pound vs US Dollar”
GBPUSD is still consolidating around 1.4170. Possibly, today the pair may form a new descending structure to break 1.4115 and then continue falling with the short-term target at 1.4038.
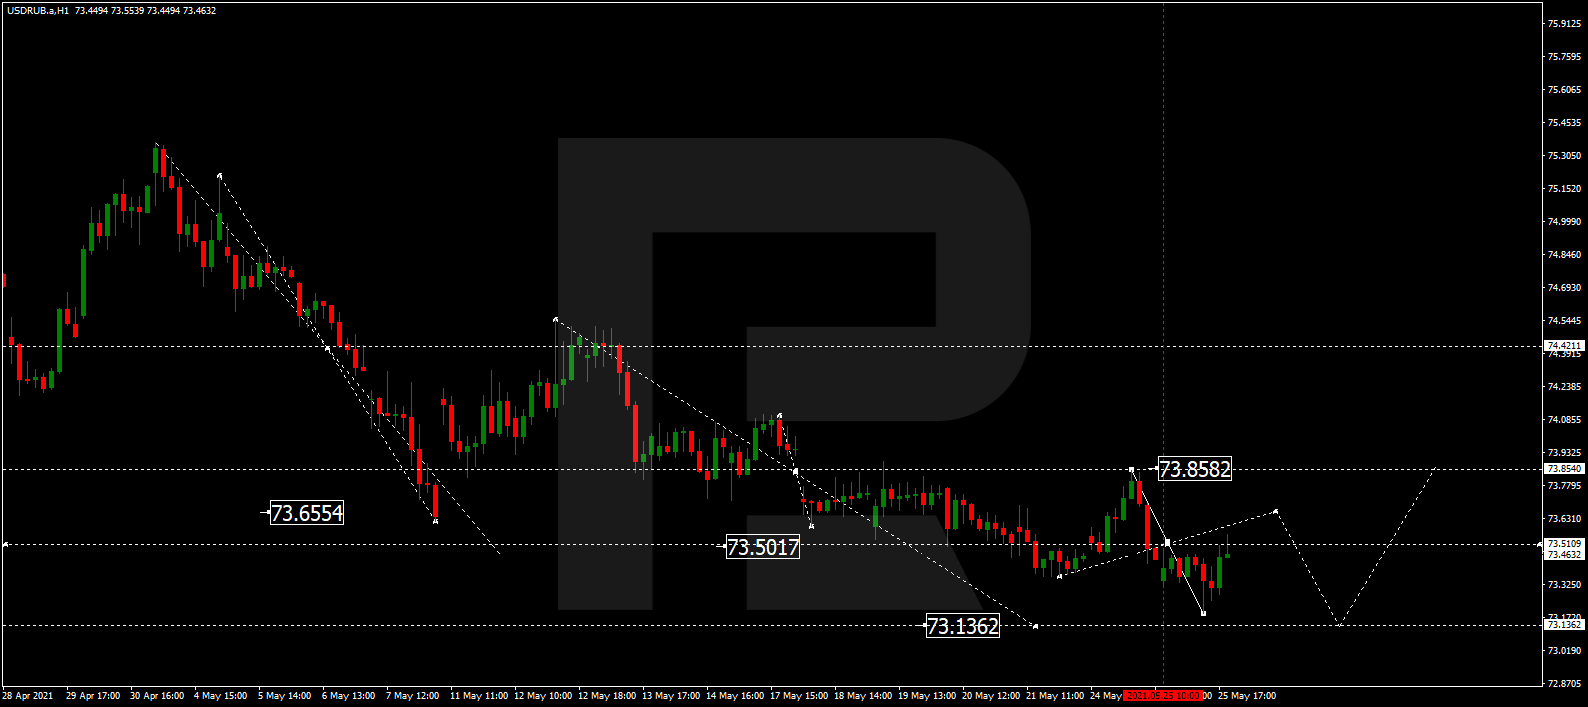
USDRUB, “US Dollar vs Russian Ruble”
USDRUB has completed the descending wave at 73.22. Today, the pair may correct towards 73.50 and then resume trading within the downtrend with the target at 73.14 or even reach 72.00.
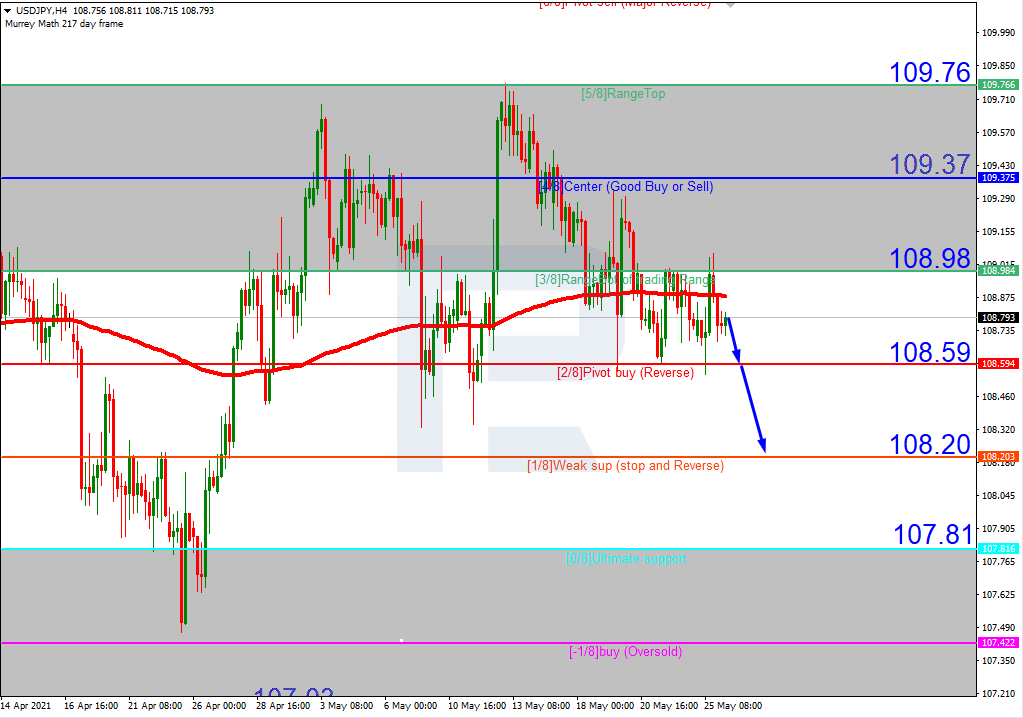
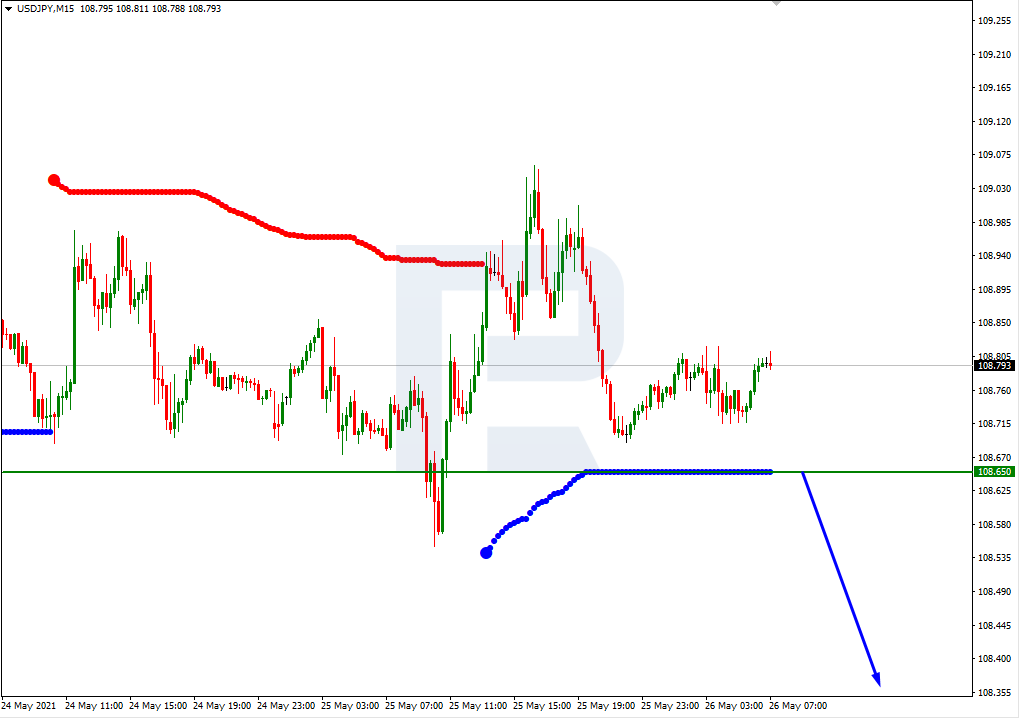
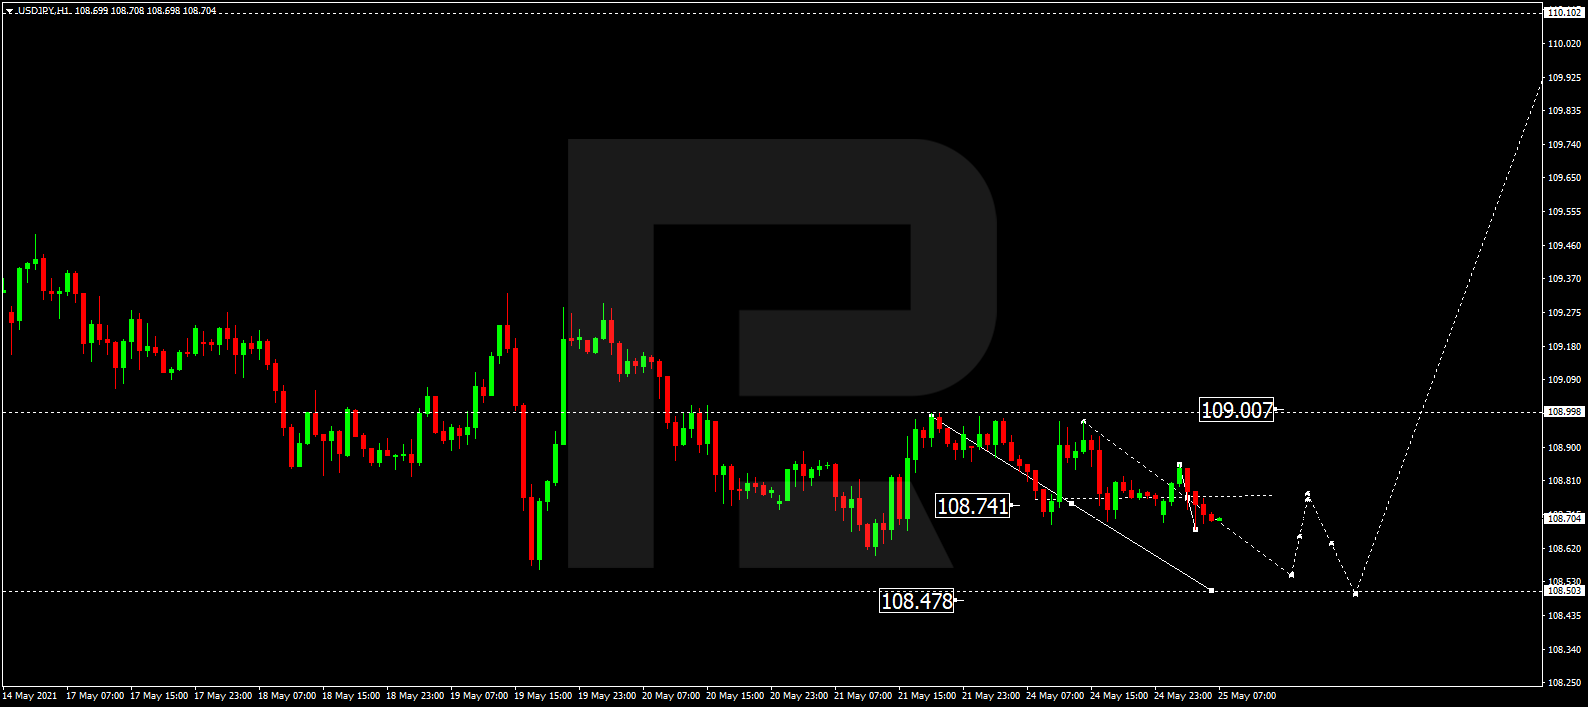
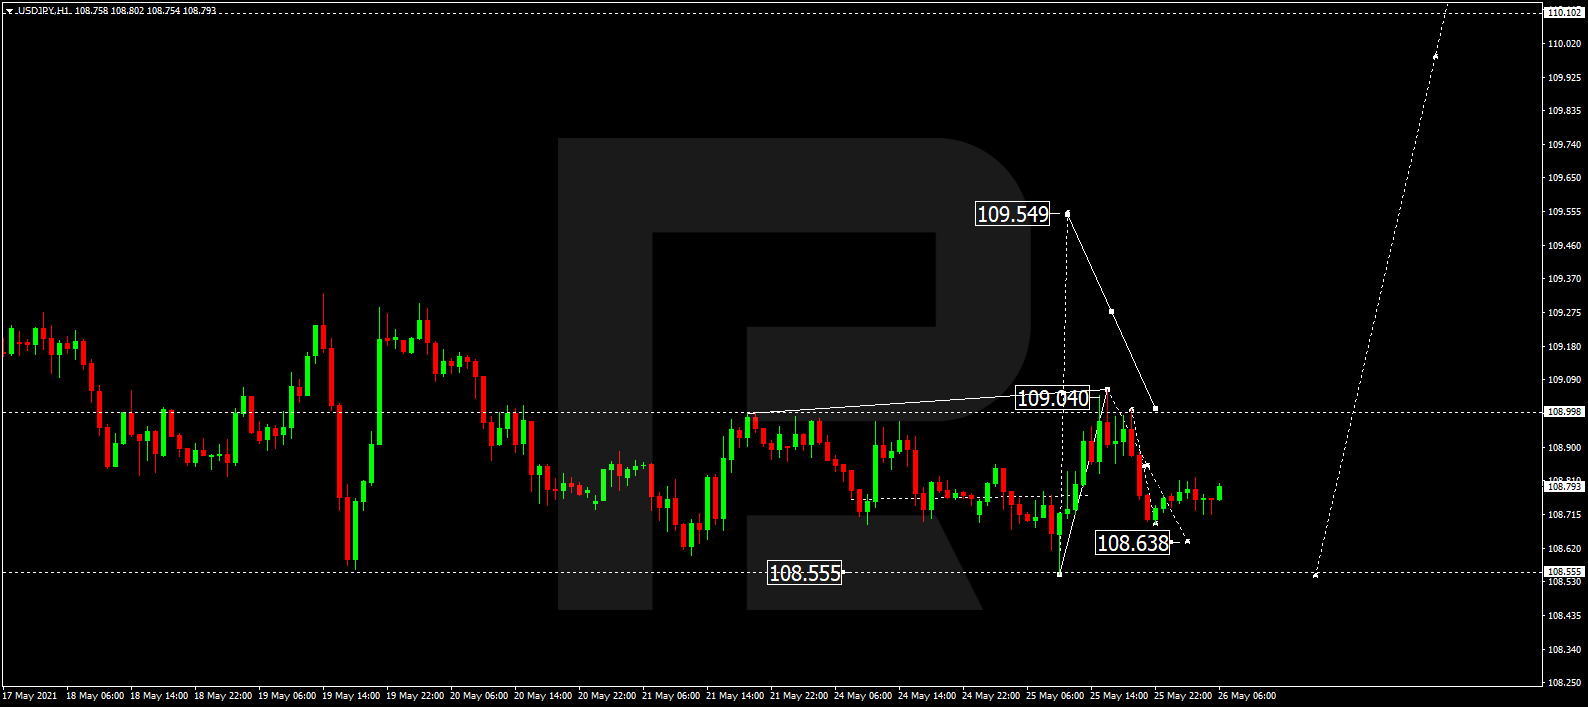
USDJPY, “US Dollar vs Japanese Yen”
After updating 108.55 and then finishing the ascending impulse at 109.04, USDJPY is correcting towards 108.64, thus forming a new consolidation range at the lows. Possibly, the pair may break the range to the upside and form one more ascending structure with the target at 109.55.
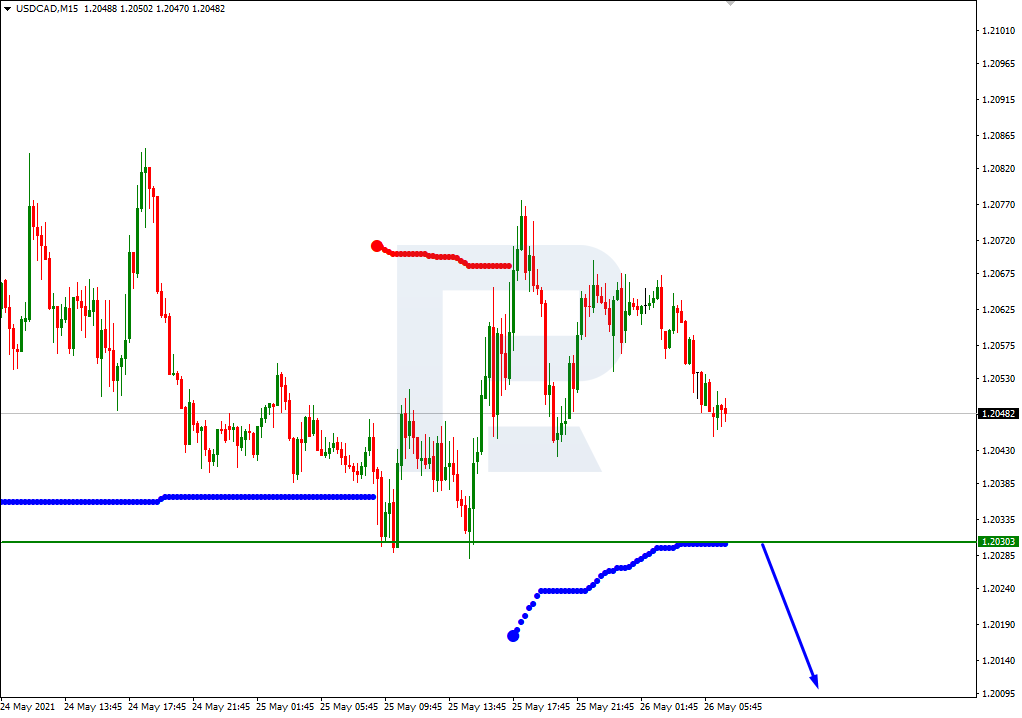
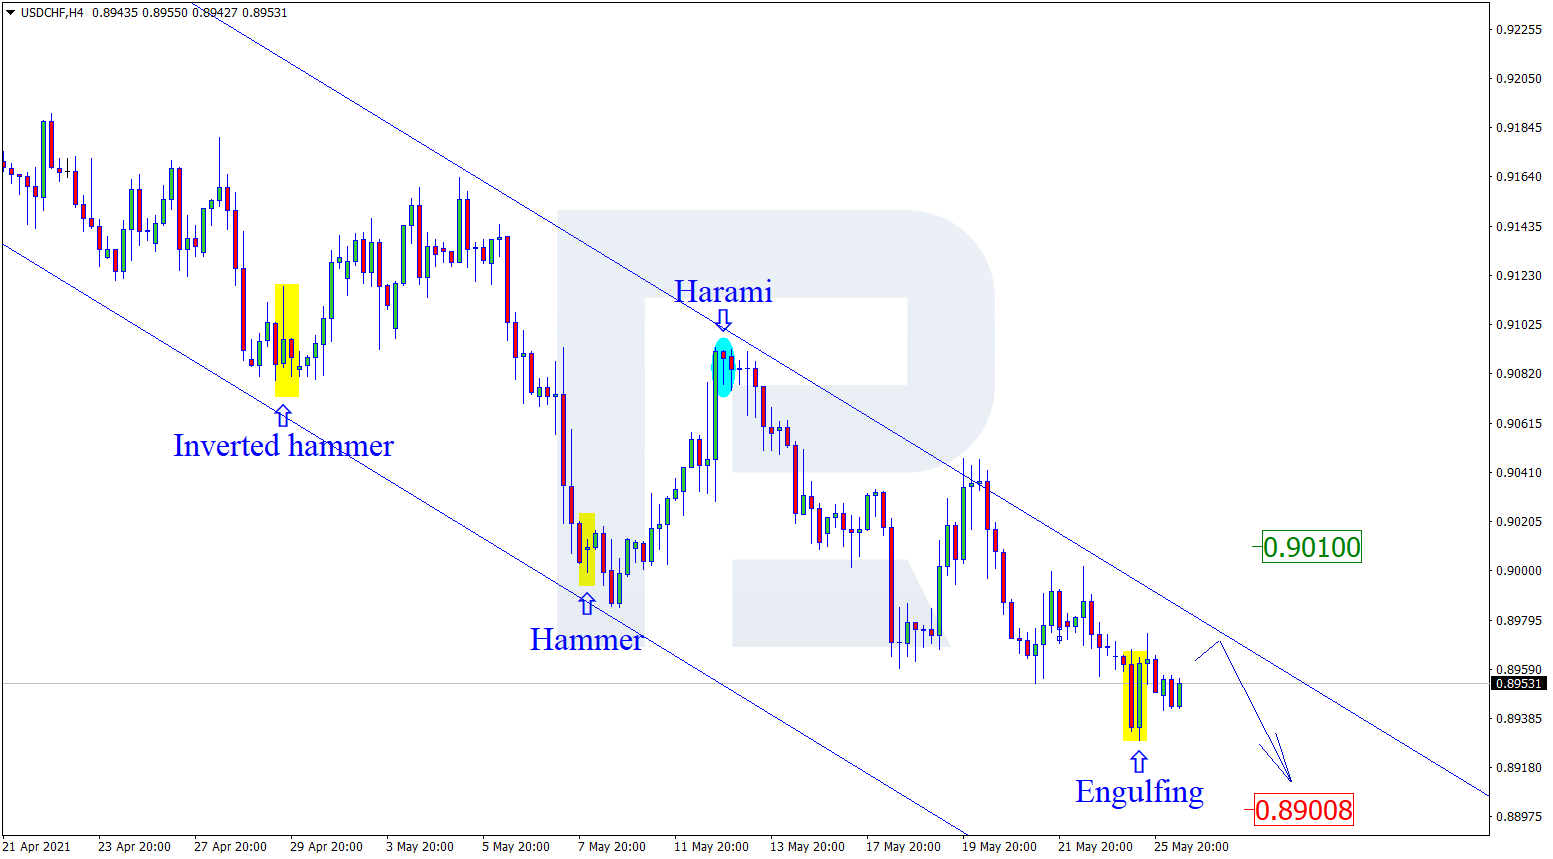
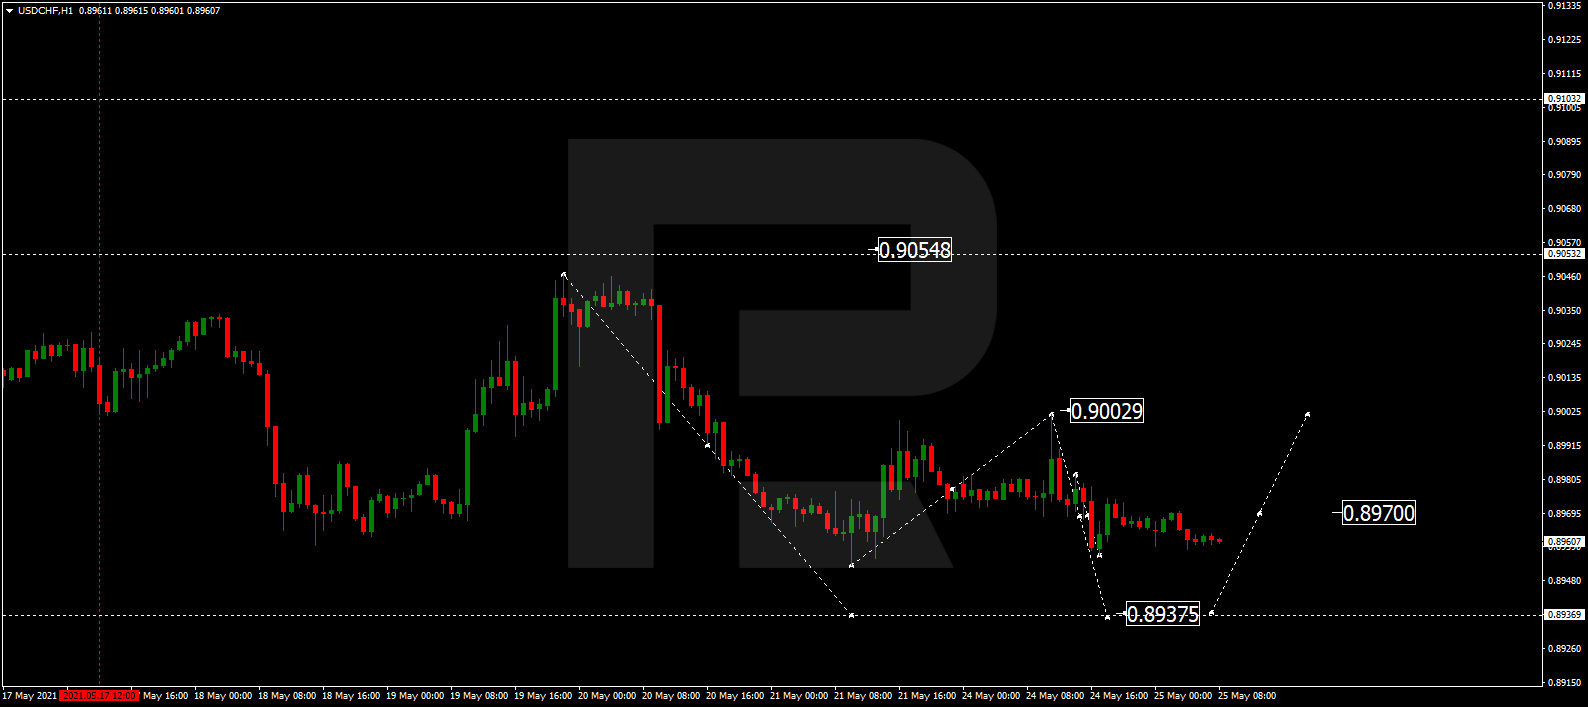
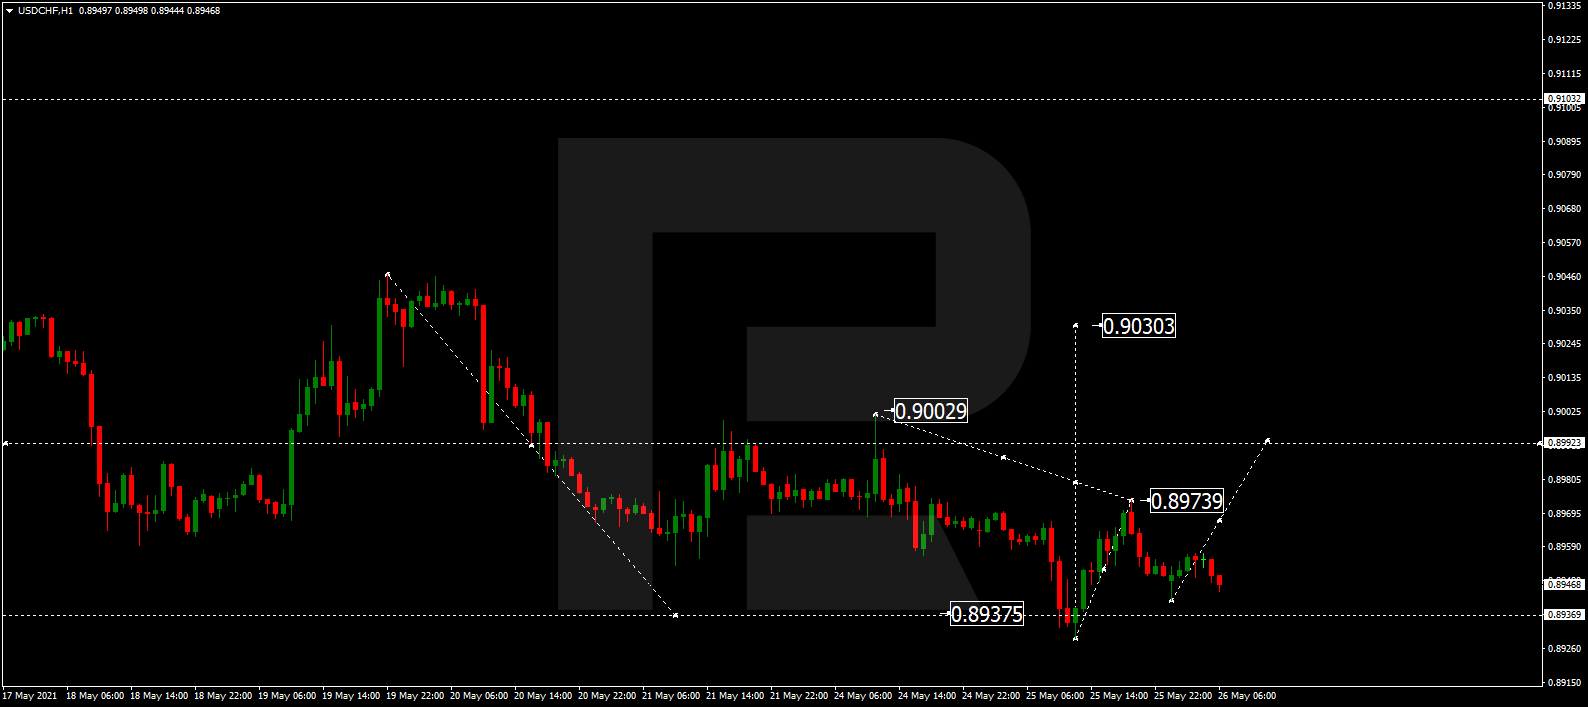
USDCHF, “US Dollar vs Swiss Franc”
After reaching the downside target at 0.8937 and then completing the ascending impulse towards 0.8974, USDCHF has finished the correction at 0.8942, thus forming a new consolidation range around the two latter levels. Possibly, today the pair may break the range to the upside and then resume trading upwards with the target at 0.9030.
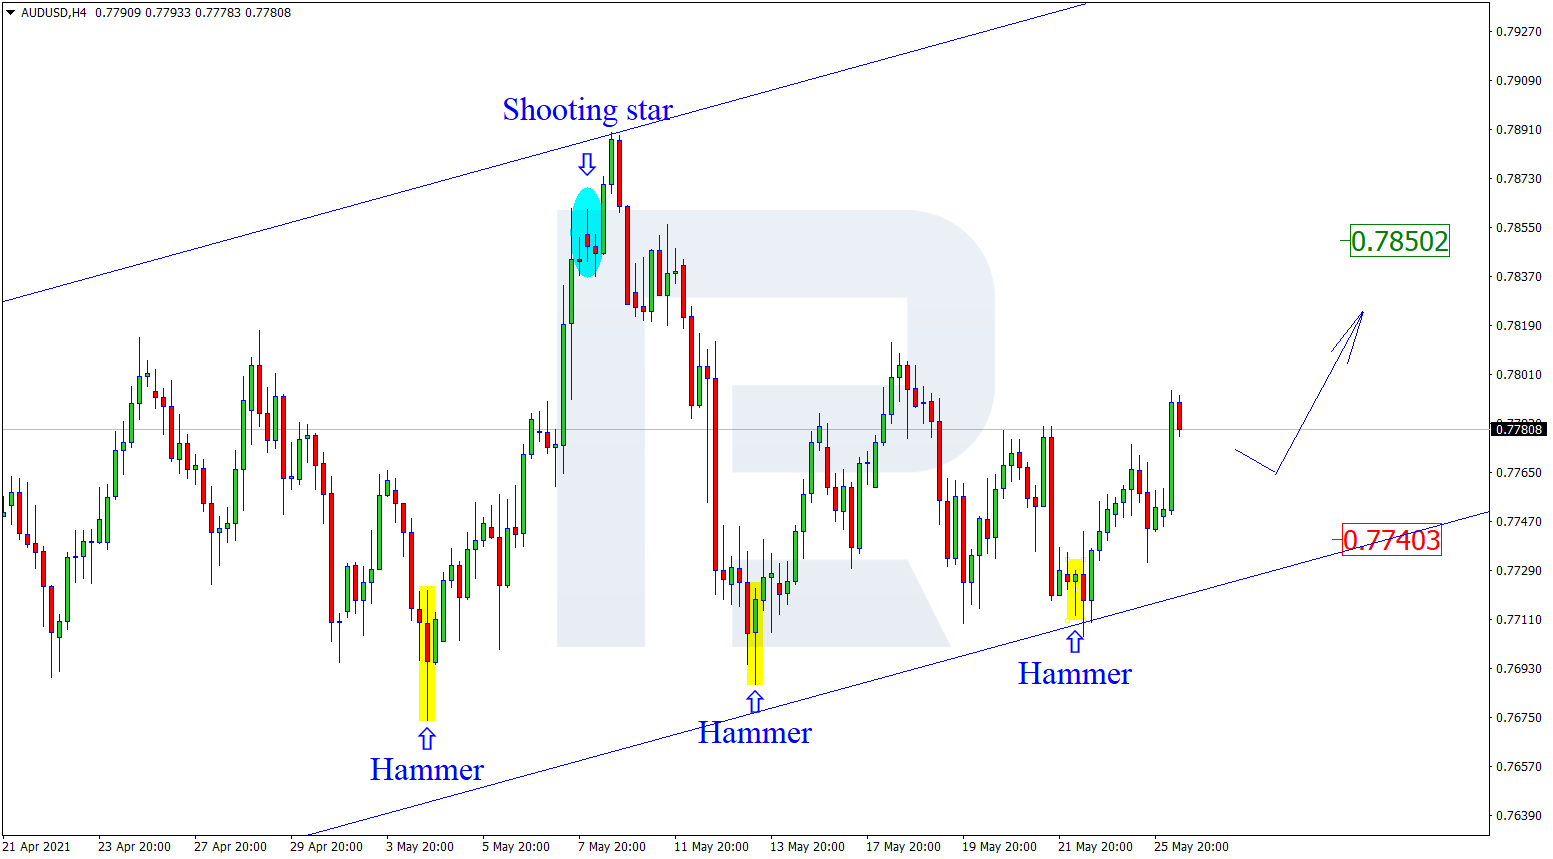
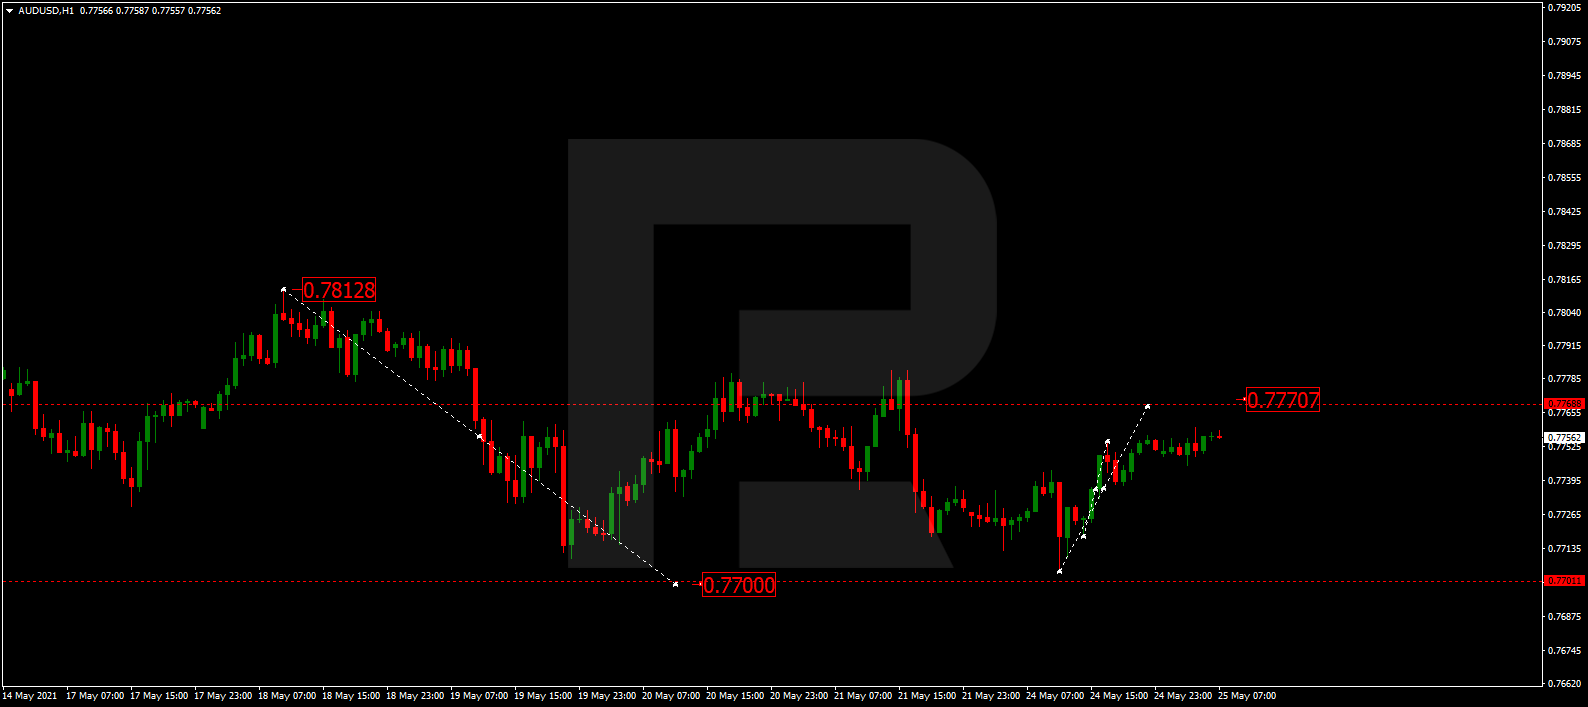
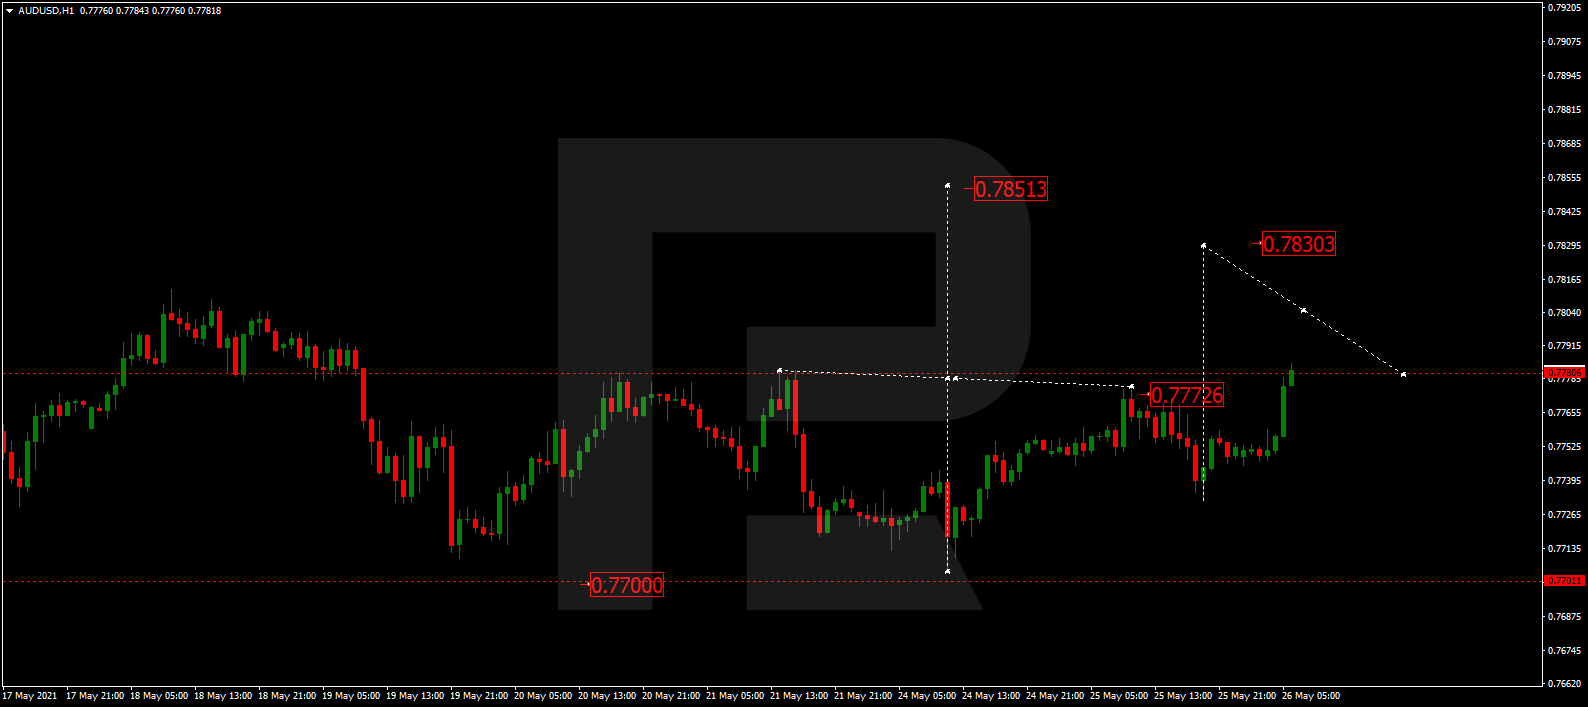
AUDUSD, “Australian Dollar vs US Dollar”
AUDUSD has broken 0.7777 to the upside. Today, the pair may continue growing to reach 0.7830 and then resume trading downwards with the target at 0.7777.
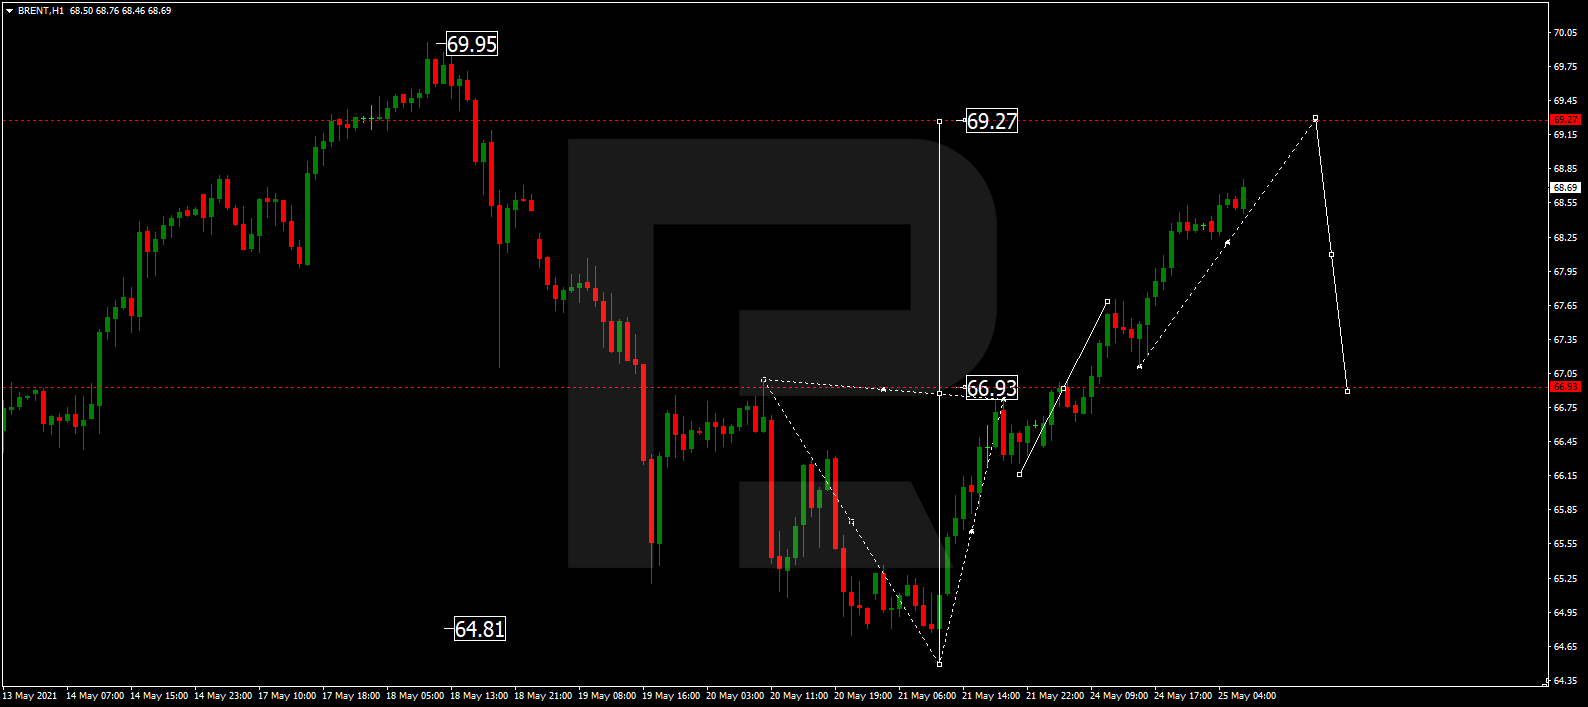
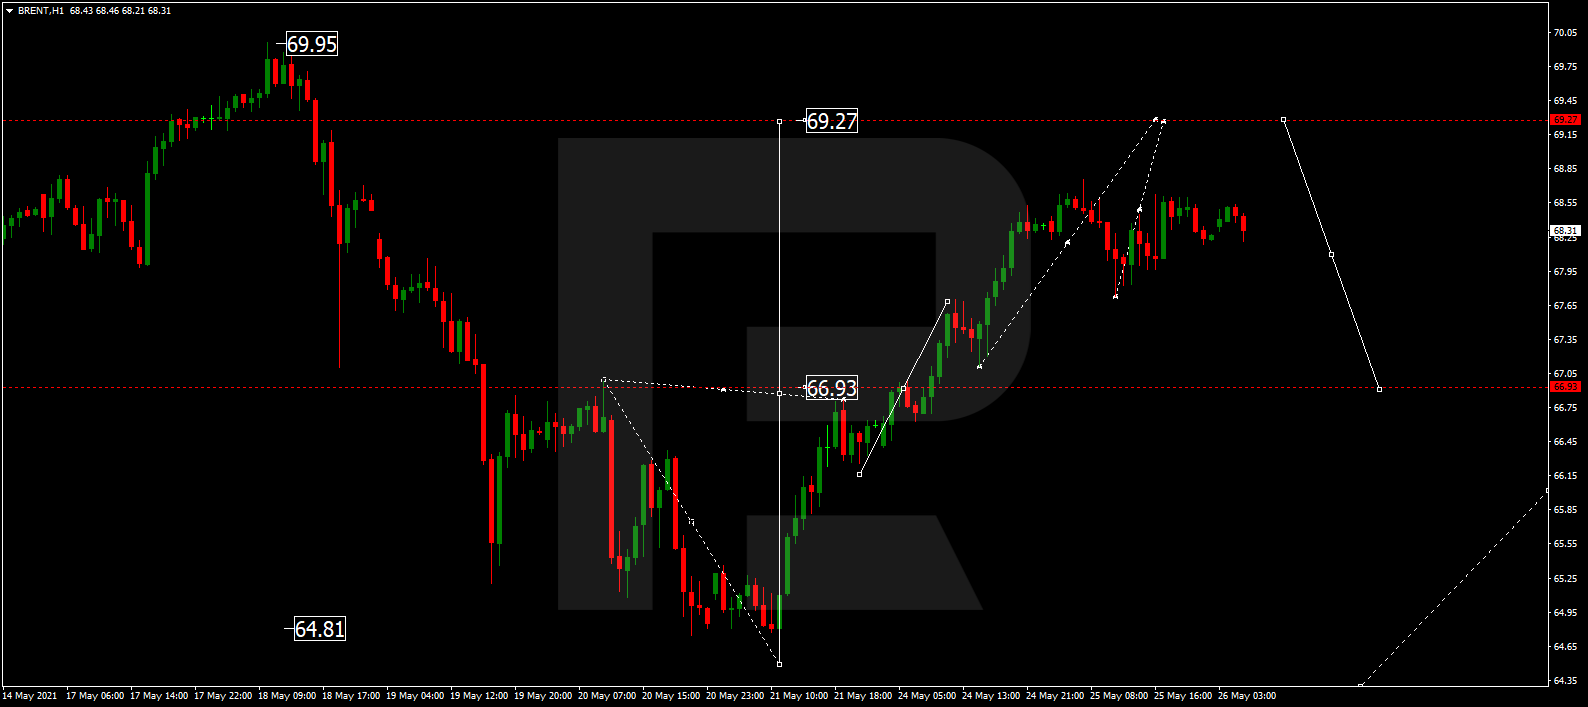
BRENT
Brent is still growing towards 69.27. After that, the instrument may correct to reach 67.00 and then resume trading upwards with the target at 72.00.
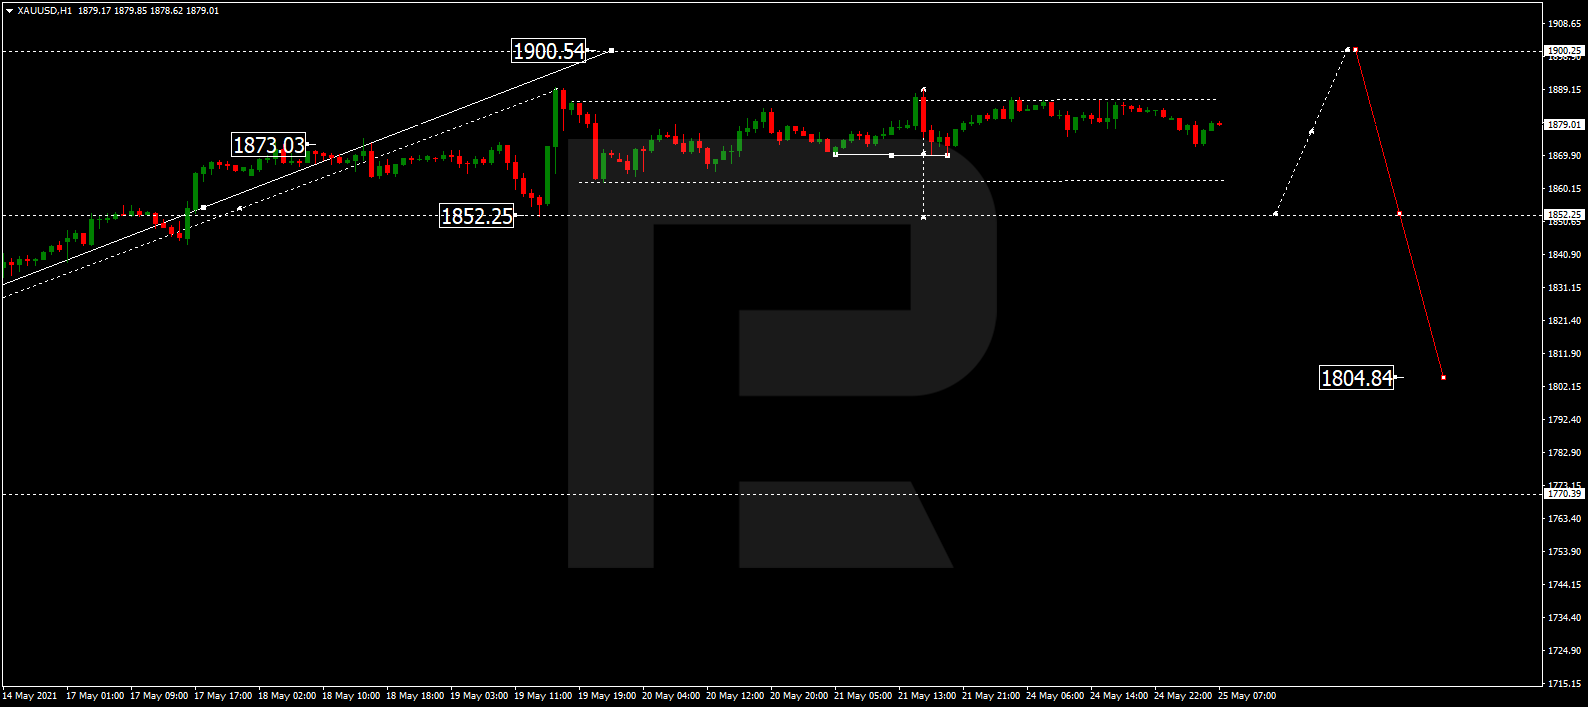
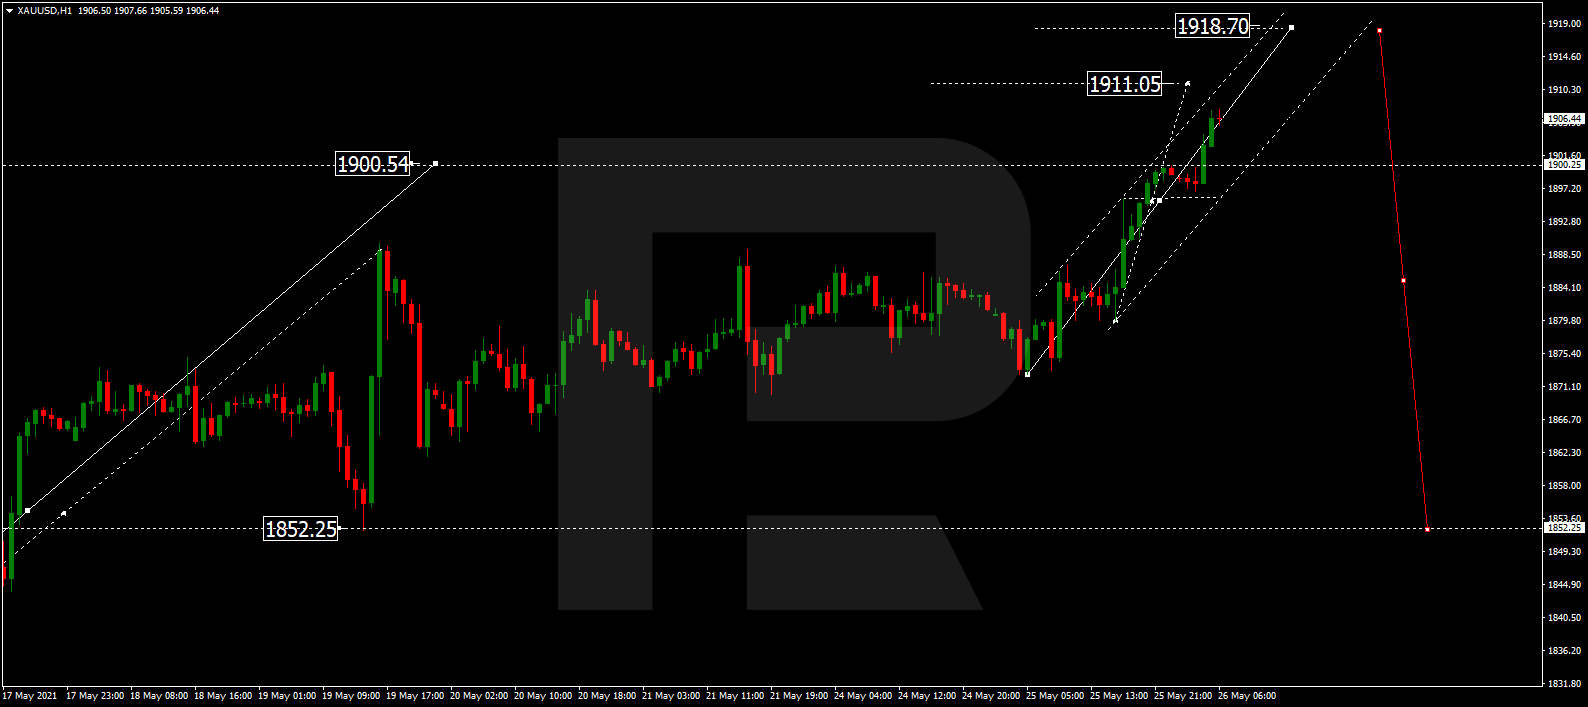
XAUUSD, “Gold vs US Dollar”
After reaching the first upside target at 1900.00, Gold is consolidating at the top. Possibly, the metal may expand the range up to 1911.00 or even 1918.70. However, the main scenario implies a new descending correction with the first target at 1850.00.
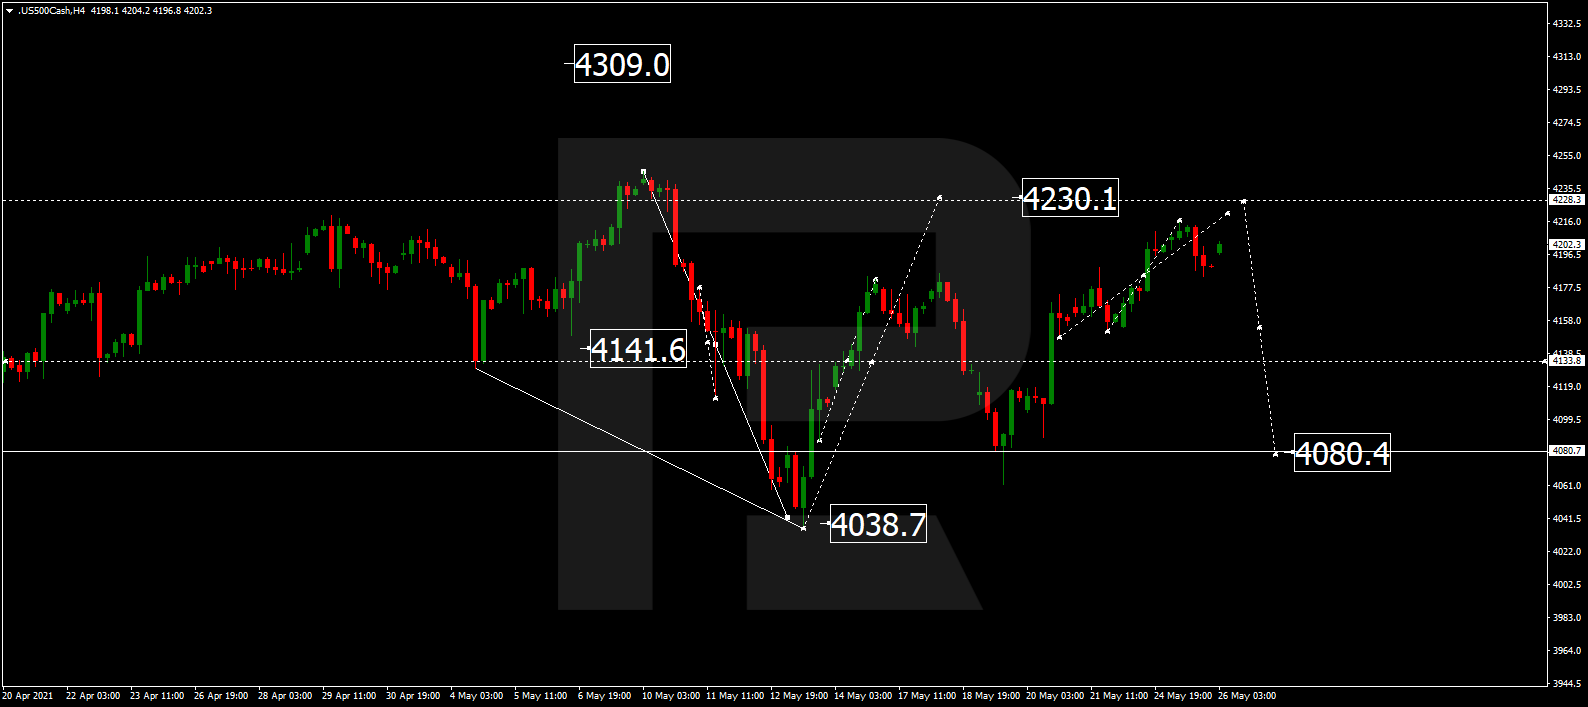
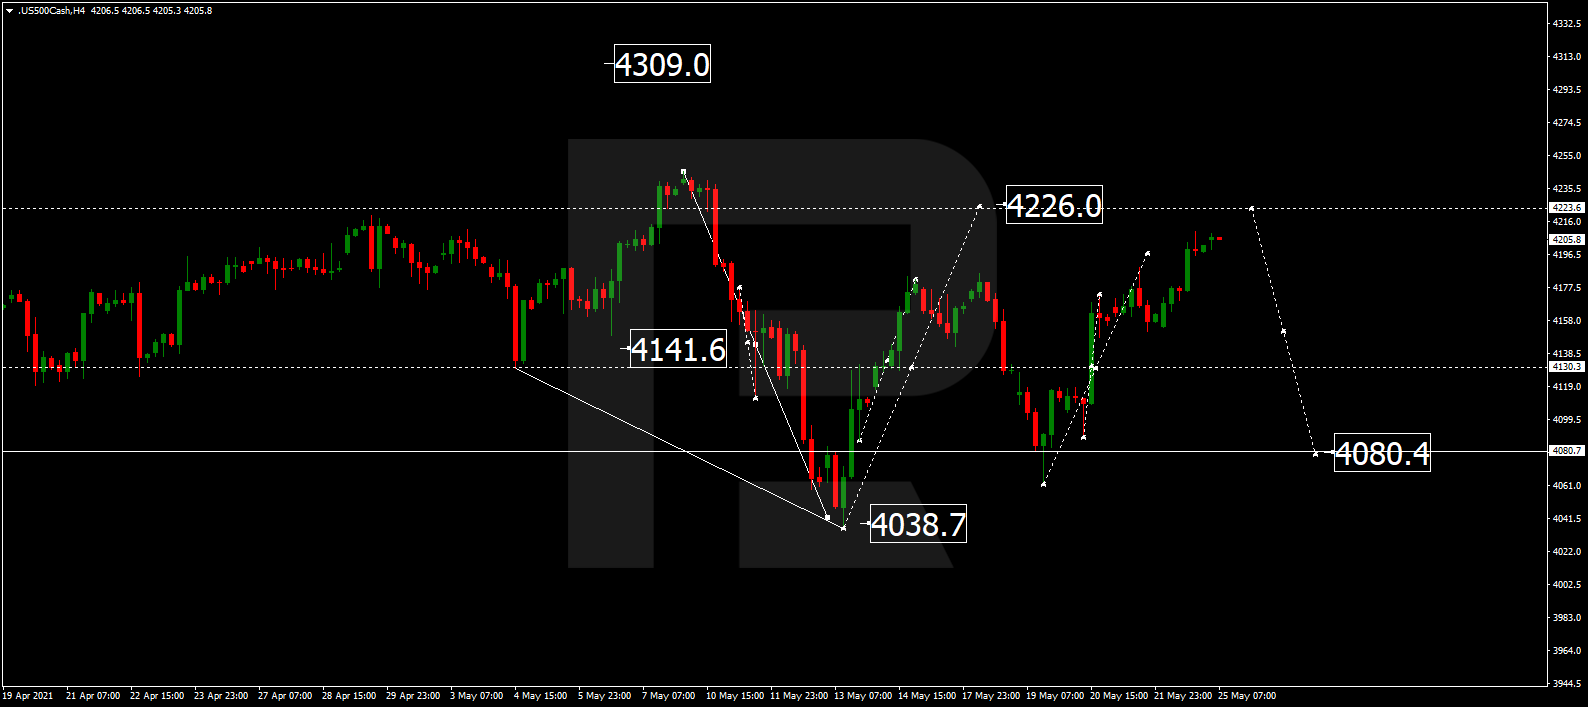
S&P 500
The S&P index is still consolidating around 4141.0. Today, the asset may expand the range up to 4230.1 and then resume trading downwards to reach the downside border of the range at 4080.4. After breaking it, the instrument may continue falling with the target at 3944.4.