10 TRADING STYLES THAT MUST YOU KNOW FOR YOUR DAILY TRADES
1. 50-Pips a Day Forex Strategy
One of the latest Forex trading strategies to be used is the 50-pips a day Forex strategy which leverages the early market move of certain highly liquid currency pairs. The GBPUSD and EURUSD currency pairs are some of the best currencies to trade using this particular strategy. After the 7am GMT candlestick closes, traders place two positions or two opposite pending orders. When one of them gets activated by price movements, the other position is automatically cancelled.
The profit target is set at 50 pips, and the stop-loss order is placed anywhere between 5 and 10 pips above or below the 7am GMT candlestick, after its formation. This is implemented to manage risk. After these conditions are set, it is now up to the market to do the rest. Day trading and scalping are both short-term Forex trading strategies. However, remember that shorter-term implies greater risk due to the nature of more trades taken, so it is essential to ensure effective risk management.
Below is a screenshot of the MetaTrader 4 trading platform provided by Admirals, showing the EURUSD H1 chart from the Zero.MT4 account:
50 pips a day forex trading strategy on the metatrader 4 platform
Source: Admirals MetaTrader 4, EURUSD, H1 chart (between 26 May 2020 to 31 May 2020). Accessed: 29 November 2023 – Please note: Past performance is not a reliable indicator of future results or future performance.
The orange boxes show the 7am bar. In some instances, the next bar did not trade beyond the high or low of the previous bar resulting in no trading setup unless the trader left their orders in the market. The effectiveness of the 50 pips a day Forex strategy has not been tested over time and merely serves as a platform of ideas for you to build upon. Past performance is not a reliable indicator of future results.

10 TRADING STYLES THAT MUST YOU KNOW FOR YOUR DAILY TRADES
2. Daily Chart Forex Strategy
The best Forex traders swear by daily charts over more short-term strategies. Compared to the Forex 1-hour trading strategy, or even those with lower time-frames, there is less market noise involved with a Forex daily chart strategy. Such Forex trade setups could give you over 100 pips a day due to their longer timeframe, which has the potential to result in some of the best Forex trade setups and potentially some of the most successful trading strategies around.
Daily Forex strategy signals can be more reliable than lower timeframes, and the potential for profit could also be greater, although there are no guarantees in trading. Traders also don’t need to be concerned about daily news and random price fluctuations. The Forex daily strategy is based on three main principles:
Locating the trend: Markets trend and consolidate, and this process repeats in cycles. The first principle of the Forex daily strategy is to find the long drawn out moves within the Forex market. One way to identify a Forex trend trading chart is by studying the price data over the last 3 months. Identifying the swing highs and lows will be the next step. By referencing this price data on the current charts, you will be able to identify the market direction.
Staying focused: This requires patience, and you will have to get rid of the urge to get into the market right away. You need to stay out and preserve your capital for a bigger opportunity which is the key to success in a daily time frame Forex strategy.
Using larger stop losses: Be aware of the large intraday swings in the market. Using larger stops, however, doesn’t mean putting large amounts of capital at risk but it does help to deal with the random volatility that can develop during the day, which is why it makes it to the list of trading strategies.
While there are plenty of trading strategy guides available for professional FX traders, the best Forex strategy for consistent profits and creating the most successful trading strategies can only be achieved through extensive practice. Let’s continue the list of trading strategies and look at another one of the best trading strategies.
3. Forex 1-Hour Trading Strategy
You can take advantage of the 60-minute time frame in this Forex strategy. The most suitable currency pairs to trade using this Forex strategy are the EUR/USD, USD/JPY, GBP/USD, and the AUD/USD. In regards to the Forex trading strategies resources used for this type of strategy, the MACD is the most suitable which is available on both MetaTrader 4 and MetaTrader 5.
Buy Trade Rules:
You can enter a long position when the MACD histogram goes above the zero line. The stop loss could be placed at a recent swing low.
Sell Trade Rules:
You can enter a short position when the MACD histogram goes below the zero line. The stop loss could be placed at a recent swing high.
Below is an hourly chart of the AUDUSD. The red lines represent scenarios where the MACD histogram has gone above and below the zero line:
Forex 1-Hour Trading Strategy metatrader 4
Source: Admirals MetaTrader 4, AUDUSD, H1 chart (between 20 May 2020 to 31 May 2020). Accessed: 29 November 2023 – Please note: Past performance is not a reliable indicator of future results or future performance.
The World’s Premier Multi Asset Platform
DOWNLOAD MT5 FREE
The World’s Premier Multi Asset Platform
4. Forex Weekly Trading Strategy
While many Forex traders prefer intraday Forex trading systems due to the market volatility providing more opportunities in narrower time frames, a Forex weekly trading strategy can provide more flexibility and stability. A weekly candlestick provides extensive market information. Weekly Forex trading strategies are based on lower position sizes and avoiding excessive risks.
For this strategy, traders can use the most commonly used price action trading patterns such as engulfing candles, haramis and hammers.
One of the most commonly used patterns in Forex trading is the hammer which looks like the image below:
hammer price action trading strategy
The opposite of the hammer is the shooting star which looks like the image below:
shooting star price action trading strategy
The chart below shows the weekly price action of NZDUSD and examples of the patterns shown above.
Forex Weekly Trading Strategy MetaTrader 4
Source: Admirals MetaTrader 4, NZDUSD, Weekly chart (between 19 August 2018 to 31 May 2020). Accessed: 29 November 2023 – Please note: Past performance is not a reliable indicator of future results or future performance.
5. Price Action Trading Forex Strategies
To what extent fundamentals are used varies from trader to trader. At the same time, the best Forex strategy will invariably use price action. This is also known as technical analysis. When it comes to technical currency trading strategies, there are two main styles: trend following and countertrend trading. Both of these FX trading strategies try to profit by recognising and exploiting price patterns.
When it comes to price patterns, the most important concepts include support and resistance. Put simply, these terms represent the tendency of a market to bounce back from previous lows and highs.
Support is the market’s tendency to rise from a previously established low.
Resistance is the market’s tendency to fall from a previously established high.
This occurs because market participants tend to judge subsequent prices against recent highs and lows.
What happens when the market approaches recent lows? Put simply, buyers will be attracted to what they regard as cheap.
What happens when the market approaches recent highs? Sellers will be attracted to what they view as either too high or buyers will look to lock in a profit.
Therefore, recent highs and lows are the yardsticks by which current prices are evaluated. There is also a self-fulfilling aspect to support and resistance levels. This happens because market participants anticipate certain price action at these points and act accordingly. As a result, their actions can contribute to the market behaving as they had expected.
However, it’s worth noting these three things:
Support and resistance levels do not present ironclad rules, they are simply a common consequence of the natural behaviour of market participants.
Trend-following systems aim to profit from the times when support and resistance levels break down.
Counter-trending styles of trading are the opposite of trend following—they aim to sell when there’s a new high, and buy when there’s a new low.
Did you know that you can see live technical and fundamental analysis in the Admirals Trading Spotlight webinar? In these FREE live trading sessions, taken three times a week, professional traders will show you a wide variety of technical and fundamental analysis trading techniques you can use to identify common chart patterns and trading opportunities in a variety of different markets.
To reserve your spot in these complimentary webinars, simply click on the banner below:
Advanced Trading Webinars
Discover the latest trading trends, get actionable strategies and enjoy complimentary tools.
JOIN ADVANCED WEBINARS
Advanced Trading Webinars
6. Trend-Following Forex Strategies
Sometimes a market breaks out of a range, moving below the support or above the resistance to start a trend. How does this happen? When support breaks down and a market moves to new lows, buyers begin to hold off. This is because buyers are constantly noticing cheaper prices being established and want to wait for a bottom to be reached. At the same time, there will be traders who are selling in panic or simply being forced out of their positions or building short positions because they believe it can go lower.
The trend continues until the selling is depleted and belief starts to return to buyers when it is established that the prices will not decline further. Trend-following strategies encourage traders to buy the market once it has broken through resistance and sell a market once they have fallen through support.
In addition, trends can be dramatic and prolonged, too. Because of the magnitude of moves involved, this type of system has the potential to be the most successful Forex trading strategy. Trend-following systems use indicators to inform traders when a new trend may have begun, but there’s no sure-fire way to know of course.
Here’s the good news: If the indicator can establish a time when there’s an improved chance that a trend has begun, you are tilting the odds in your favour to use the best Forex trading system. The indication that a trend might be forming is called a breakout. A breakout is when the price moves beyond the highest high or the lowest low for a specified number of days.
For example…. A 20-day breakout to the upside is when the price goes above the highest high of the last 20 days. Trend-following systems require a particular mindset, because of the long duration – during which time profits can disappear as the market swings. These trades can be more psychologically demanding. When markets are volatile, trends will tend to be more disguised and price swings will be greater. Therefore, a trend-following system is the best trading strategy for Forex markets that are quiet and trending.
A good example of a simple trend-following strategy is a Donchian Trend system. Donchian channels were invented by futures trader Richard Donchian, and is an indicator of trends being established. The Donchian channel parameters can be tweaked as you see fit, but for this example, we will look at a 20-day breakout.
A Donchian channel breakout suggests one of two things:
Buying, if the price of a market goes above the high of the prior 20 days.
Selling, if the price goes below the low of the prior 20 days.
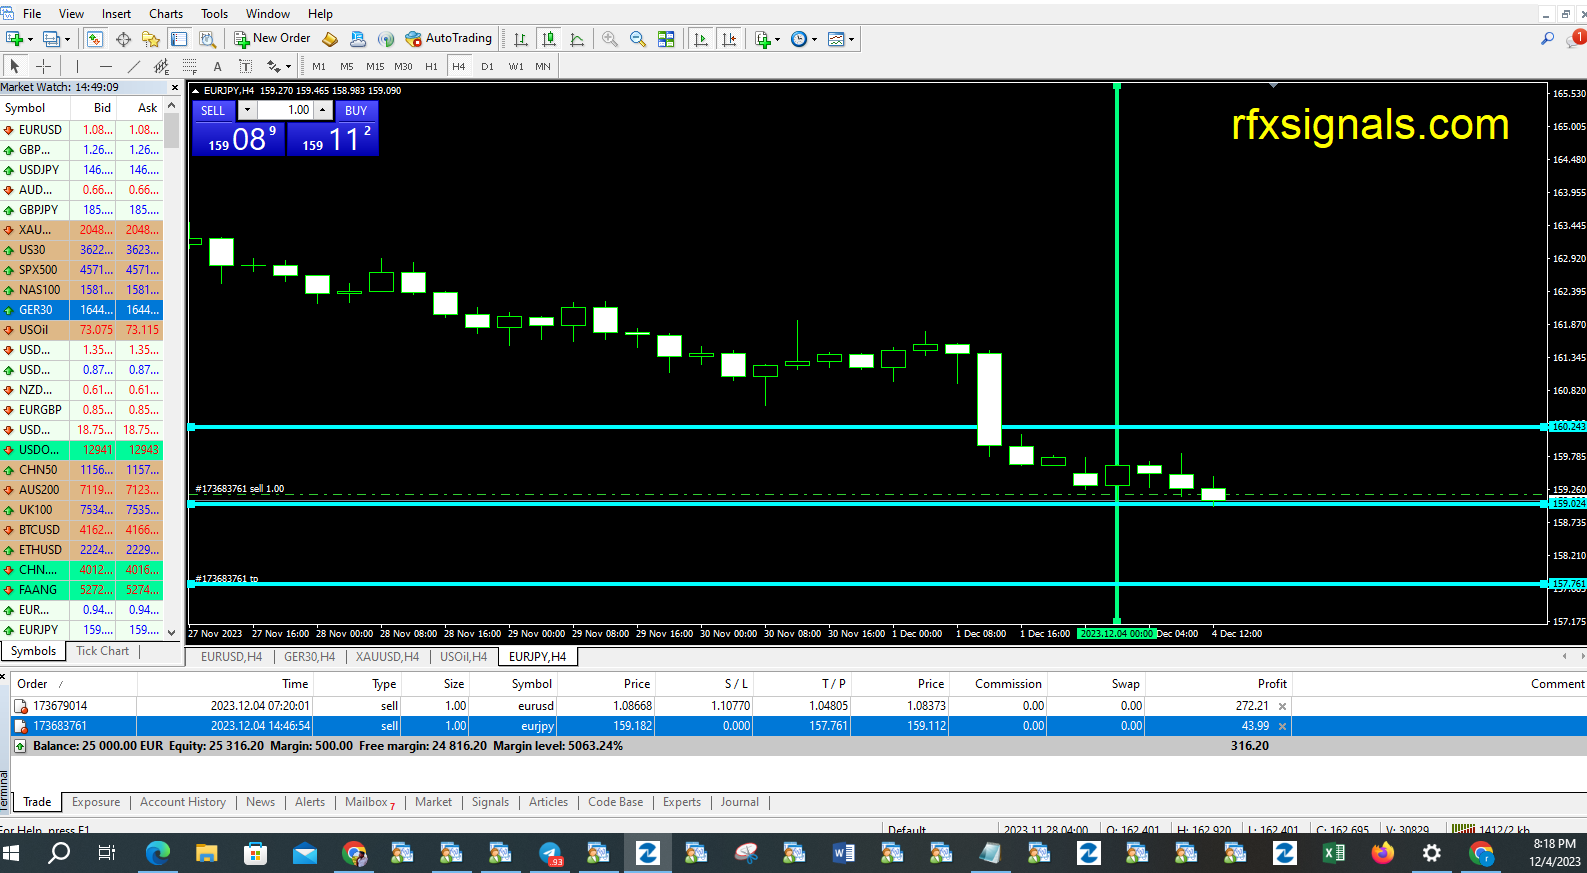
Below is a daily chart of EURJPY showing the Admiral Donchian indicator set to 20 bars.
Trend Following Strategy using the donchian channel indicator
Source: Admirals MetaTrader 4, EURJPY, Daily chart (between 18 September 2018 to 31 May 2020). Accessed: 29 November 2023 – Please note: Past performance is not a reliable indicator of future results or future performance.
You can get the Donchian Channel indicator completely FREE in the Admirals Supreme Edition package. It’s called Admiral Donchian. To upgrade your MetaTrader platform to the Supreme Edition simply click on the banner below:
The exclusive MetaTrader Supreme Edition
Download the most powerful plugin suite for your favourite trading platform!
DOWNLOAD NOW
The exclusive MetaTrader Supreme Edition
There is an additional rule for trading when the market state is more favourable to the Forex trading system. This rule is designed to filter out breakouts that go against the long-term trend. In short, you look at the 25-day moving average (MA) and the 300-day moving average. The direction of the shorter moving average determines the direction that is permitted. This rule states that you can only go:
Short, if the 25-day moving average is lower than the 300-day moving average.
Long, if the 25-day moving average is higher than the 300-day moving average.
Trades are exited in a similar way to entry, but only using a 10-day breakout. This means that if you open a long position and the market goes below the low of the prior 10 days, you might want to sell to exit the trade and vice versa. Now let’s look at another system that could be the best trading strategy for you.
7. 4-Hour Forex Trading Strategy
One potentially beneficial and profitable Forex trading strategy is the 4-hour trend following strategy which can also be used as a swing trading strategy. This strategy uses a 4-hour base chart to screen for potential trading signal locations. The 1-hour chart is used as the signal chart, to determine where the actual positions will be taken.
Always remember that the time frame for the signal chart should be at least an hour lower than the base chart. For this Forex strategy, two sets of moving average lines are chosen for the best results. One will be the 34-period MA, while the other is the 55-period MA. To ascertain whether a trend is worth trading, the MA lines will need to relate to the price action.
In case of an uptrend, the conditions that need to be fulfilled include:
Price action is above the MA lines
The 34-MA line is above the 55-MA line
The MA lines are sloping upwards
In case of a downtrend, the following conditions need to be fulfilled:
Price action is below the MA lines
The 34-MA line is below the 55-MA line
The MA lines are sloping downwards
The MA lines will be a support zone during uptrends, and there will be resistance zones during downtrends. It is inside and around this zone that the best positions for the trend trading strategy can be found.
Below is a daily chart of GBPUSD showing the 34-exponential moving average (purple line) and the 55-exponential moving average (red line) on the chart:
4-Hour Forex Trading Strategy
Source: Admirals MetaTrader 4, GBPUSD, Daily chart (between 4 September 2018 to 31 May 2020). Accessed: 29 November 2023 – Please note: Past performance is not a reliable indicator of future results or future performance.
8. Counter-Trend Forex Strategies
Counter-trend strategies rely on the fact that most breakouts do not develop into long-term trends. Therefore, a trader using such a strategy seeks to gain an edge from the tendency of prices to bounce off previously established highs and lows. On paper, counter-trend strategies can be one of the best Forex trading strategies for building confidence, because they have a high success ratio.
However, it’s important to note that tight reins are needed on the risk management side. These Forex trading strategies rely on support and resistance levels holding. But there is also a risk of large downsides when these levels break down. Constant monitoring of the market is a good idea. The market state that best suits this type of strategy is stable and volatile. This sort of market environment offers healthy price swings that are constrained within a range. It’s important to note that the market can switch states.
For example, a stable and quiet market might begin to trend, while remaining stable, then become volatile as the trend develops. How the state of a market might change is uncertain. You should be looking for evidence of what the current state is, to inform you whether it suits your trading style or not and should be one of the Forex strategies you should be using.
Zero to Hero
Learn to trade in 20 days, from set-up to execution
REGISTER HERE
Zero to Hero
Discovering the Best FX Strategy for You
Discover the Best Forex Strategy For You with an Admiral Market Demo Account
Source: Admirals Demo Account Example
Many types of technical indicators have been developed over the years. The great leaps made forward with online trading technologies have made it much more accessible for individuals to construct their own indicators and systems, as we’ve gone through in these trading strategy guides.
You can read more about technical indicators by checking out our education section or through the trading platforms we offer. The best Forex trading strategies for beginners are the simple, well-established strategies that have worked for a huge list of successful Forex traders already. Of course, many newcomers to Forex trading will ask the question: Can you get rich by trading Forex? or: What is the best Forex strategy that always wins?
It’s important to understand that trading is about winning and losing and that there is always risk involved. In some cases, you could lose more than your initial investment on a trade. There are no easy Forex trading strategies which are going to make you rich overnight, so do not believe any false headlines promising you this. Trading Forex is not a ‘get rich quick’ scheme.
However, through trial and error and the use of a demo trading account, you can learn about the Forex market and yourself to find a suitable style. It can also help you understand the risks of trading before making the transition to a live account.
video-preview