rfxsignals April 3, 2020 No Comments

Trendline Reversal Forex Trading Strategy

Trendlines are probably the most basic technical trading tool and one of the oldest tools used in technical analysis. To this day, trendlines continually form on the charts of financial markets across all the different timeframes providing regular opportunities for traders to jump in and profit on a piece of the action.

Trendline Reversal Forex Trading Stategy

​The trendline reversal trading strategy rests on the premise that most of the price action in the FX market forms trendlines and is contained by trendlines. As we’ll see in the examples later, as one trendline breaks another one forms and so on. It’s a continuous process actually.

Advantages of the Trendline Reversal Strategy are:

  • Provides a valid trading opportunity, either short or long, out of almost all setups. Most of the time, it’s only a question of which trendline is broken and which one stays in place (we will call it the healthy trendline).
  • Provides opportunities where most of the time the risk-reward ratio offered is great, usually 1:2 or more. This is because we place our stop just behind the healthy trendline and we ride with the move until a support or resistance zone is hit at a later time.

The essential idea of this strategy is: Just follow the trendlines!

The trader should constantly monitor both the support and resistance trendlines and redraw them as the old ones break and new ones form. When an intersection of the projections happens, one of the trendlines must be broken and the other will most likely continue to hold the price. We trade in the direction of the trendline that remained unbroken.

​Entry rules of the Trendline Reversal Forex Strategy:

  1. There need to be two intersecting trendlines on the chart. So, the trendlines should be going in the opposite direction.
  2. Wait for one of the trendlines to break
  3. Enter in the direction of the breakout:
    – Enter immediately on the breakout or
    – Wait for a retest – confirmation of the broken trendline before entering.
  4. We must be careful that we have clear targets:
    – In other words, we need to make sure there are no obstacles close to our entry level.
    – Obstacles would be support or resistance levels acting contrary to the direction of our trade.

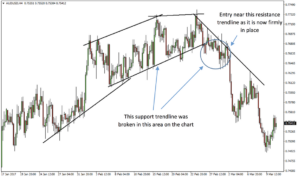
​The following chart is a perfect example that highlights the philosophy of this trading strategy. Basically, we are constantly monitoring and drawing trendlines, and judging by the changes in the slope of every new trendline we can determine how likely a reversal is at any particular point in time.

In this case on the AUDUSD 4h chart, it was pretty clear that a reversal was imminent and we could have timed the entry to catch a nice profit of the move.

AUDUSD was making higher highs on this chart, however, upon closer inspection, we can see that the slope of the upward, support trendlines underneath was decreasing until it finally turned flat horizontal before the bearish breakout.

More importantly, a very steep resistance trendline formed from the top that finally caused the breakout and is used as the stop loss point for this trade.

Forex Trendline Reversal Strategy

Trendline Reversal Forex Trading Strategy

AUDUSD 4h chart – A nice U-turn formed by price action and emphasized with the trendlines

​Initial stop loss placement of the Trendline Reversal Forex Strategy:

After one of the trendlines is broken, and we enter the trade in the direction of the healthy trendline the protective stop loss is placed behind the healthy trendline.

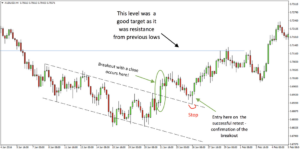
The next chart is another example of how this strategy works.

After the downward trendline was broken the price didn’t continue up immediately but first retested the broken trendline from the other side. In this case price action didn’t just confirm the breakout of the old trendline but it also confirmed the formation of the new upward trendline – based on which a trade is taken according to this strategy.

Forex Trendline Reversal System

Trendline Reversal Forex Trading Strategy

USDJPY 4h chart – A great example of intersecting trendlines providing a great place to enter the market

​Stop loss management – trailing the stop

​It’s only logical that after we enter a trade based on a trendline we should trail the stop behind that trendline. Basically, as long as the trendline holds we want to be in the trade and as soon as it’s broken we want to be out of the trade at once.
Trendline Reversal Forex Trading Strategy

Trendline Reversal Forex Trading Strategy

USDCAD 4h chart – As soon as the trendline is broken we exit the position

Take Profit of the Trendline Reversal Forex Strategy:

Unlike the entry, we don’t have to wait for a break of the trendline to exit the trade. In fact, in order to capture maximum profits, you need to exit at some technical level before the price takes a turn and reverses.

For this purpose, it’s best to lock in profits at a prominent technical support or resistance level, or a Fibonacci confluence zone taken from the higher timeframes.

rfxsignals April 3, 2020 No Comments

15 Minute Stochastic Forex Scalping Trading Strategy

The Stochastic Forex Scalping Trading Strategy will allow Forex traders to make incremental profits over short time frames. Over time, these small profits can add up to substantial amounts and can prove to be very lucrative for forex traders.

For this particular trading strategy, the timeframe that should be used is the 15-minute chart. It can also work well as a scalping strategy on the 1-minute and 5-minute timeframes. You may use any currency pair that you like for this strategy.

Chart Setup

It is important that you set up your charts right in order to get the best results from this trading strategy. You may choose any trading session that you desire to use, and it is recommended that you work with the 1-minute, 5-minute, and 15-minute charts.

We will be using MetaTrader4 Indicators for this setup. Here are the indicators to use:

  • The Stochastic with the following parameters: slowing 16.0, %K 26.0, %D 18.0
  • The 120 EMA (purple on the charts) and the 50 SMA (orange on the charts)

Below is what a buy trade strategy would look like:

Stochastic Forex Scalping Buy Signal

15 Minute Stochastic Forex Scalping Trading Strategy

The first circle indicates the entry (buy) signal, while the second circle is the exit signal
Now it’s time to reveal the actual trading strategy:

The Buy Trading Strategy

Use the above chart to follow along. Proceed to buy only when both of the following conditions exist:

  • A clear buy signal is if the fast blue line of the Stochastic Indicator crosses the slow red line to the upside from inside the oversold region (below 20 level on the Stochastic). It should break and remain above the oversold region (above 20). Once this condition has been satisfied, you should proceed to buy.
  • Another buy signal is the existence of bullish pressure. This may be evidenced by the 50 SMA (orange line) crossing the blue line of the 120 EMA (purple line) to the upside.
You should place your stop loss about 2 pips below the support level.

When to Sell

The following scenarios are indicators that you should sell:

  • If the blue line of the Stochastic crosses the red line to the downside and from inside the area above the 80.00 level. It should break and remain below the 80.00 level on the Stochastic.
  • Another sell indicator is if the 50 SMA (orange line), goes across the blue line of the 120 EMA (purple line) to the downside. This indicates that there is selling pressure in the market.
Stochastic Forex Scalping Sell Signal

15 Minute Stochastic Forex Scalping Trading Strategy

Two short trade examples are shown here. Circles 1 and 3 are the entry (sell) signals and circles 2 and 4 are the exit signals
For a short trade, you should place your stop loss 2 pips above the resistance.

The Strategy for Exiting a Trade

If any of the following scenarios take place, you should exit the trade or take profit.

  • When the blue line of the Stochastic crosses the red line from inside of the overbought region (exit signal for short trades) or the oversold region (exit signal for long trades).
  • Another signal to exit the trade is if the 50 SMA indicator (orange line) crosses over the purple line of the 120 EMA from the bottom up during a bearish trend or from the top down during a bullish trend. This is an indication that the existing trend is losing strength. You should take profits and exit the trade at this point.
rfxsignals April 3, 2020 No Comments

5 Minute Scalping Forex Trading Strategy

5 Minute Scalping Forex Trading Strategy

The following is a 5-minute scalping forex trading strategy for the EURUSD, GBPUSD, USDJPY and EURJPY currency pairs. Scalping is a special type of trading strategy that helps the trader to make significant profits on minor price changes.

In this strategy, the trader needs to make a minimum of 10 trades within a single day in order to capitalize on any minor price changes. A strict exit strategy must be implemented in order to minimize any potential losses. In this particular strategy, the holding time is 5 minutes. This method requires precise execution and nimble trading.

Indicators to Be Used

In this trading strategy, the indicators that will be used are the 10 and 21 EMA, and the 50 SMA.

You should then open an ADX indicator in a different window set at 13.

At least 3 criteria must be satisfied for this trade.

5 minute scalping trading strategy

5 Minute Scalping Forex Trading Strategy

EURUSD 5-minute timeframe – Two bullish signals are shown with the circles on the chart. Circles 1 show the first buy signal and circles 2 show the second buy signal. The small support trendline is shown as the dotted black line. The price action accurately reverses in the war zone and continues higher.

Trade Criteria to Be Satisfied for This Trading Strategy

  1. The first criterion is that the 50 SMA angle must be more than 20 degrees. The measurement does not need to be absolutely accurate, a subjective estimate is sufficient.
  2. The second criterion is that the price should pull back through the 10EMA to the 21EMA. The area between the 10EMA and the 21EMA is the fire or war zone.
  3. The third and final criterion for this trade is that the price must stay on the proper side of the small resistance or support line. You should draw a trend line from the last high or low prior to the cross of the 50SMA to the next high or low. This will form a small resistance or support line.

Trade Set up Rules

  1. The price and candles must all stay on the correct side of the small trend line. Otherwise, the possible trades will be canceled.
  2. Pullbacks of candles towards war zone must be smooth and flat.
  3. After identifying the first candle to enter the war zone, wait for the second candle to pullback from 21MA towards 10MA and then enter the trade on the pullback.
Picture

5 Minute Scalping Forex Trading Strategy

EURUSD 5-minute timeframe – Two bearish signals are shown with the circles on the chart. Circles 1 show the first sell signal and circles 2 show the second sell signal. The small resistance trendline is shown as the dotted black line. The price action accurately reverses in the war zone and continues to the downside.

The Trade

Enter the trade in the war zone by making a market order and putting your stop loss 6 or more pips away. Do not use a trailing stop loss. Profit limit must be between 10 and 15 pips. Only trade where there is a good set up. Enter on small candles and look out for flat pullbacks.
rfxsignals April 3, 2020 No Comments

Forex Breakout Confirmation Strategy

This forex strategy tries to exploit the times when the market is not trending. In essence, it rests on the statistics which show that the Forex market is trading in a range for about 70% of the time and it’s trending only about 30% of the time.

​Since price fluctuations are very unpredictable and irregular while inside of a ranging formation, it’s better and wiser to trade on a breakout of that ranging formation instead of trading it.

Forex Breakout Trading System

The breakout confirmation strategy aims to profit on such situations when the price moves out of the range and as a result, usually follows a more predictable path.
Still, we can not go blindly and trade any breakout that we find on the charts. In fact, the truth is that most of the breakouts in the Forex market are fake and you will actually lose money if you are not very experienced in trading breakouts.

That’s why a specific set of conditions must be met in order to increase the chances of making a profitable trade.

Conditions of the Forex Breakout Confirmation Strategy:

  1. ​Obviously, there must exist a range for the price to breakout out of.Now, for the purpose of this strategy, a range is not only the horizontal case but also a channel sloped upwards or downwards, as in a trend. In fact, a channel in a horizontal position is the classical form of a trading range.
  2. Next, before we consider entering a trade we need to have the price breakout out of the range or the channel.
  3. Finally, to initiate a trade we need to have a confirmation of the breakout. This confirmation massively increases the probabilities that the breakout is true and hence the trade will be profitable. Without a confirmation, there is no trading signal as per this strategy.

Note: The mechanics of this strategy can be also successfully used in determining true breakouts in single trendlines (without a range or a channel). However, a break of a simple trendline has proven to be less significant than the breakout of a channel or a range. Therefore, trendlines are not included as a condition in this strategy.

Entry rules:

  1. Find a well-established channel or range on the chart.A channel is defined as a period of time when price action is trading within two parallel trendlines on the chart and is prominently touching those two trendlines during this period. 

    For this strategy, a minimum of three touches is required on each trendline, as in the example below on the AUDUSD 4h chart. However, experience tells as that the more times the trendlines are touched the more significant the channel becomes. This in turn later makes the breakout much more significant as well.

  2. Wait for price to clearly break the range with a close outside of the range.

    Note here, that for a range you can trade the breakout in both directions either short or long depending on which way it breaks out. However, it’s different with channels because they often represent trends. So, the rules here are:you can trade an upward channel breakout only to the downside, and
    a downward channel breakout is only valid to the upside.

    When the opposite happens it can actually be a trap (often referred to as a bubble) and price quickly reverses.

  3. Wait for a pullback in price to retest the broken border (trendline) of the range.
  4. Enter after a successful retest of the trend line and a rejection of a move back inside the channel.Successful retest simply means prices have reversed from the trendline in the direction of the breakout. Usually, this occurs with some reversal candlestick pattern, like candles with long wicks (Pin Bar). This situation is shown in the example below at the entry point.
Forex Breakout Trading System

Forex Breakout Confirmation Strategy

AUDUSD 4h chart upward channel breakout and reversal – The breakout is confirmed and price action follows through to the downside!

​Initial Stop Loss Placement:

One of the best parts about this strategy is that it usually provides very tight stops and big profit potentials.

The stop loss should be placed right behind the retest of the broken trendline. That is:

  • above the retested highs in a downside breakout (look at AUDUSD chart example above); and
  • below the retested lows in an upside range breakout (look at USDJPY chart example below)
Forex Breakout Trading Rules

Forex Breakout Confirmation Strategy

USDJPY 4h chart – Horizontal range upside breakout (the blue circles mark the defining points of the range – each time the trendline is touched)

Targets and Take Profit Rules:

For a horizontal range


  • Measure the height of the range and project it from the point of breakout.4 possible targets can be calculated in this manner:

    1st target – 0.5x the height of the range

    2nd  target (most probable outcome) – 1x the height of the range

    3rd target – 1.5x the height of the range

    4th target – 2x the height of the range

    It’s best to take profit on part of the position at each of these targets or use a trailing stop after the first 2 targets are reached.

For a sloping channel


  • Measuring and projecting the height of the channel is not as reliable as with the horizontal range. That’s why it’s better to target major support or resistance levels instead.Zoom out on a timeframe that is 1 degree greater than the setup chart.

    Look for past support or resistance levels beyond the breakout and use those as targets.

    If no prominent support or resistance levels are present, use Fibonacci retracements and extensions to determine important price levels.

    Note: If the appropriate target level (support or resistance) is too close to the entry point then trades should not be taken.

Forex Breakout Confirmation Strategy

Downward channel on AUDUSD 4h chart – The retest of the broken trendline can happen much later after the initial breakout. It’s still a valid signal.

Conclusion

This forex breakout trading strategy is little more advanced and requires experience of drawing the channels, recognizing ranges and Price Action patterns. However, once you master it, you will become the real professional Price Action trader.
rfxsignals April 3, 2020 No Comments

Scalping is a popular trading technique in forex trading. It involves the trading of currencies in real time which means that positions are held for very short periods of time.

Here, I will present a 1-minute scalping trading technique that you can use for your Forex trading. You may use any currency pair that involves majors for this strategy.

The indicators that will be used in this trading strategy are Bollinger bands (18 period) and the RSI indicator. We will also use the MACD indicator and the 3EMA indicator.

Entry

You should be using a 1-minute chart with this strategy. You may enter the trade in either of 2 ways – with a long entry or with a short entry.

With the long entry, you must wait for the 3EMA to cross above the 18 Bollinger bands middle line. In addition, the RSI needs to be above 50 and the MACD histogram needs to be above 0.

1 minute forex scalping buy signal

1 Minute Forex Scalping Trading Strategy

Buy signals are marked by black circles – EURUSD 1-minute chart
Conversely, to make a short entry, you need to wait for the 3EMA to cross below the 18 Bollinger bands middle line. Similar to the long entry, you must wait until the RSI is below 50 and the MACD histogram is below 0.
1 minute forex scalping sell signal

1 Minute Forex Scalping Trading Strategy

Sell signals are marked by black circles – GBPUSD 1-minute chart

Where to Place Your Stop Loss

You should place your stop loss about 4 pips on either side of the Bollinger bands middle line.

This is a simple but very effective trading technique. Note that scalping usually requires a sizeable investment in order to be worthwhile. Therefore, you must be able to commit to this in order to get the best results with scalping.

When to exit the trade

You should exit the trade when 1 or more of the 3 conditions for entry are not satisfied.

So, you should exit a long trade when the RSI drops below 50, the MACD histogram is below 0 or the 3EMA crosses below the 18 Bollinger bands middle line.

You should exit a short trade when the RSI is above 50, the MACD histogram is above 0 or the 3EMA crosses above the 18 Bollinger bands middle line.