Fibonacci Retracements Analysis 02.09.2019 (GOLD, USDCHF)

02.09.2019

XAUUSD, “Gold vs US Dollar”

As we can see in the H4 chart, after completing the rising impulse, XAUUSD has started the correction to the downside, but the uptrend yet continues. After breaking the current high, the pair may continue trading upwards to reach 61.8% fibo at 1616.00. At the same time, there is a divergence within the uptrend on MACD, which may indicate a possible mid-term descending correction with the targets at 23.6%, 38.2%, and 50.0% fibo at 1487.00, 1444.60, and 1410.80 respectively.

GOLD_H4
Risk Warning: the result of previous trading operations do not guarantee the same results in the future

As we can see in the H1 chart, the correctional downtrend has reached 61.8% fibo. The next downside target may be 76.0% fibo at 1508.20. However, there is a local convergence, which may indicate a new growth towards the high at 1554.99

GOLD_H1
Risk Warning: the result of previous trading operations do not guarantee the same results in the future

USDCHF, “US Dollar vs Swiss Franc”

It would be better to analyze USDCHF on the daily chart. As we can see, the convergence made the pair reverse and start a new uptrend, which has already reached 38.2% fibo and may yet continue towards 50.0% and 61.8% fibo at 0.9984 and 1.0016 respectively. The support is the low at 0.9660.

USDCHF_D1
Risk Warning: the result of previous trading operations do not guarantee the same results in the future

The H4 chart shows more detailed structure of the current rising correction. USDCHF is correcting to reach 50.0% fibo at 0.9948. At the same time, there is a divergence, which may indicate a possible pullback.

USDCHF_H4
Risk Warning: the result of previous trading operations do not guarantee the same results in the future

Back to listAttention!

Forecasts presented in this section only reflect the author’s private opinion and should not be considered as guidance for trading. RoboForex bears no responsibility for trading results based on trading recommendations described in these analytical reviews.

Fibonacci Retracements Analysis 03.09.2019 (EURUSD, USDJPY)

03.09.2019

EURUSD, “Euro vs US Dollar”

As we can see in the H4 chart, after finishing the short-term pullback, EURUSD is forming a new descending impulse. It seems as if the previous low at 1.1027 couldn’t provide enough resistance to bears and now acts as the resistance for bulls. After breaking the previous low, the instrument continue falling towards the post-correctional extension area between 138.2% and 161.8% fibo at 1.0942 and 1.0889 respectively.

EURUSD_H4
Risk Warning: the result of previous trading operations do not guarantee the same results in the future

In the H1 chart, there is a convergence within the downtrend on MACD, which may indicate a possible pullback. The upside correctional targets may be 23.6%, 38.2%, and 50.0% fibo at 1.0955, 1.0994, and 1.1027 respectively.

EURUSD_H1
Risk Warning: the result of previous trading operations do not guarantee the same results in the future

USDJPY, “US Dollar vs. Japanese Yen”

As we can see in the H4 chart, USDJPY is testing 23.6% fibo. In the future, the correctional uptrend may continue towards 38.2%, 50.0%, and 61.8% fibo at 107.48, 108.42, and 109.37 respectively. The support is at 104.45.

USDJPY_H4
Risk Warning: the result of previous trading operations do not guarantee the same results in the future

In the H1 chart, USDJPY is correcting downwards and has already reached 23.6% fibo. In the future, the correction may continue towards 38.2% and 50.0% fibo at 105.83 and 105.56 respectively. If the price breaks the high at 106.68, the instrument may resume trading upwards.

USDJPY_H1
Risk Warning: the result of previous trading operations do not guarantee the same results in the future

Back to listAttention!

Forecasts presented in this section only reflect the author’s private opinion and should not be considered as guidance for trading. RoboForex bears no responsibility for trading results based on trading recommendations described in these analytical reviews

Fibonacci Retracements Analysis 04.09.2019 (GBPUSD, EURJPY)

04.09.2019

GBPUSD, “Great Britain Pound vs US Dollar”

As we can see in the H4 chart, after finishing the correction at 50.0% fibo and breaking the low, GBPUSD is still trading downwards. The next downside targets are inside the post-correctional extension area between 138.2% and 161.8% fibo at 1.2019 and 1.1788 respectively. The resistance is at 1.2286. At the same time, there is a convergence on MACD, which indicates slowdown of the descending tendency.

GBPUSD_H4
Risk Warning: the result of previous trading operations do not guarantee the same results in the future

In the H1 chart, the pair is correcting to the upside and has already reached 38.2% fibo. The next target may be 50.0% fibo at 1.2133. The support is close to the low at 1.1958.

GBPUSD_H1
Risk Warning: the result of previous trading operations do not guarantee the same results in the future

EURJPY, “Euro vs. Japanese Yen”

As we can see in the daily chart, after breaking the significant low, EURUSD is still moving downwards. The targets are inside the post-correctional extension area between 138.2% and 161.8% fibo at 114.33 and 112.06 respectively. The resistance is at 117.96..

EURJPY_D1
Risk Warning: the result of previous trading operations do not guarantee the same results in the future

In the H4 chart, there is a convergence, which may indicate a possible pullback soon. The targets of this correction may be 23.6%, 38.2%, and 50.0% fibo at 117.18, 117.96, and 118.62 respectively. The support is near the low at 115.86.

EURJPY_H4
Risk Warning: the result of previous trading operations do not guarantee the same results in the future

Back to listAttention!

Forecasts presented in this section only reflect the author’s private opinion and should not be considered as guidance for trading. RoboForex bears no responsibility for trading results based on trading recommendations described in these analytical reviews.

Fibonacci Retracements Analysis 05.09.2019 (AUDUSD, USDCAD

05.09.2019

AUDUSD, “Australian Dollar vs US Dollar”

As we can see in the H4 chart, AUDUSD is moving upwards, but the mid-term correction continues. The pair is heading towards 38.2% fibo at 0.6831 and may later reach 50.0% and 61.8% fibo at 0.6880 and 0.6928 respectively. After breaking the local support at 0.6677, the instrument may continue falling to reach the long-term low at 0.6547.

AUDUSD_H4
Risk Warning: the result of previous trading operations do not guarantee the same results in the future

In the H1 chart, AUDUSD is steadily trading upwards, but there is a divergence on MACD, which may indicate a new pullback after the price reaches 38.2% at 0.6831. The targets of this pullback may be 23.6%, 38.2%, and 50.0% fibo at 0.6797, 0.6776, and 0.6759 respectively.

AUDUSD_H1
Risk Warning: the result of previous trading operations do not guarantee the same results in the future

USDCAD, “US Dollar vs Canadian Dollar”

As we can see in the H4 chart, after breaking the previous high and testing 61.8% fibo, USDCAD couldn’t reach 76.0% fibo at 1.3433. There was a divergence on MACD, which made the pair start a new decline. By now, this decline has already reached 38.2% fibo and may yet continue towards 50.0%, 61.8%, and 76.0% fibo at 1.3198, 1.3156, and 1.3104 respectively. The local resistance is at 1.3295.

USDCAD_H4
Risk Warning: the result of previous trading operations do not guarantee the same results in the future

The H1 chart shows more detailed structure of the current decline. USDCAD is getting closer to 50.0% fibo at 1.3198.

USDCAD_H1
Risk Warning: the result of previous trading operations do not guarantee the same results in the future

Back to listAttention!

Forecasts presented in this section only reflect the author’s private opinion and should not be considered as guidance for trading. RoboForex bears no responsibility for trading results based on trading recommendations described in these analytical reviews.

AUDUSD consolidates after breaking below 50% midpoint now

The 61.8% retracement is rest point now and next downside target

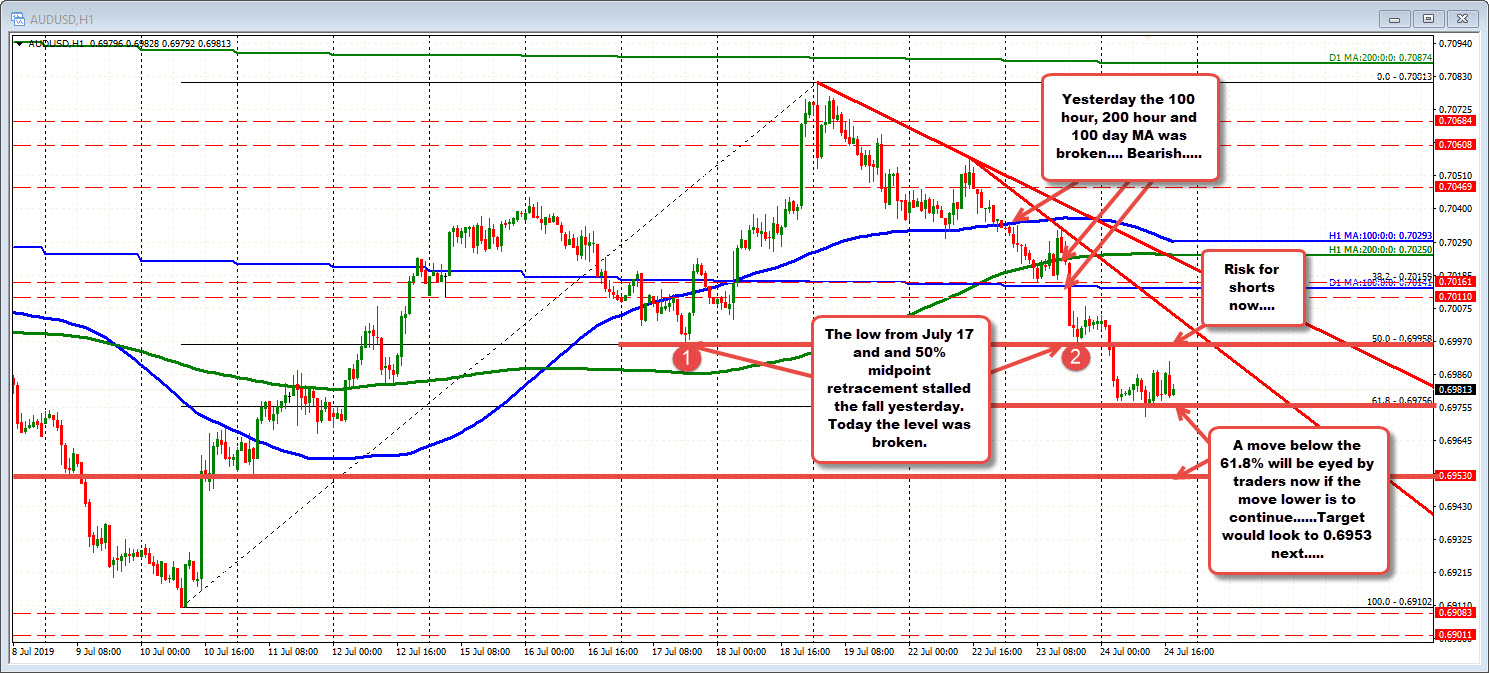
The AUDUSD moved below the 100 hour MA, 200 hour MA and 100 day MA yesterday. That shiifted the bias more to the downside. The 50% midpoint stalled the fall at 0.69958

The 61.8% retracement is rest point now and next downside target

Today, that 50% level (was also the low from July 17 – see post from yesterday)  was broken and it opened the door for more downside wander. The 61.8% at 0.69756 was breached on a single bar, but failed. The price has been able to stay above since then. Traders will be looking for a break to continue to progression lower. Holding keeps the dip buyers in the game.  

rfxsignals July 23, 2019 No Comments

Euro begins the week calmly. Overview 23.07.2019

Euro begins the week calmly. Overview 23.07.2019

EURUSD is opening the new week of July in good balance. The current quotations are 1.1220. Today is going to be a quiet day on the exchange market. The macroeconomic calendar is empty, and Monday has all chance to remain calm. However, some news from abroad is worth considering: the world trade wars may soon take a new step, because the US are now planning to bring Vietnam under their control. I was June when the US President Donald Trump first said that Vietnam is abusing the situation, sometimes behaving worse than China. Clearly, he was speaking about its trading behaviour. After the situation with the Chinese export to the USA became complicated, Vietnam developed a robust activity and increased the volume of export to the US. The export is said to have grown to 8% GDP, which is truly a lot. Naturally, Trump does not like it. As early as May Vietnam appeared on the list of countries – currency manipulators, and now it is prone to get increased taxation on its goods. The start is the same as with China: in July the US put a tax on the Vietnamese steel as high as 400%. Such conditions are absolutely noncompetitive, so the volume of the Vietnamese steel dropped significantly. With other goods it is more or less the same. The tax for Vietnamese goods may amount to 25%, as with China, which will deteriorate the export greatly and influence the GDP of the country. For the exchange market such steps will show not just deepening, but also widening of trade wars, so that the next goal of American trade protection may become any country of the world. In such circumstances demand for safe currencies, such as the dollar and yen, usually grows

GBPUSD weekly outlook 22-07-2019

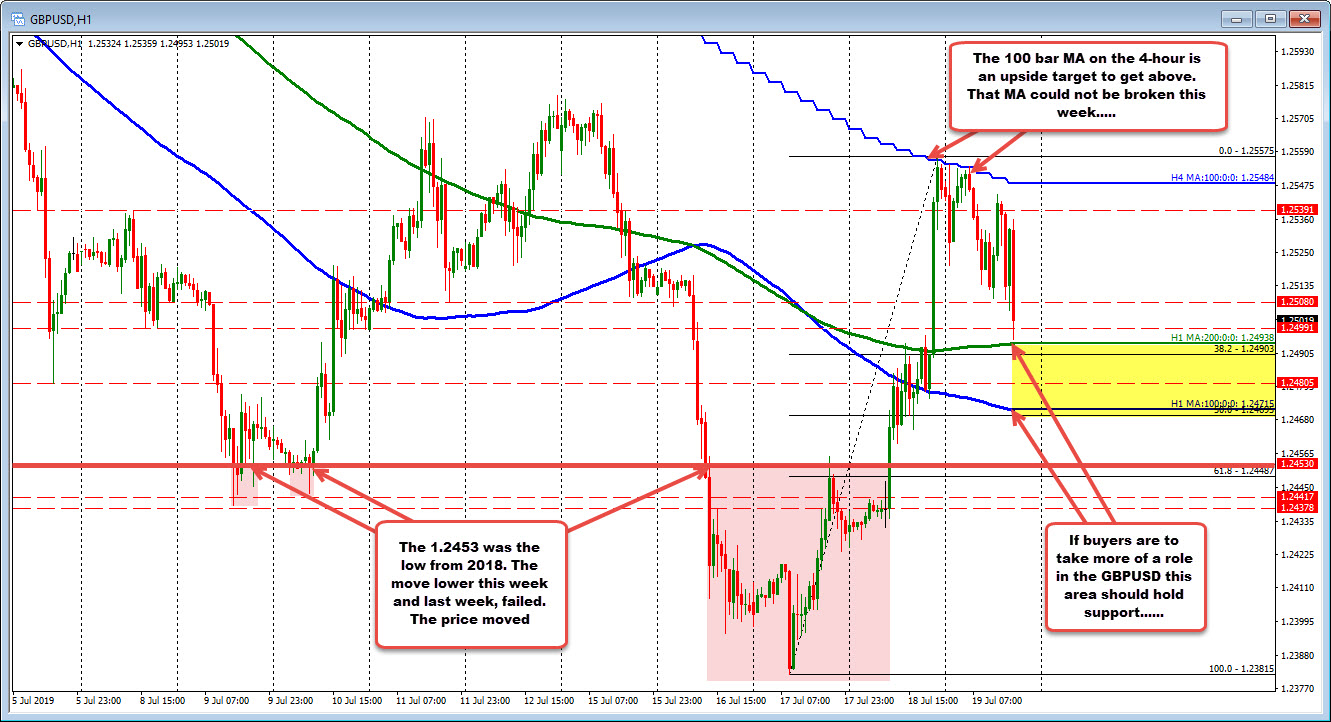
GBPUSD failed for the 2nd week in a row below 2018 lows

2018 low came in at 1.2453

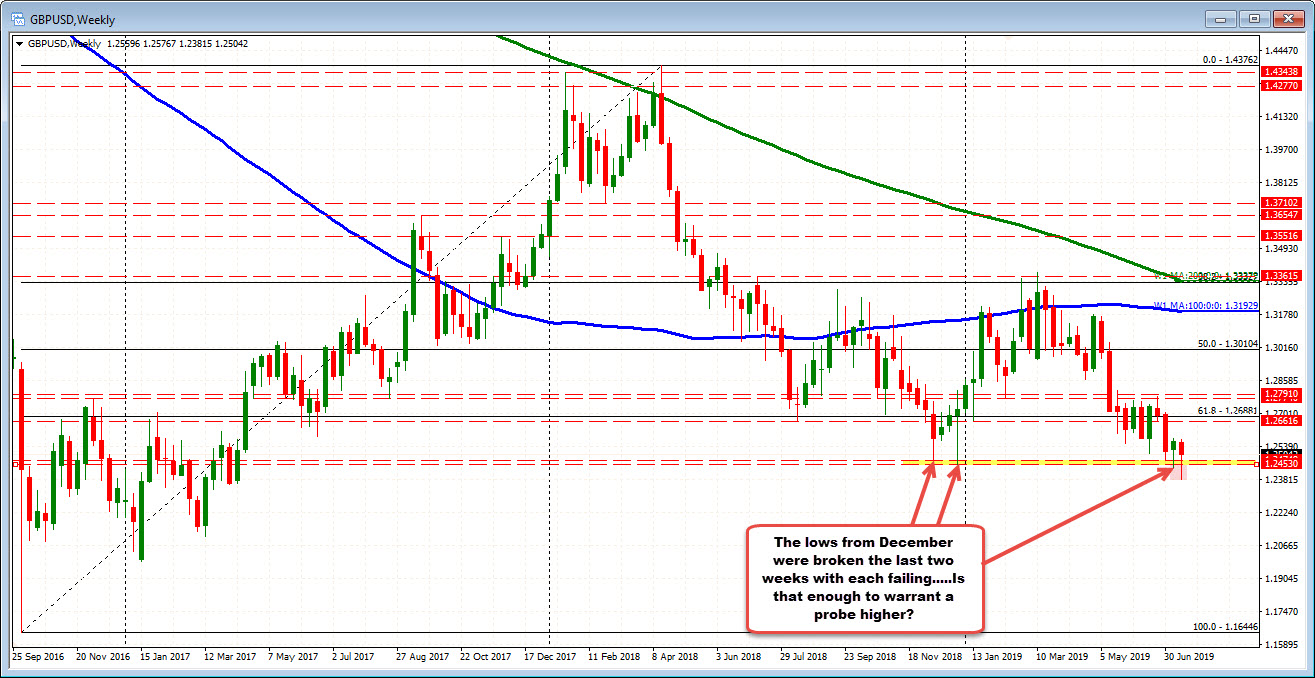
The GBPUSD traded below its 2018 low at 1.2453 for the 2nd week in a row, and barring a sharp fall today, the pair will fail on that break for the 2nd week in a row.  

2018 low came in at 1.2453

Last week the low reached 1.24378. This week the low got all the way down to 1.23815 on Wednesday before bouncing  (helped by better retail sales on Thursday) and the dollar selling on the back of the William’s comments.  
With two shots at going lower and two fails, traders may tilt short/intermediate term bias more to the upside (i.e., look for a dip to buy) with stops on a break back below the 1.2453 level.
Where is support?
Drilling to the hourly chart below, the pair is approaching support at the 200 hour MA at 1.24938 level and the 100 hour MA at the 1.24715 level. 
If you recall from yesterday, the pair moved up to 1.24968 just above the 200 hour MA, retraced to the 100 hour MA (blue line) before the run higher on the William’s commnets.  IN between sits the swing low from July 4 at 1.24805. 
The pair currently trades at 1.2506. The low for the day just reached 1.2494 – just ahead of the 200 hour MA.

GBPUSD on the hourly chart

It’s Friday and new positions may not be the best idea, but into trading next week, I would look toward the 100 and 200 hour MAs to be a support level for buyers with the idea that 2 failed shots to go and extend lower (below 2018 lows at 1.2453) is enough, and that the “market” may look to explore the upside instead.  Much will depend on the support against the 100 and 200 hour MAs.  
On a move to the upside, the obvious hurdle is at the 100 bar MA on the 4-hour chart at 1.25484. In the run higher yesterday and also today, that MA stalled the rallies.  It will take a move above to give the dip buyers some added confidence (but likely not until next week).  
Of course, the pound has a lot of hurdles on the road ahead with Brexit. The price action will reflect the good and the bad. However, from the two chances in the last two weeks, the sellers certainly had their shot and they missed.  Do the longs look to take a shot now?  Watch the support levels but respect them too. Moves below are the risk.  

rfxsignals July 1, 2019 No Comments

DAILY FREE FOREX SIGNALS FOR 01-07-2019 сигнал форекс ежедневно

GBPCHF SELL-1.24093
SL-1.24452
TP1-1.23819
TP2-1.23568

EURAUD BUY -1.62282
SL-1.61930
TP1-1.62480
TP2-1.62641

AUDCAD SELL-0.91571
SL-0.91931
TP1-0.91402
TP2-0.91244

AUDUSD SELL-0.69915
SL-0.70230
TP1-0.69715
TP2-0.69558

GBPUSD BUY-1.26567
SL-1.26215
TP1-1.26753
TP2-1.26940

EURUSD BUY -1.13551
SL-1.13186
TP1-1.13741
TP2-1.13921

USDCHF SELL-0.9824
SL-0.98616
TP1-0.97868
TP2-0.97613

NZDJPY SELL-72.528
SL-72.940
TP1-72.365
TP2-72.217

AUDNZD SELL-1.04388
SL-1.04761
TP1-1.04206
TP2-1.04028

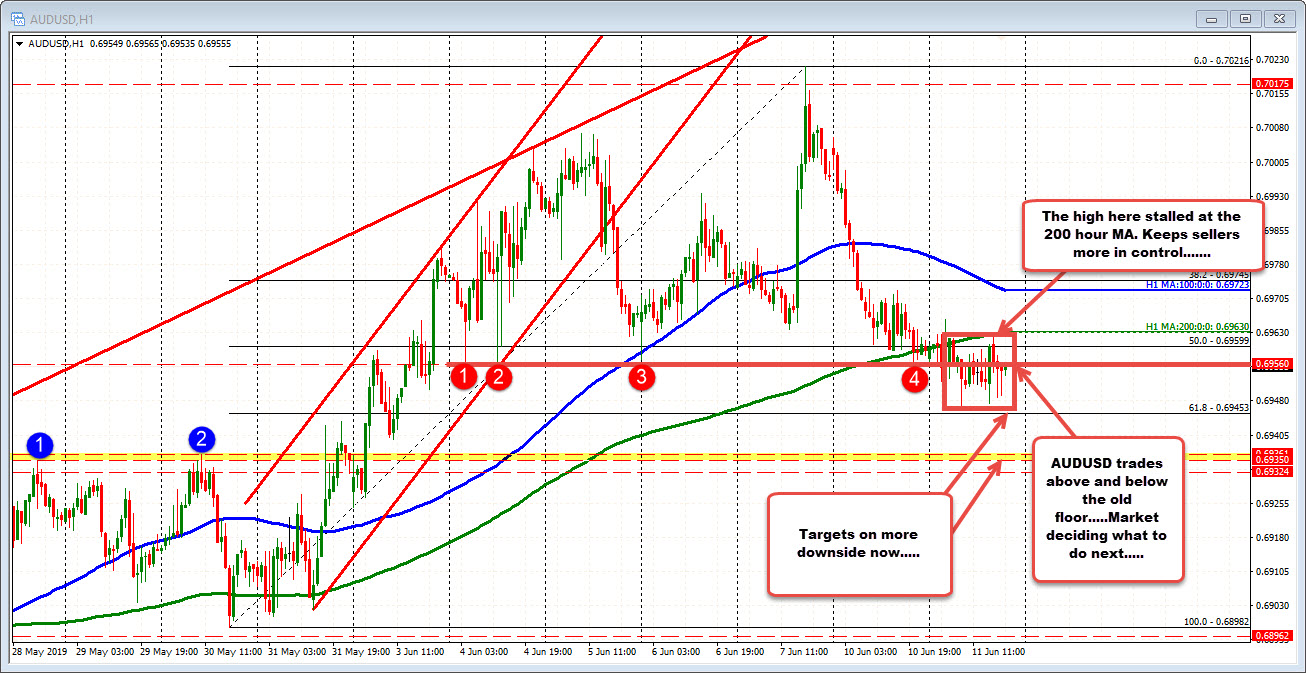
AUDUSD waffles up and down. Price under the 200 hour MA/50% retracement.

Tries to keep bearish bias in the AUDUSD

The AUDUSD has been waffling up and down in trading today. The low to high trading range is only 20 pips on the day. The 22 day average is 41 pips.  So the range is 1/2 what is normal over the last month of trading.  The price has been trading above and below an old floor area at the 0.6956 level.  The market is unsure what to do now.

Tries to keep bearish bias in the AUDUSD

The most recent high in the NY session stalled at the 200 hour MA (green line currently at 0.6963). The price is also below the 50% retracement of the move up from the May 30 low at 0.69599. Stay below each keeps the sellers more in control/tlts the bias to the downside.  
If the sellers are able to keep the the lid on the pair (stay below 200 hour MA), the 61.8% at 0.69453, and then the 0.6935-36 area (swing highs from May 28 and May 30) will be targeted.  

Euro Year-long Trend Nearing Decision Point

The long slow bearish channel in the euro is getting close to breakout decision, notes Al Brooks.

The EURUSD currency pair has been in a bear channel for a year. Protracted bear channels often end with a sharp break below the channel and then a reversal up. There is no sign yet that the pattern of two- to three-week rallies and two- to three-week selloffs is about to end.

The EURUSD weekly chart has been forming lower highs and lows for a year. This is a bear channel and there is no sign that it is about to end. Consequently, traders continue to buy reversals up from every new low and sell reversals down from rallies to above the 20-day exponential moving average. The legs up and down have lasted two to three weeks.

EURUSD weekly Forex chart in tight bear channel

The daily chart has been in a tight trading range for a month. Every trading range has both buy and sell setups. The bears have a double top with the May 1 and May 13 highs. The bulls have a double bottom with the April 26 and May 23 low.

Because the chart is now near the 52-week low, traders are expecting a reversal up. The reversal can come from above or below the May 23 low. But, a two- to three-week reversal up is more likely that a strong break below the May low.

Possible sell climax below yearlong bear channel

When a bear channel lasts a long time, it often ends with a sell climax. There can be a strong break below the bear channel, but 75% of the time, a bear break below a bear channel reverses up within five bars.

Five bars, but on what time frame? It is the highest time frame that shows the channel. That is the weekly chart.

If traders see a strong selloff over the next few weeks that breaks strongly below the 52-week low and the bear channel, they should be ready for a reversal up. If there is a reversal up, it usually leads to a swing up. The minimum goal would be 10 bars and two legs. It could last longer and go much higher.
Since the weekly chart is in a Spike and Channel bear trend, traders will expect a reversal up to test the start of the bear channel. That is the June 14, 2018 high of 1.1851. Since that is far above, any rally would take many months to get there.

Bear channels usually evolve into trading ranges. Therefore, even if the bulls get a strong reversal up, it will probably be a bull leg in a trading range that will last a year or more.

Trading Room