Daily Forex Market Analysis: Mastering Support and Resistance Levels
Support and resistance are the backbone of technical analysis in forex trading. Today’s deep dive provides a complete breakdown of how to identify these levels, understand their importance, and trade them with confidence. This 1500-word daily analysis blends theory with practical market examples.
1. The Role of Support and Resistance in Forex
Support is a price level where buying interest prevents further decline, while resistance is where selling pressure halts upward moves. Together, these levels represent the collective psychology of traders. Every bounce from support or rejection at resistance reflects millions of individual decisions about fear, greed, and timing.
2. Identifying Key Levels
To find reliable support and resistance zones, traders should start on higher timeframes like the daily and weekly charts. Mark the most obvious swing highs and lows where price reversed multiple times. Horizontal levels with repeated tests are far more reliable than those touched only once.
3. Dynamic vs. Static Levels
Support and resistance aren’t limited to horizontal zones. Moving averages, trendlines, and channels act as dynamic support and resistance. For example, the 200-day moving average is often watched by institutions as a long-term dividing line between bullish and bearish sentiment.
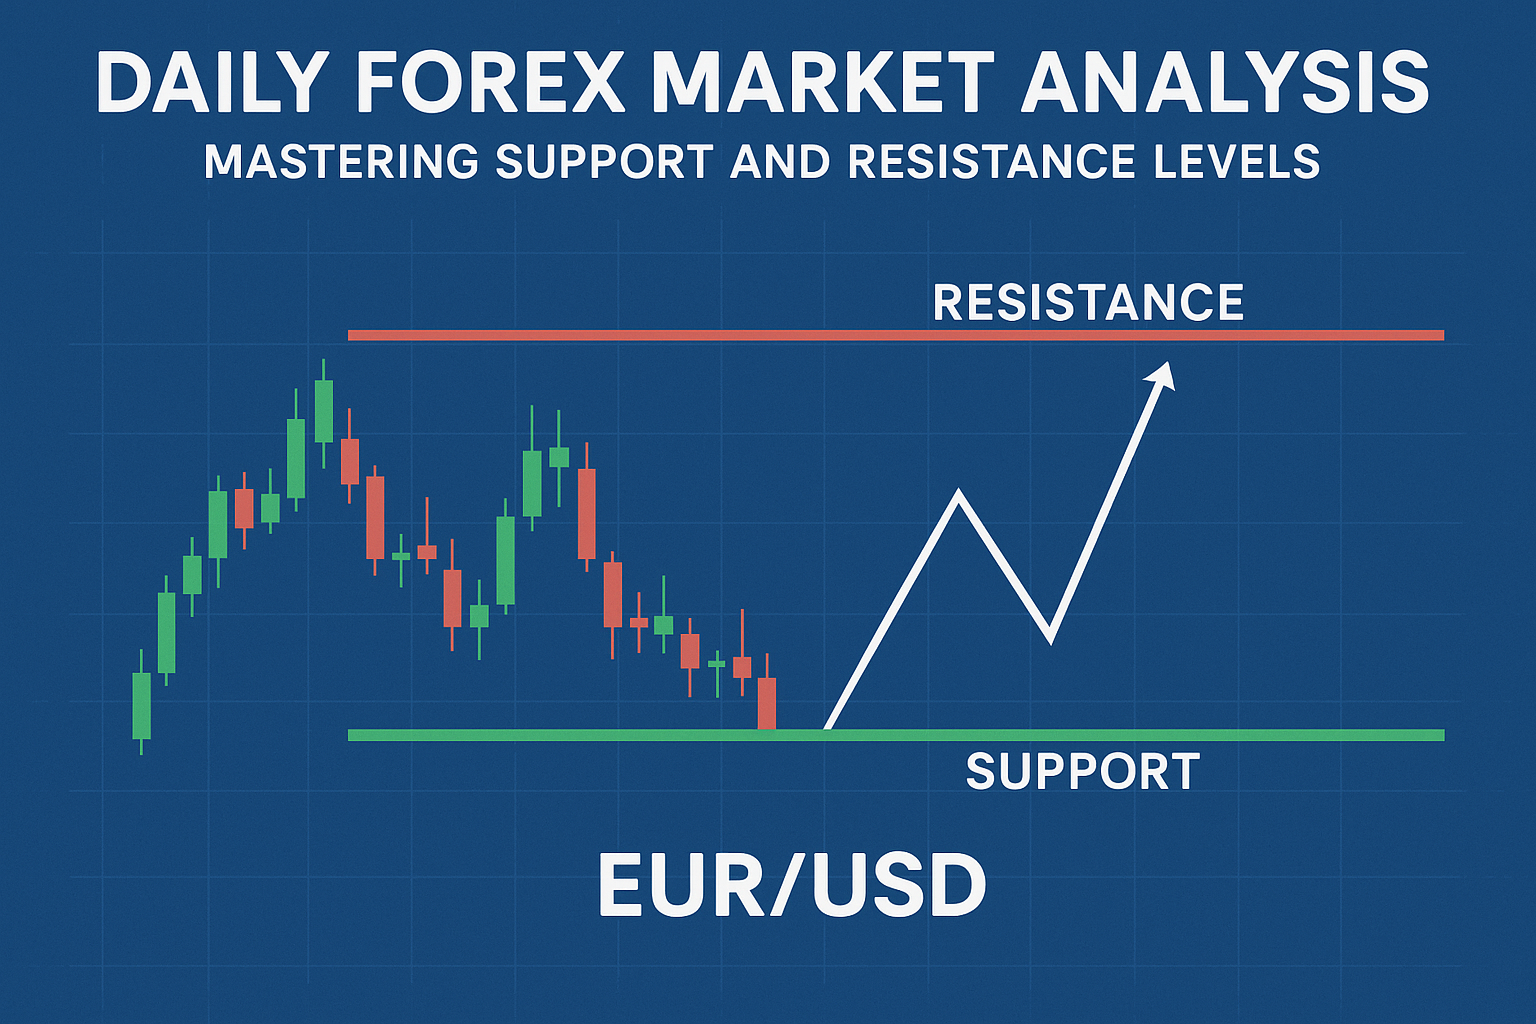
4. Market Example: EUR/USD
As of today, EUR/USD has been consolidating between 1.0820 support and 1.0930 resistance. Each test of 1.0820 brought buyers back, while rallies toward 1.0930 quickly faded. Traders watching these levels could plan for breakout trades if the range is breached, or scalp smaller moves inside the zone until a decisive trend emerges.
5. Support and Resistance Flip
When support is broken, it often becomes new resistance, and vice versa. This “role reversal” is one of the most reliable principles of technical trading. For example, if GBP/USD drops below 1.2500 support and retests it from below, that level often becomes a ceiling where sellers re-enter.
6. False Breakouts and Traps
Markets frequently test levels with false breakouts. Price may pierce support only to close back above, trapping early sellers. Smart traders wait for confirmation through candlestick closes or additional indicators before declaring a breakout valid. Recognizing traps saves traders from unnecessary losses.
7. Combining with Volume and Indicators
Support and resistance become more powerful when confirmed by volume spikes, RSI divergences, or MACD signals. For instance, a bullish divergence forming at long-term support strengthens the probability of a bounce. Similarly, heavy volume on a breakout suggests the move may sustain.
8. Practical Trade Setups
Breakout Trading
Enter when price decisively closes beyond support or resistance. Place stops just beyond the level to protect against false moves. Targets can be measured using the distance of the previous range.
Range Trading
Buy at support and sell at resistance when the market is consolidating. Use tight stops just outside the range boundaries. Range trading works best in sideways markets with no major news events looming.
9. Fundamental Context
Support and resistance levels gain importance during economic events. If USD/JPY approaches 150.00 resistance on the same day as a Bank of Japan policy meeting, the outcome could determine whether the level holds or breaks. Always align technical levels with fundamental drivers.
10. Case Study: Gold (XAU/USD)
Gold recently tested $1900, a psychological round number support, multiple times. Buyers stepped in strongly, pushing price back toward $1950 resistance. Traders who combined technical analysis with the backdrop of inflation reports and Fed commentary had a clearer picture of why these levels mattered.
11. Common Mistakes to Avoid
- Marking too many levels, which clutters charts and creates confusion.
- Ignoring higher-timeframe zones in favor of intraday noise.
- Placing trades before confirmation, especially during volatile news releases.
- Failing to adapt — support and resistance levels evolve as markets shift.
12. Checklist for Trading Support and Resistance
- ✅ Identify higher timeframe levels first (daily/weekly).
- ✅ Look for confluence with moving averages or trendlines.
- ✅ Watch for candlestick confirmation (engulfing, pin bar, inside bar).
- ✅ Align with fundamentals and upcoming news events.
- ✅ Always define risk with stop-loss orders beyond the level.
Conclusion
Support and resistance remain timeless concepts in forex trading. By combining them with candlestick analysis, indicators, and fundamental awareness, traders gain a robust framework for decision-making. Today’s examples from EUR/USD, GBP/USD, and Gold demonstrate how these levels act as roadmaps for intraday and swing trades alike.
As you plan your trades, remember: markets respect these zones because traders do. By mastering them, you align yourself with the rhythm of the market.