06.09.2019
BTCUSD, “Bitcoin vs US Dollar”
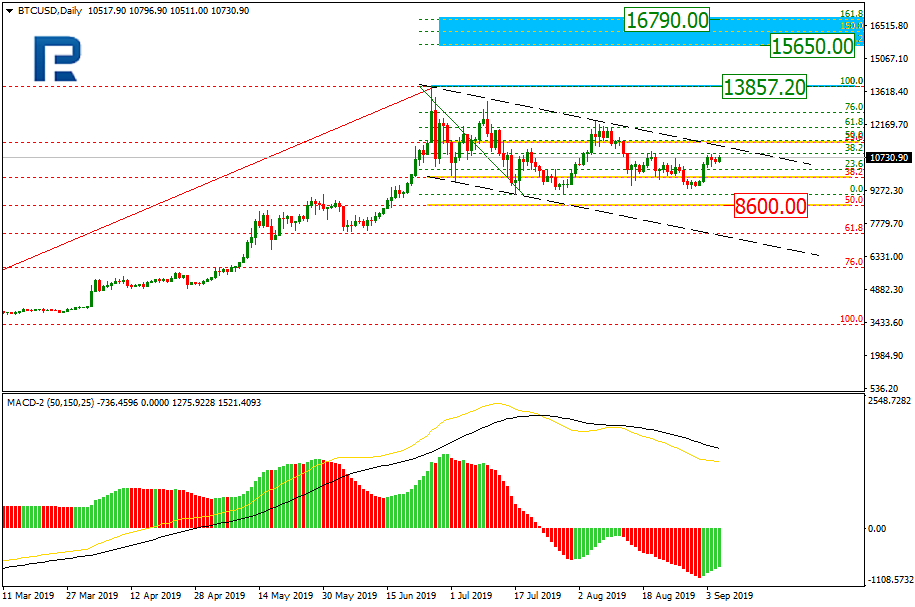
As we can see in the daily chart, the correctional channel is transforming into Triangle. If the price breaks the current resistance live, BTCUSD will continue growing towards the high at 13857.20. More significant upside targets are inside the post-correctional extension area between 138.2% and 161.8% fibo at 15650.00 and 16790.00 respectively. At the same time, MACD lines are heading downwards, which means that the decline may yet continue towards 50.0% fibo at 8600.00.

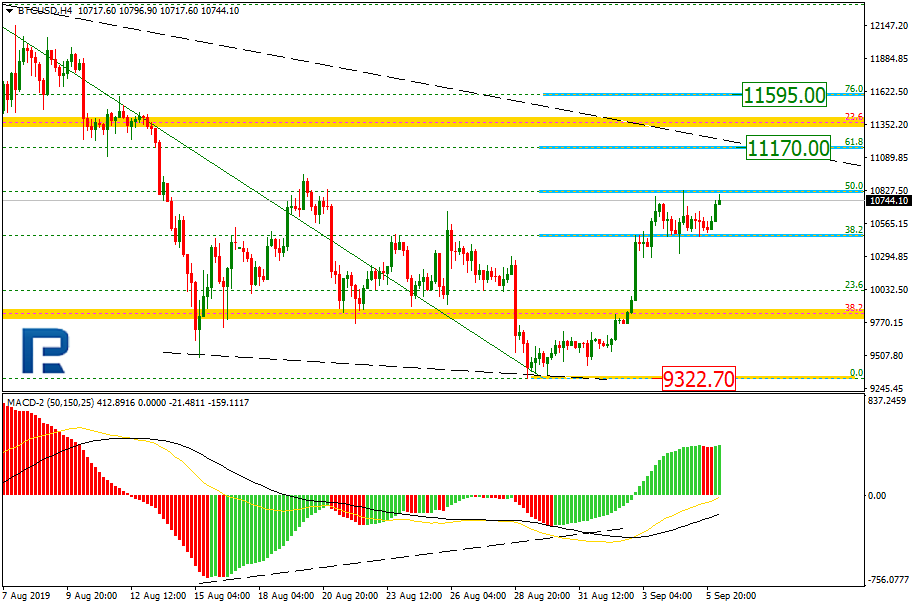
In the H4 chart, the pair is correcting to the upside after finishing another descending wave and has already reached 50.0% fibo. In the future, the correction may continue towards 61.8% and 76.0% fibo at 11170.00 and 11595.00 respectively. The support is the low at 9322.70.
ETHUSD, “Ethereum vs. US Dollar”
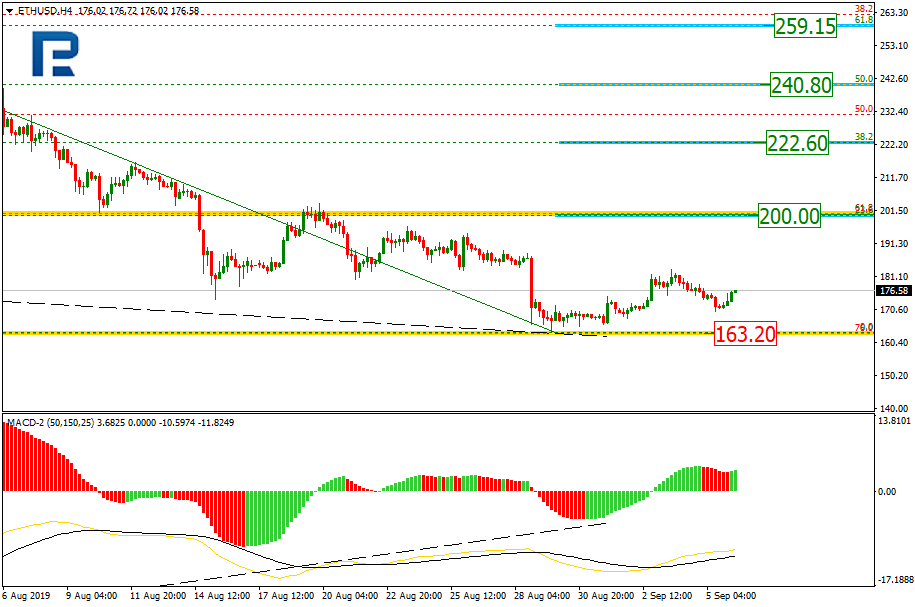
As we can see in the H4 chart, the descending tendency reached 76.0% fibo and then there was a convergence on MACD. In this case, ETHUSD may start a new growth towards 23.6%, 38.2%, 50.0%, and 61.8% fibo at 200.00, 222.60, 240.80, and 259.15 respectively.
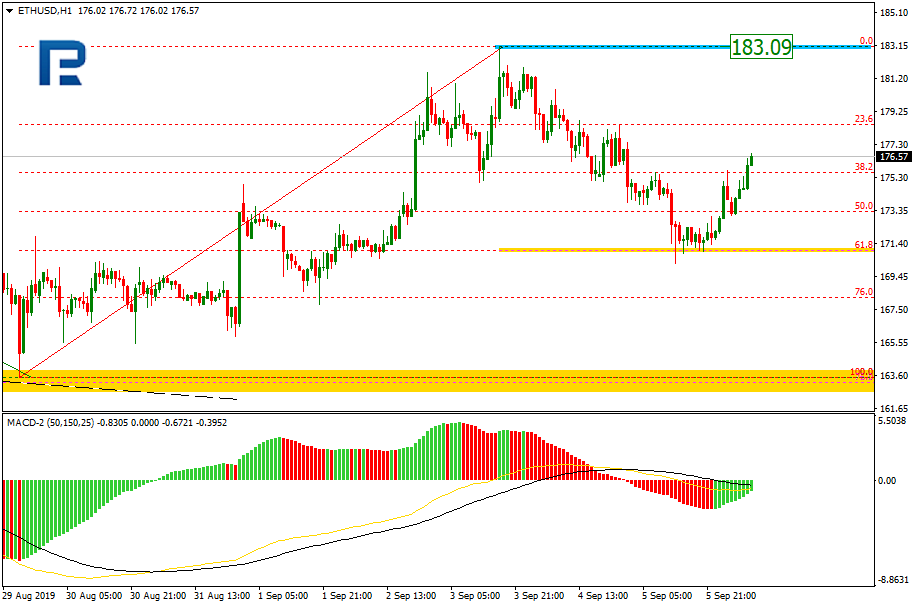
In the H1 chart, after completing the descending correction at 61.8% fibo, the price is starting a new impulse to the upside to reach the high at 183.09.
Back to listAttention!
Forecasts presented in this section only reflect the author’s private opinion and should not be considered as guidance for trading. RoboForex bears no responsibility for trading results based on trading recommendations described in these analytical reviews.