23.08.2019
BTCUSD, “Bitcoin vs US Dollar”
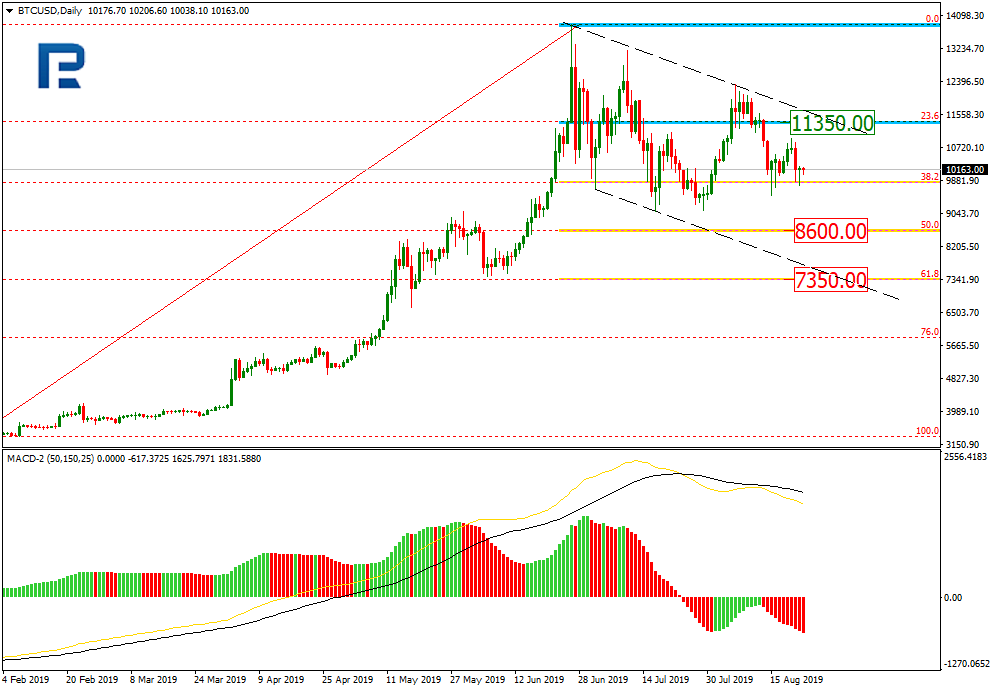
As we can see in the daily chart, BTCUSD has tested 38.2% fibo again. The previous rising impulse couldn’t continue moving towards the high. The resistance is 23.6% fibo at 11350.00. Judging by MACD, the current decline may continue, that’s why after breaking its local lows, the instrument may fall towards 50.0% and 61.8% fibo at 8600.00 and 7350.00 respectively.
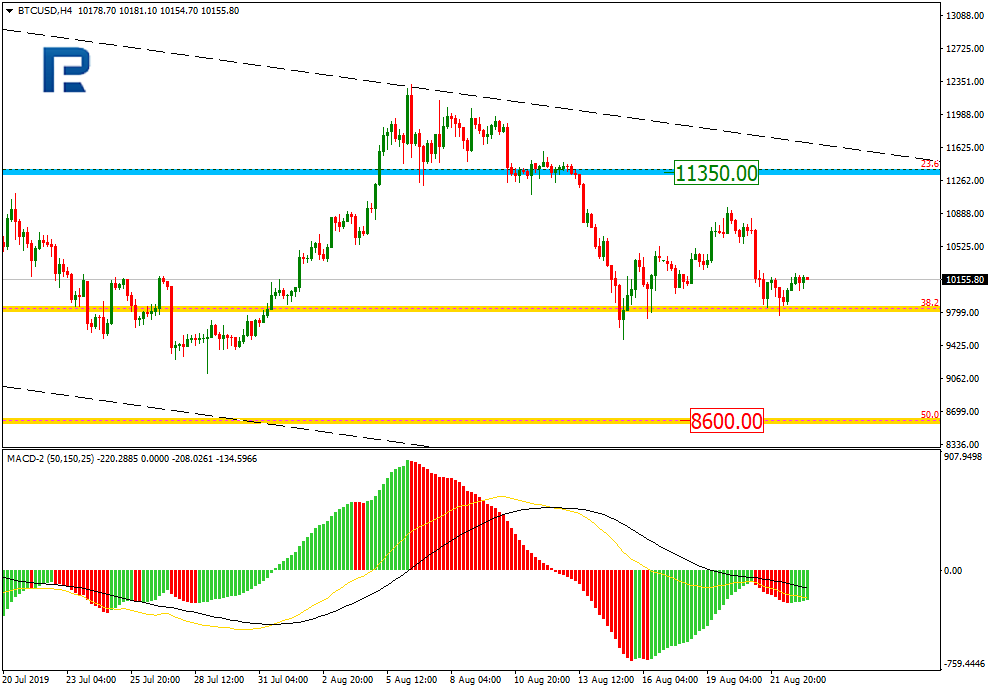
In the H4 chart, highs and lows are getting closer to each other, which means that the pair is consolidating. Possibly, the price may grow to reach 23.6% fibo at 11350.00 again in the nearest future. However, the major tendency remains descending.
ETHUSD, “Ethereum vs. US Dollar”
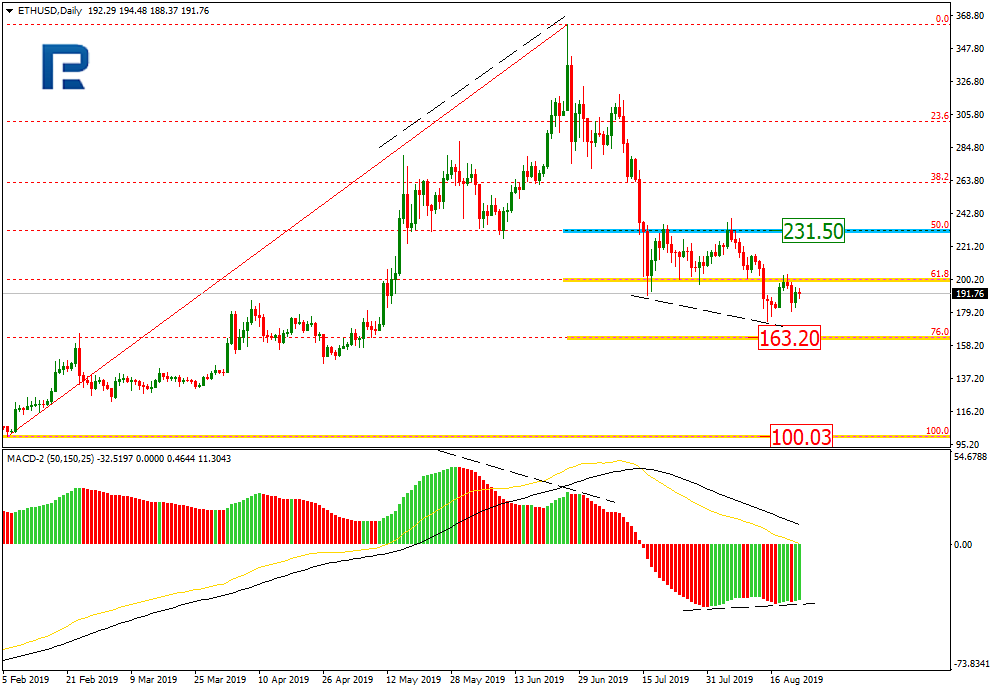
As we can see in the daily chart, the convergence made the pair start a new pullback, which has quickly reached 61.8% and 76.0% fibo. The resistance is 50.0% fibo at 231.50, which may be the target of the correction. The target of the next impulse may be 76.0% fibo at 163.20).
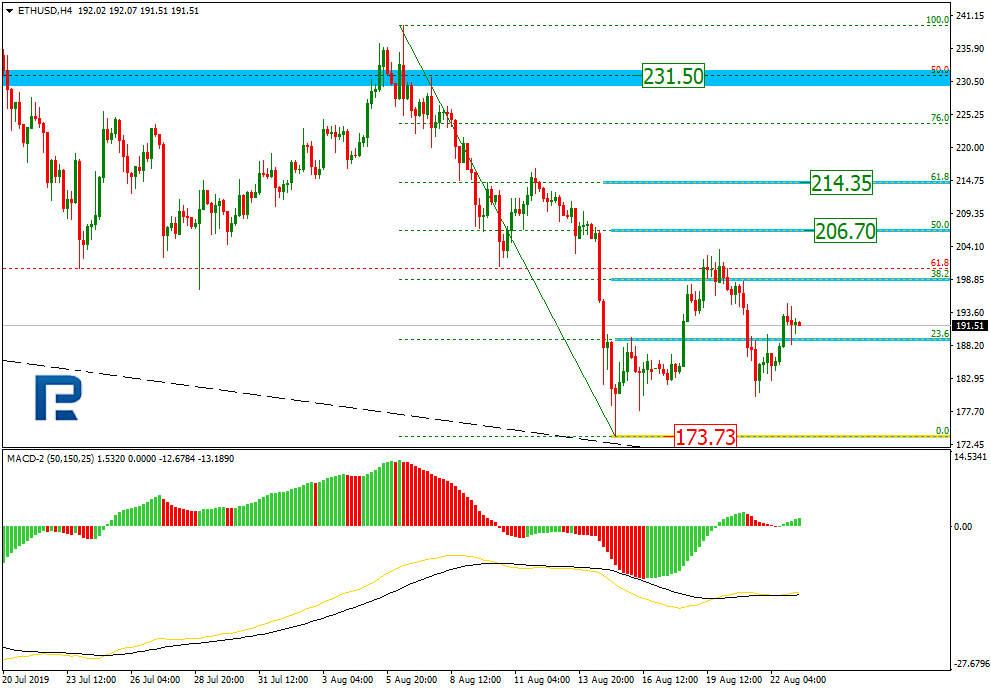
In the H4 chart, the instrument is being corrected to the upside; the first correctional wave has already reached 38.2% fibo. The next targets may be 50.0% and 61.8% fibo at 206.70 and 214.35 respectively.