24.10.2019
AUDUSD, “Australian Dollar vs US Dollar”
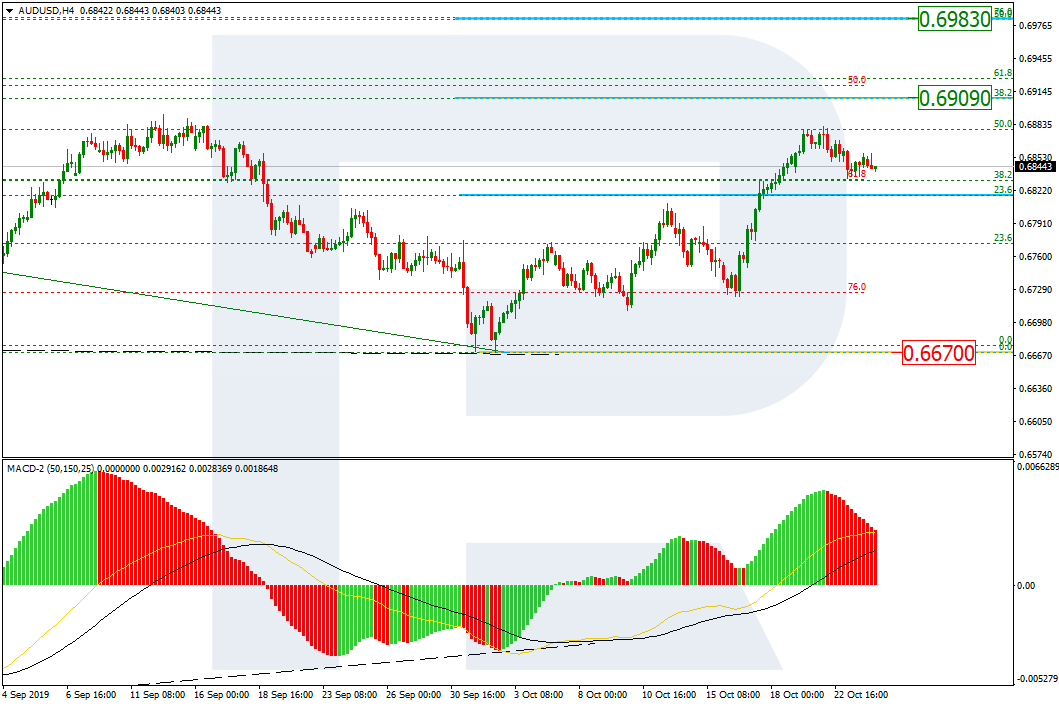
As we can see in the H4 chart, the convergence made the pair start a new growth; by now, it has fixed above 23.6% fibo. In the nearest future, AUDUSD may start a new pullback and return to this level. After the pullback, the correctional uptrend may continue towards 38.2% and 50.0% fibo at 0.6909 and 0.6983 respectively. The key support is the fractal at 0.6670.

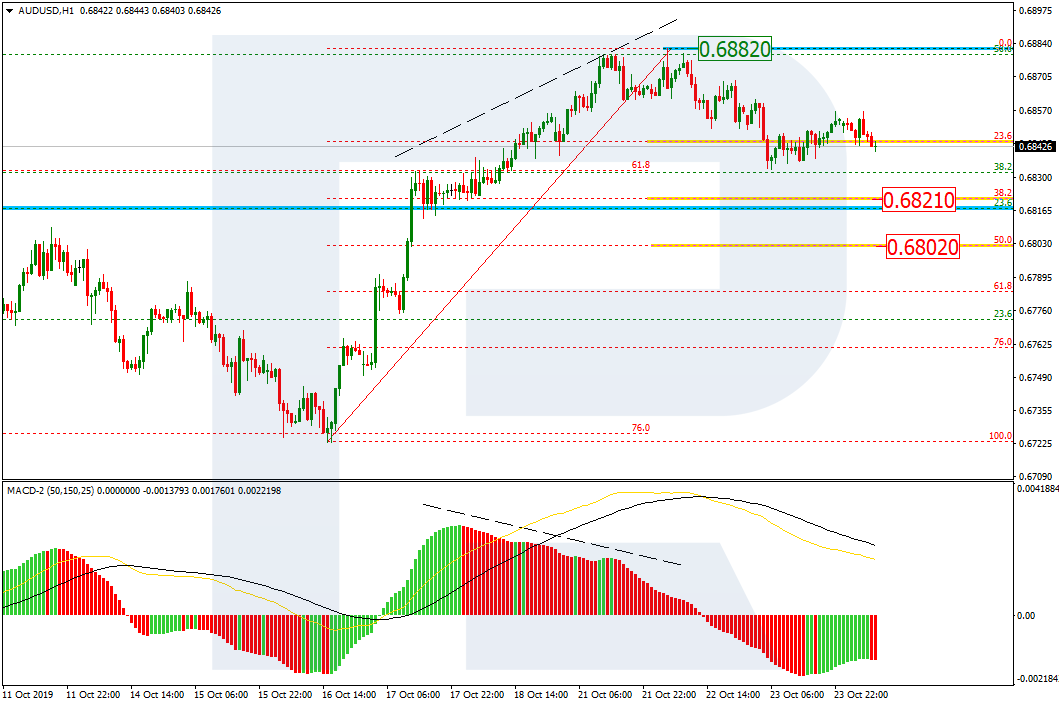
In the H1 chart, AUDUSD is correcting downwards after the divergence and has already reached 23.6% fibo. The next downside targets may be 38.2% and 50.0% fibo at 0.6821 and 0.6802 respectively.
USDCAD, “US Dollar vs Canadian Dollar”
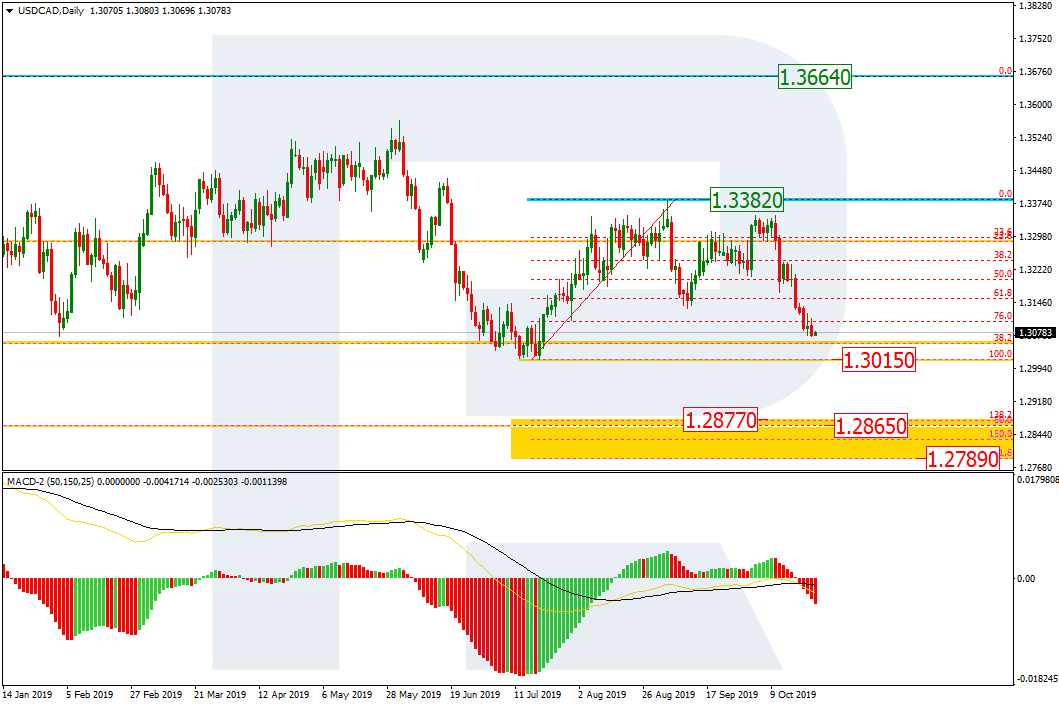
As we can see in the daily chart, USDCAD has been moving between 23.6% and 38.2% fibo for quite a long time; right now, the pair is again moving to test 38.2% fibo and the low at 1.3015, which means that the price is probably about to start a new descending impulse within the bearish trend. The next downside targets inside the post-correctional extension area between 138.2% and 161.8% fibo at 1.2877 and 1.2789 respectively. Moreover, mid-term 50.0% fibo at 1.2865 is also there.
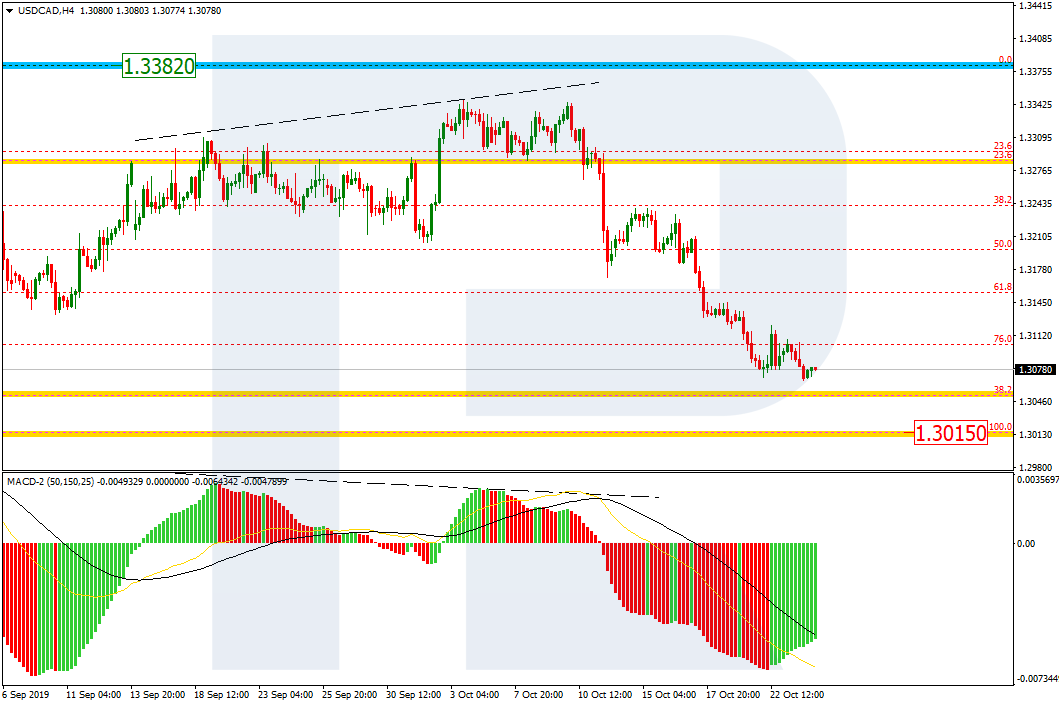
The H4 chart shows more detailed structure of the current decline after the divergence. The closest downside target is the low at 1.3015.