Fibonacci Retracements Analysis 26.05.2020 (EURUSD, USDJPY)
EURUSD, “Euro vs US Dollar”
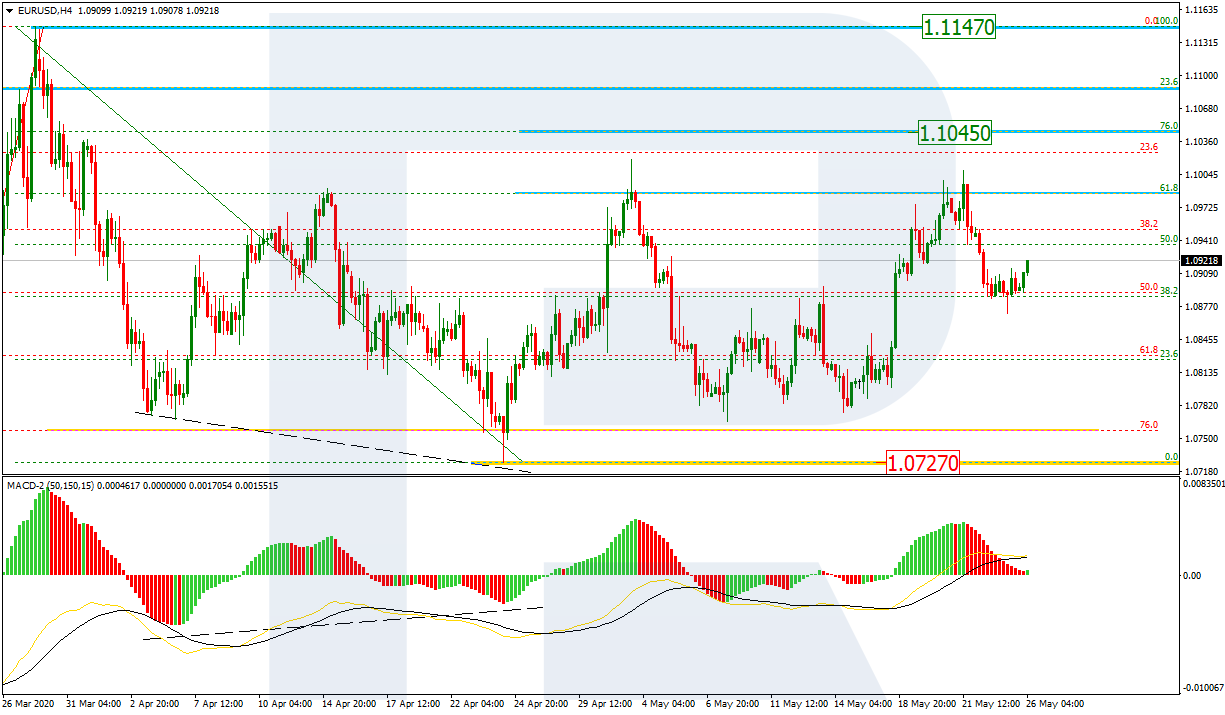
As we can see in the H4 chart, the pair continues the correction after the convergence on MACD. During the correction, EURUSD has already tested 61.8% fibo twice. At the moment, the price is correcting to the downside after attempting to update its previous high. After completing this pullback, the asset may start a new rising impulse to reach 76.0% fibo at 1.1045. However, the key upside target remains at the high (1.1147). The support is the low at 1.0727.

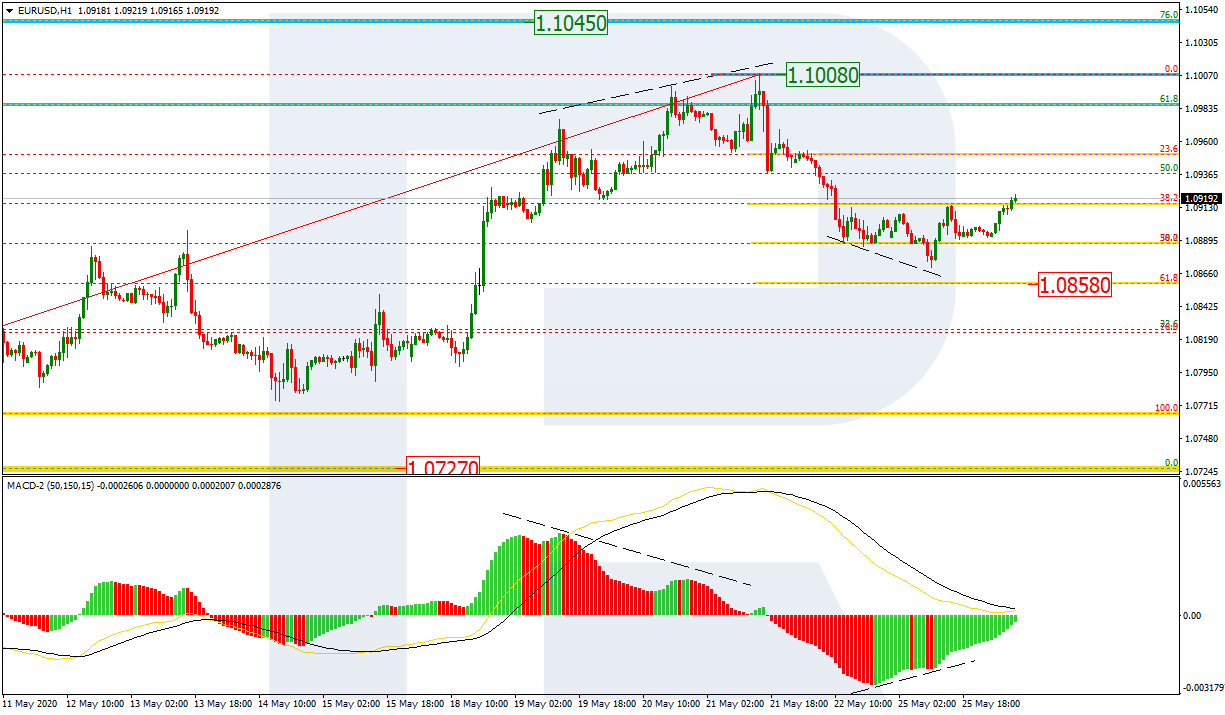
In the H1 chart, after finishing the ascending wave, the pair started a local pullback, which has already reached 50.0% fibo. Possibly, the pair may yet continue falling towards 61.8% fibo at 1.0858 but a more probable scenario implies further growth to reach the high at 1.1008, which is confirmed by a local convergence on MACD.
USDJPY, “US Dollar vs. Japanese Yen”
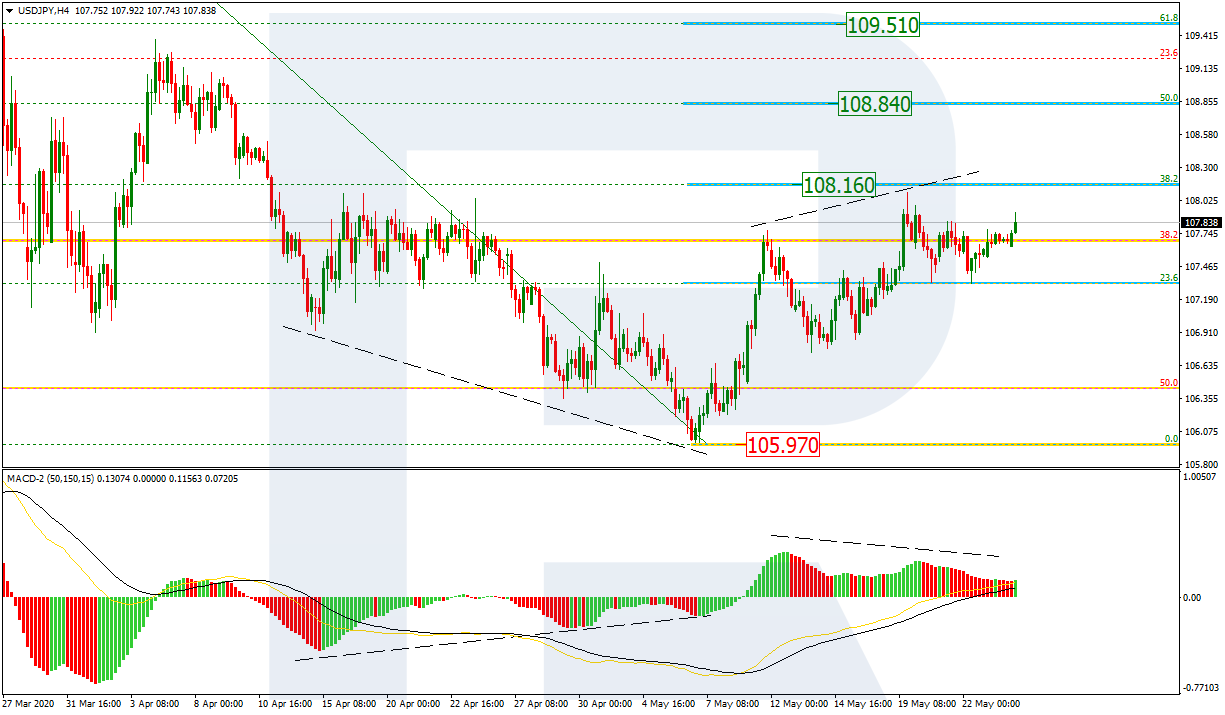
In the H4 chart, after the convergence, the pair has almost reached 38.2% fibo at 108.16. The next upside targets may be 50.0% and 61.8% fibo at 108.84 and 109.51 respectively. At the same time, there is a divergence on MACD, which may indicate a new decline after the asset reaches one of its target levels. The support is the low at 105.97.
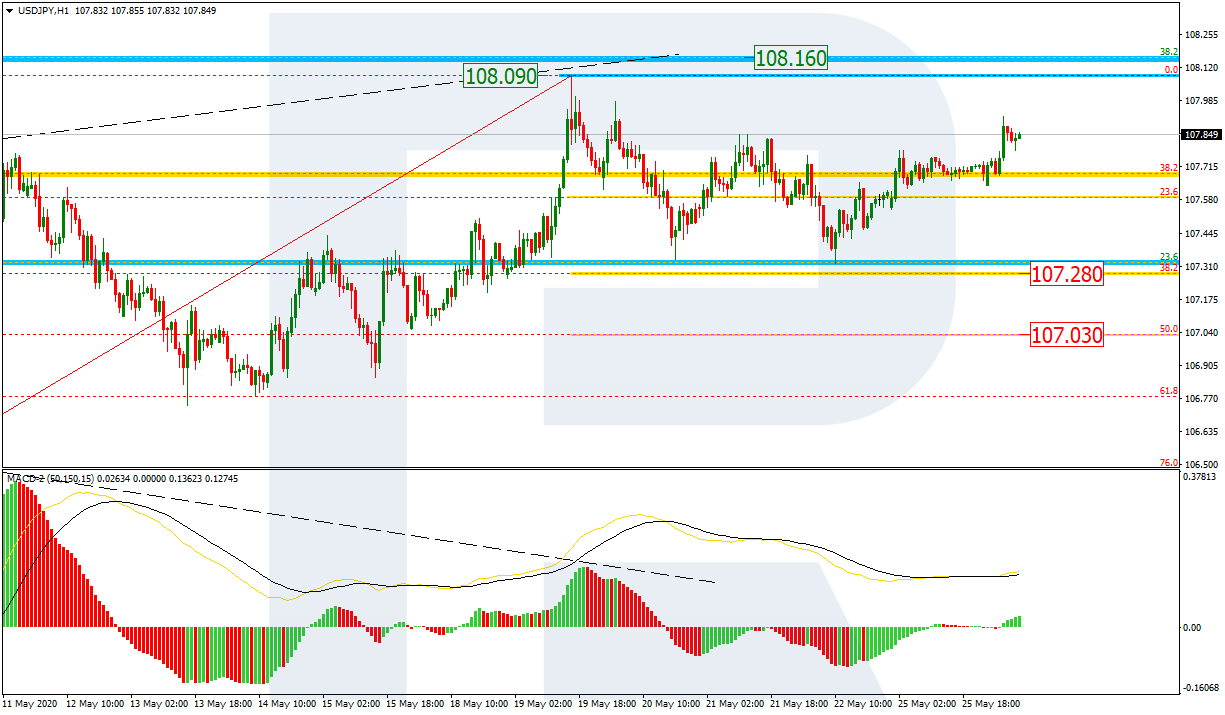
As we can see in the H1 chart, the short-term decline has almost reached 38.2% fibo at 107.28 and may yet continue towards 50.0% fibo at 107.03. However, a more probable scenario implies that the instrument is expected to reach and break the high at 108.09.