Brent
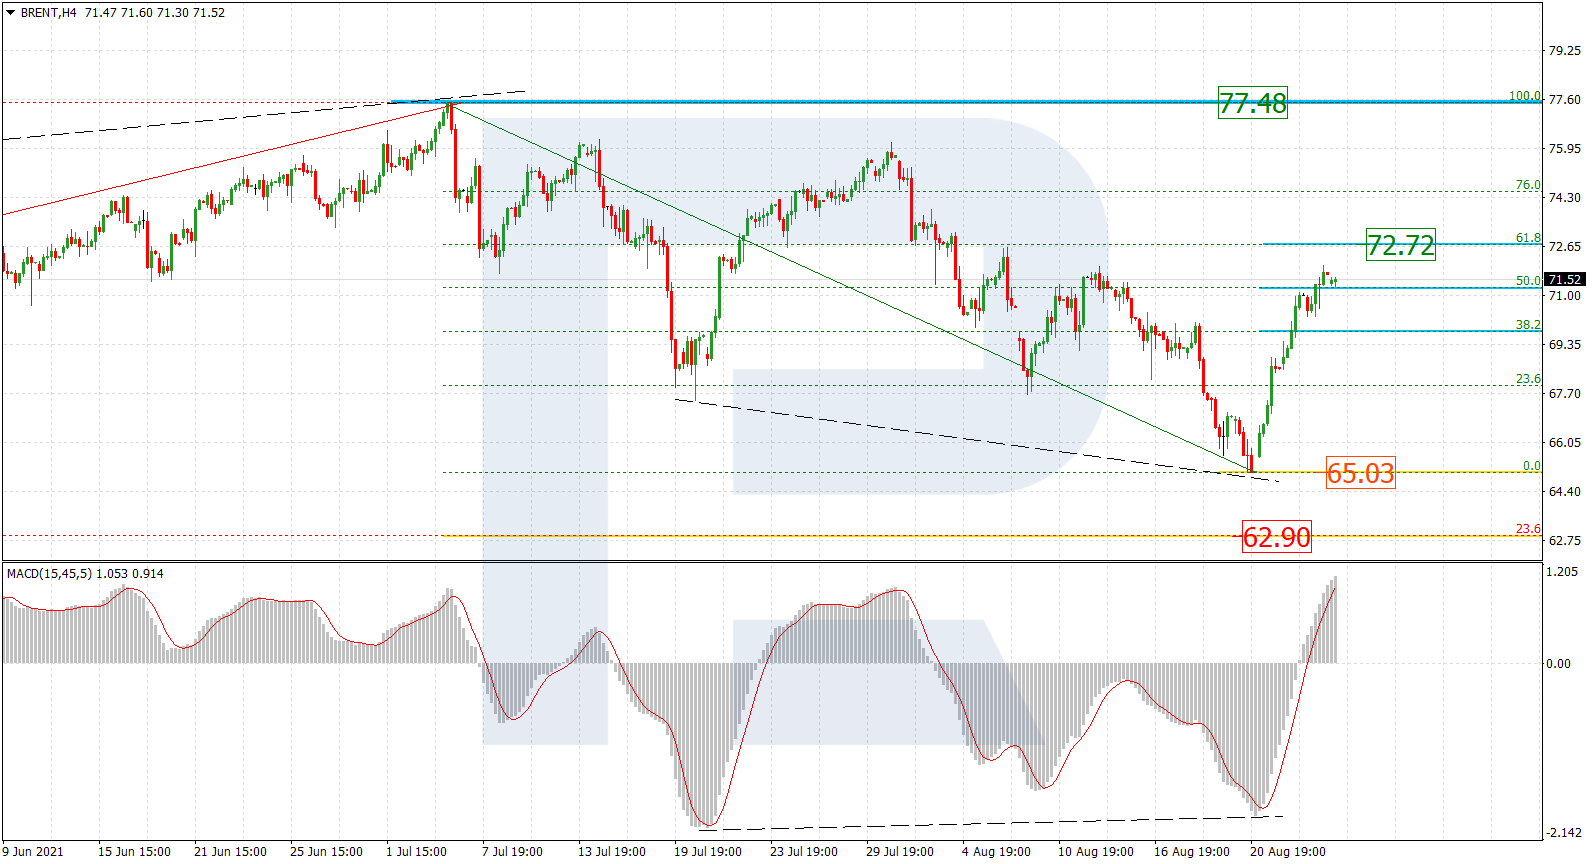
In the H4 chart, Brent is steadily moving upwards after convergence on MACD and has already reached 50.0% fibo. Later, the asset may continue growing towards 61.8% fibo at 72.72. This ascending movement should be considered as a correction, that’s why it may later be followed by a new decline to break the low at 65.03 and reach the mid-term 23.6% fibo at 62.90. The resistance is still close to the high at 77.48.

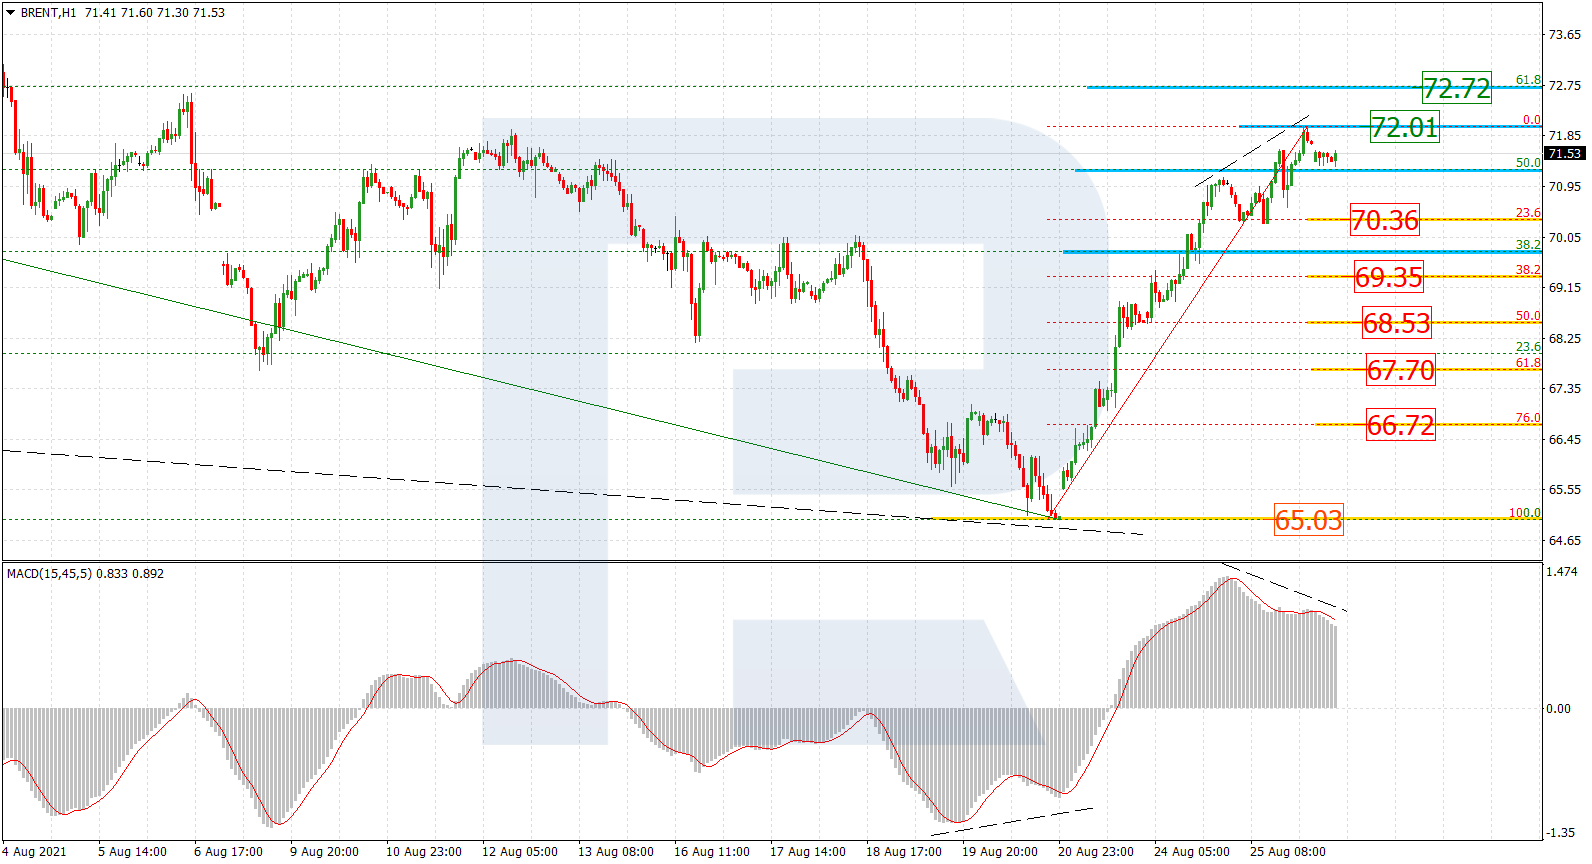
As we can see in the H1 chart, divergence on MACD is making the price complete the ascending wave and may indicate a new decline soon to reach 23.6%, 38.2%, 50.0%, 61.8%, and 76.0% fibo at 70.36, 69.35, 68.53, 67.70, and 66.72 respectively. The resistance is the local high at 72.01.
Dow Jones
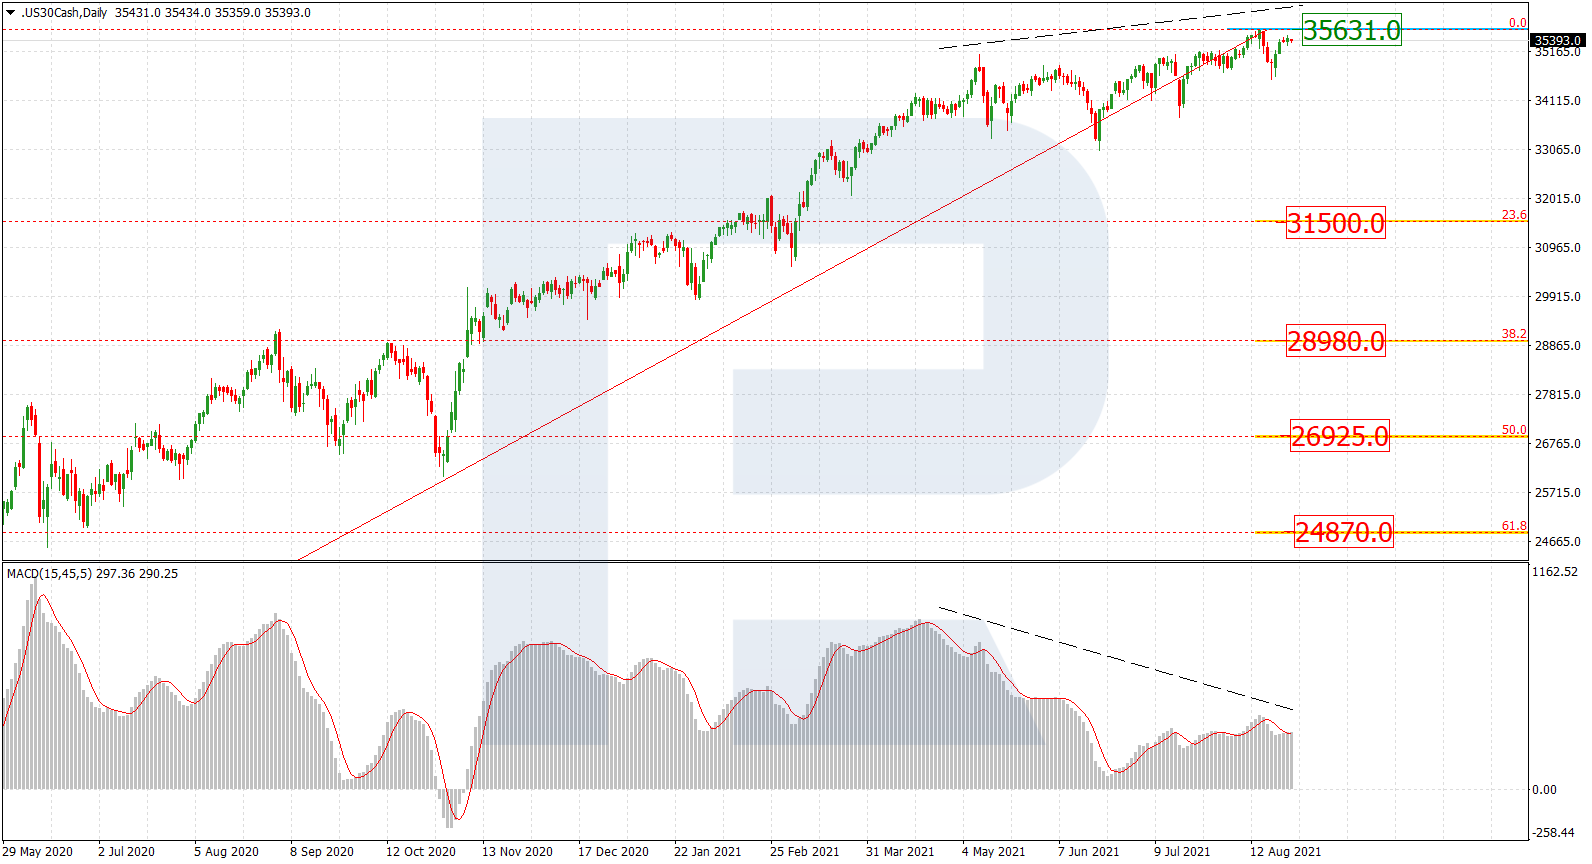
The daily chart shows another attempt to grow and break the high at 35631.0. However, as long as the price is moving below the high, divergence on MACD may force the index to continue falling. In this case, the bearish targets are 23.6%, 38.2%, 50.0%, and 61.8% fibo at 31500.0, 28980.0, 26925.0, and 24870.0 respectively.
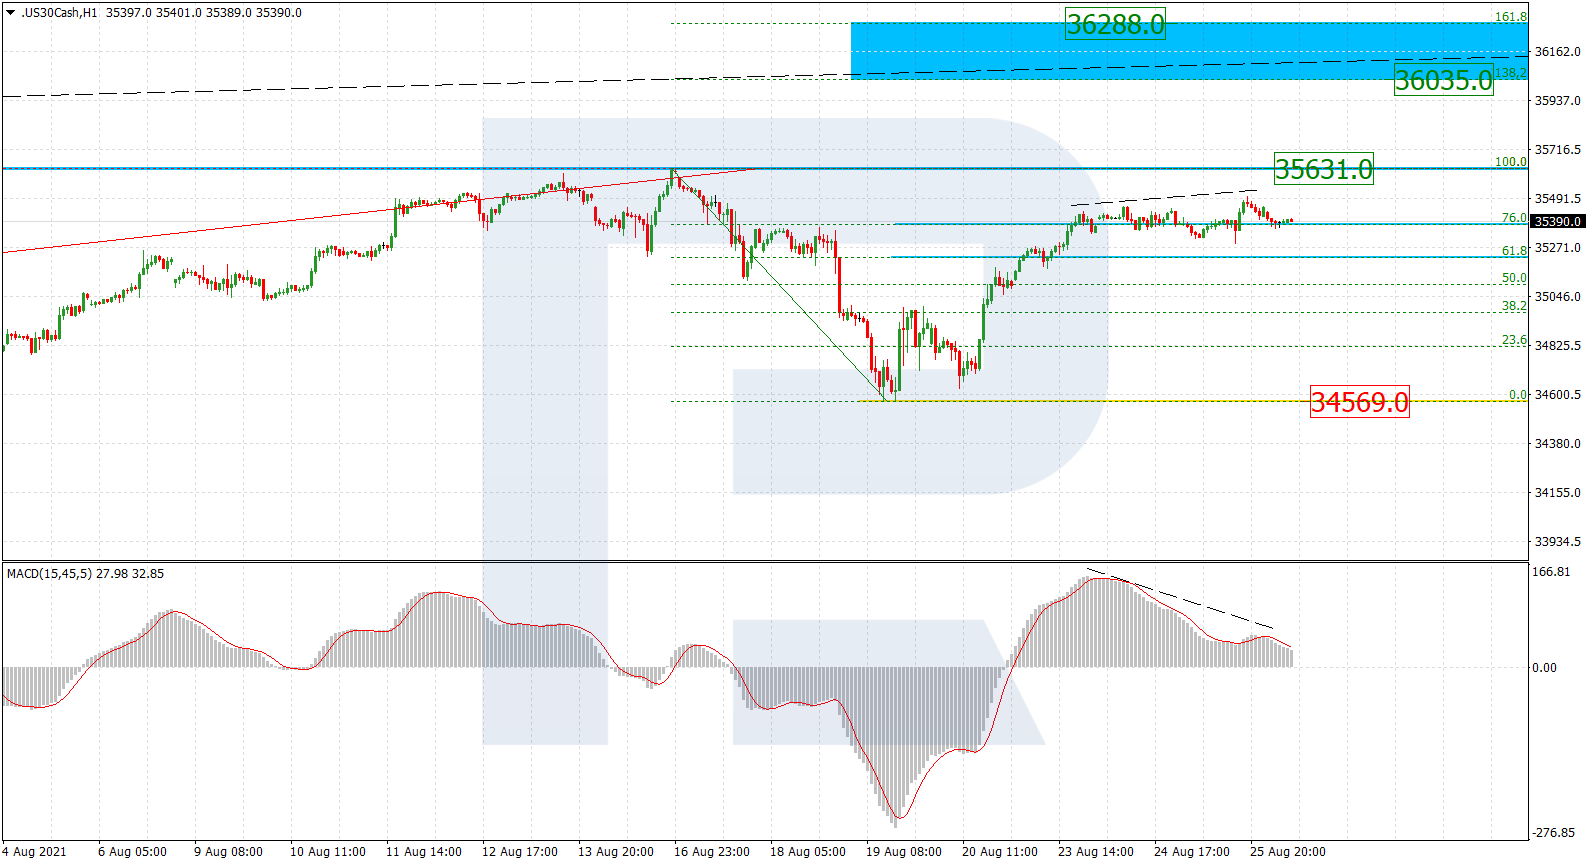
In the H1 chart, the asset is moving upwards and has already reached 76.0% fibo. This technical picture implies that the index may break the high at 35631.0 and continue growing towards the post-correctional extension area between 138.2% and 161.8% fibo at 36035.0 and 36288.00 respectively. The local support is the low at 34569.0.