Fibonacci Retracements Analysis 29.01.2021 (BITCOIN, ETHEREUM)
BTCUSD, “Bitcoin vs US Dollar”
In the H4 chart, after several correctional waves to the downside, BTCUSD is trying to form a sideways channel. Later, the market may break this channel upwards to reach the high at 42017.50 and then continue growing towards the post-correctional extension area between 138.2% and 161.8% fibo at 47080.00 and 50213.00 respectively However, an alternative scenario suggests that the channel may be broken downwards. In this case, the asset may try to reach 38.2%, 50.0%, and 61.8% fibo at 27480.00, 22970.00, and 18507.00 respectively again.


The H1 chart shows a new rising wave and the price is re-testing 38.2% fibo. If the price reaches 50.0%, 61.8%, and 76.0% fibo at 35430.00, 37000.00, and 38870.00 respectively, it will be a signal to confirm further growth. On the other hand, a breakout of the low at 28812.50 may hint at a further mid-term correction to the downside.


The H4 chart shows a new correctional wave to the downside after a divergence on MACD, which is heading towards 23.6% fibo at 1146.24. Later, ETHUSD may continue falling to reach 38.2%, 50.0%, and 61.8% fibo at 943.74, 778.63, and 615.08 respectively. The resistance is the new all-time high at 1476.46.
4-часовой таймфрейм Эфириума (Ethereum) демонстрирует развитие новой волны коррекционного спада после обновления последнего максимума и дивергенции. Снижение нацелено на уровень 23,6% по Фибоначчи (1146,24). Дальнейшее снижение может быть направлено к уровням 38,2% (943,74), 50,0% (7778,63) и 61,8% (615,08). Сопротивлением служит новый исторический максимум – 1476,46.


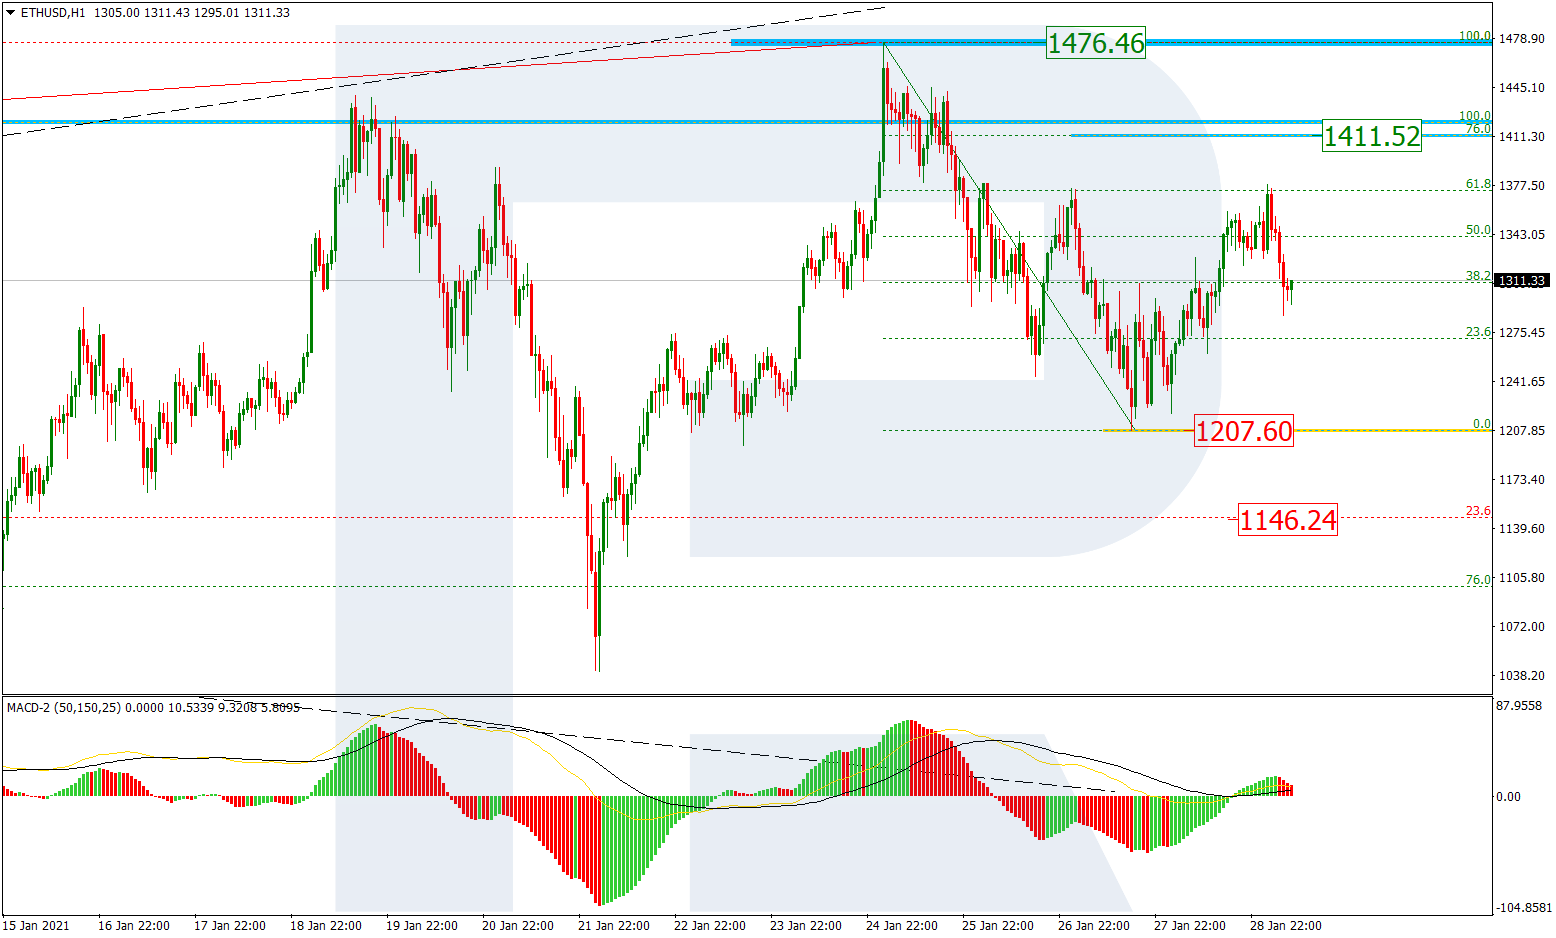
As we can see in the H1 chart, the pair is correcting after completing the descending wave and has already reached 61.8% fibo. Later, the price may continue growing towards 76.0% fibo at 1411.52. The correction may transform into a proper rising wave and update the high. A breakout of the local low at 1207.60 may hint at a further mid-term downtrend.

