Fibonacci Retracements Analysis 30.12.2020 (GBPUSD, EURJPY)
GBPUSD, “Great Britain Pound vs US Dollar”
As we can see in the H4 chart, a divergence on MACD made the pair stop its ascending movement after a test of the high at 1.3624. possibly, the pair may start a new decline towards 50.0%, 61.8%, and 76.0% fibo at 1.3150, 1.3037, and 1.2904 respectively. However, if the asset does break the high, the price will continue growing to reach the long-term 61.8% fibo at 1.3664 and then enter the post-correctional extension area between 138.2% and 161.8% fibo at 1.3790 and 1.3980 respectively.


In the H1 chart, after testing the high, the pair is correcting downwards and has already reached 61.8% fibo. Later, the asset may grow to break the high and then continue moving towards the local post-correctional extension area between 138.2% and 161.8% fibo at 1.3790 and 1.3892 respectively. On the other hand, a breakout of the local support at 1.3188 will lead to further mid-term correction.


EURJPY, “Euro vs. Japanese Yen”
In the H4 chart, after re-testing the high at 127.01, EURJPY is forming a divergence on MACD, which may hint at a new decline. However, after finishing the pullback, the pair is expected to resume growing to break the high and reach the mid-term 61.8% fibo at 128.65, as well as the post-correctional extension area between 138.2% and 161.8% fibo at 129.16 and 130.40 respectively.


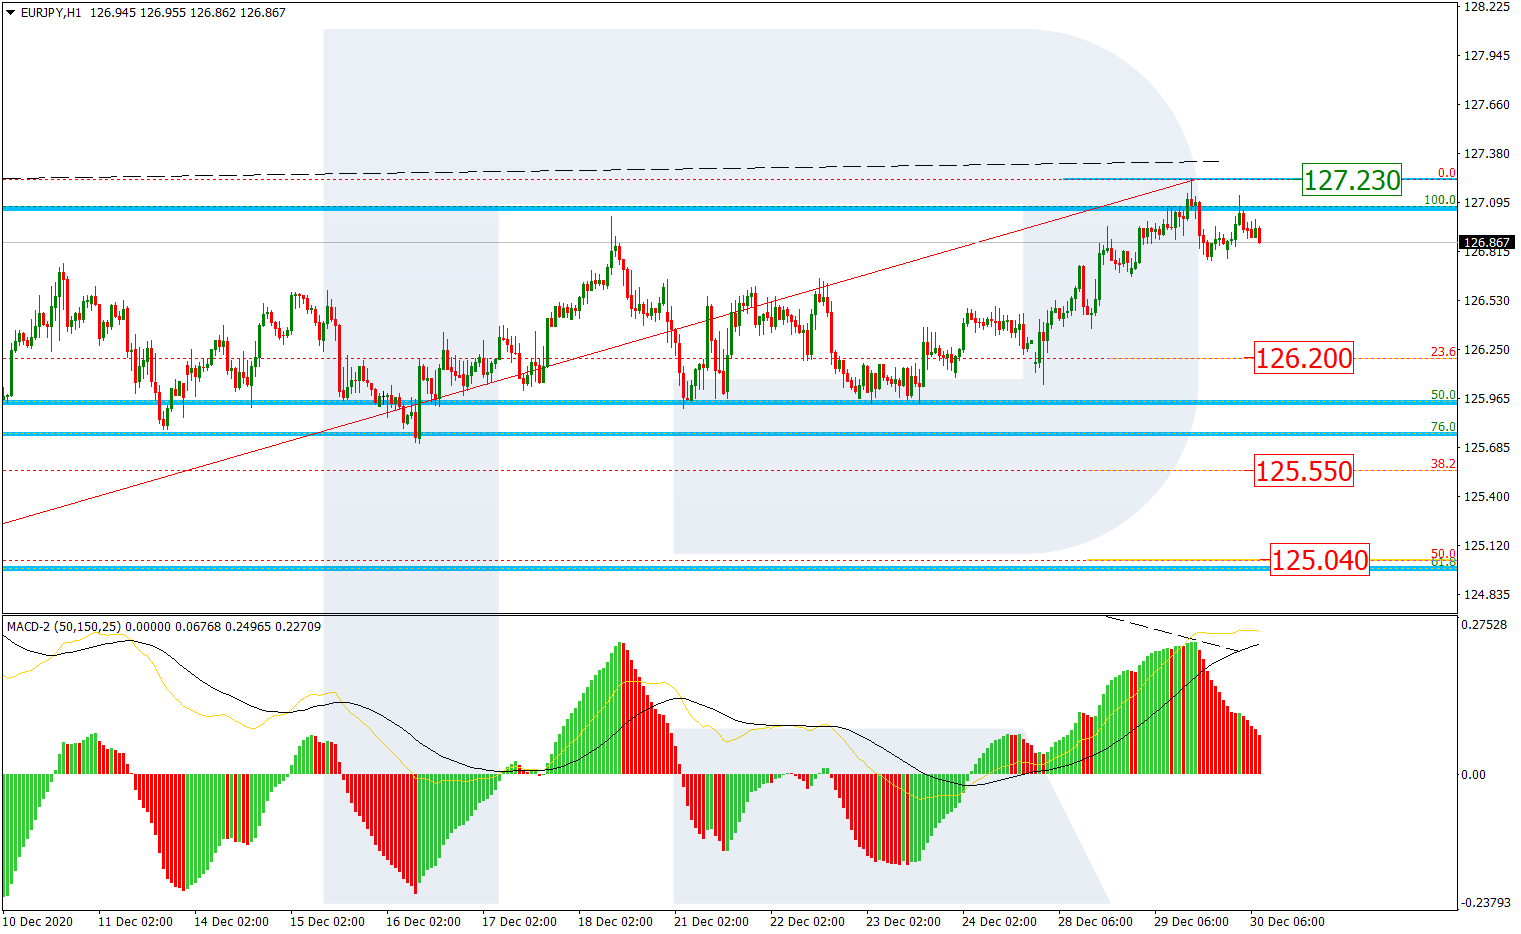
The H1 chart shows potential correctional targets after a divergence on MACD. The key targets may be 23.6%, 38.2%, and 50.0% fibo at 126.20, 125.55, and 125.04 respectively. A breakout of the local high at 127.23 will hint at further uptrend.


