GBPUSD steps to a new session low
The GBPUSD has stepped to a new session low. As it does the technical picture points lower.

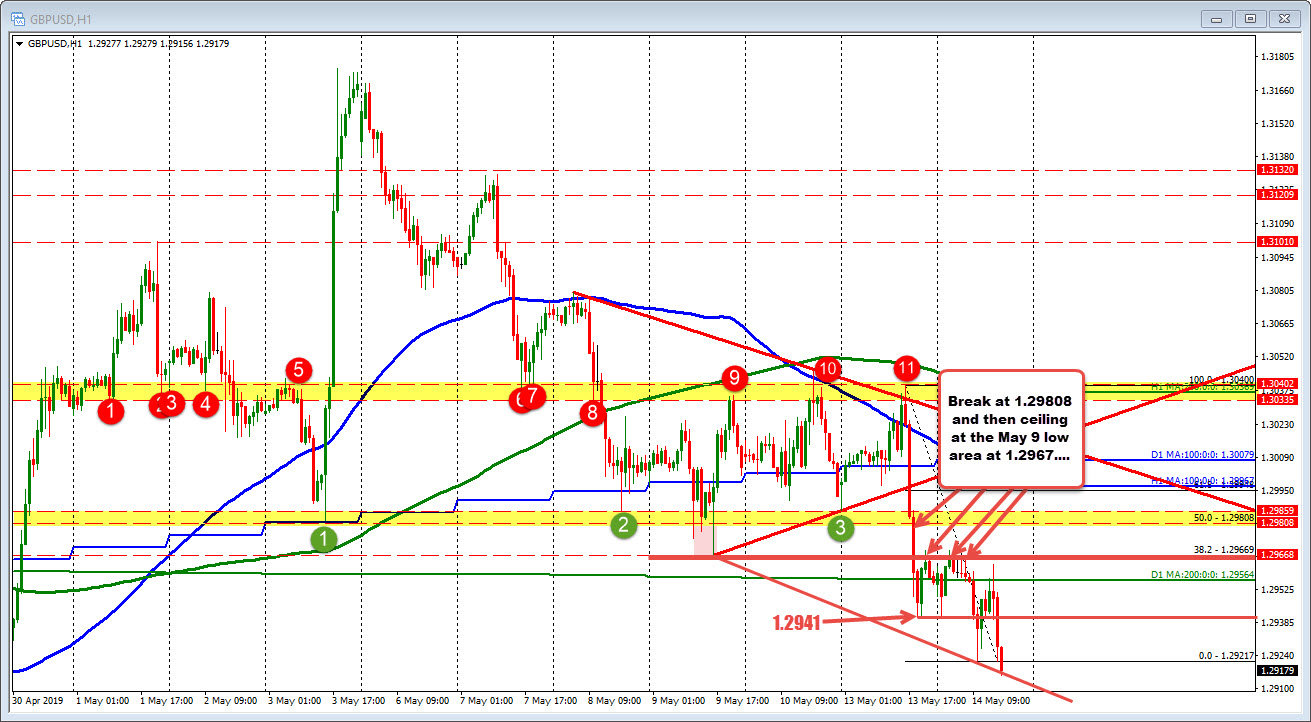
Looking at the hourly chart the pair has been stepping lower. It all started at the high yesterday which stalled at a well defined swing area (ceiling). It continued through a floor area at the 1.29808 area, and then the lows from last week at 1.29669 area. Today the highs, took small peeks above the 1.29669 to 1.12970, but that’s it. PS. the price is also moving away from the 200 day MA at 1.29564 (although price action was above and below earlier). The sellers remain in control.
Now there is also ups and down today, and as mentioned, traders toyed above and below the 200 day MA. That is a problem, but can be explained away as “the market trying to decide what’s next”. That “next’ is to new lows and moving away. Risk can be that 200 day MA. A closer risk might be the low from yesterday at 1.2941.
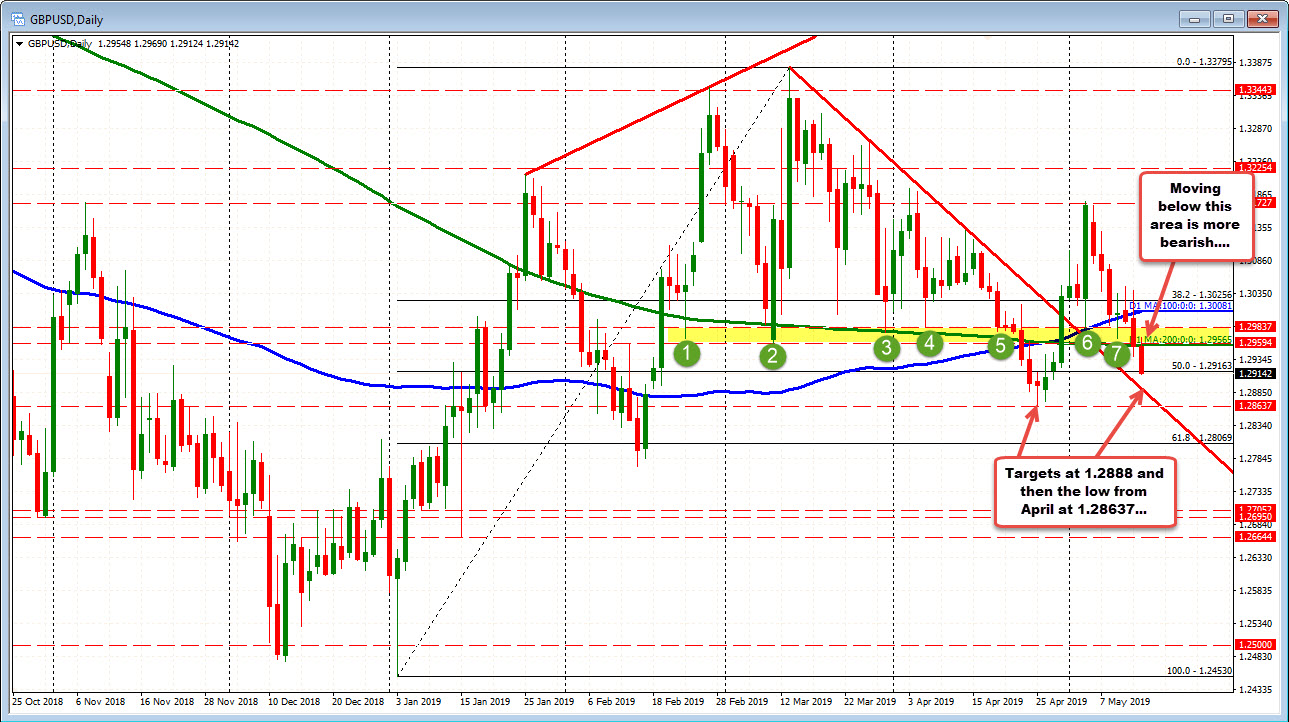
Looking at the daily chart below, the pair is moving away from its 100 day MA (blue line) and the 200 day MA (green line). The 50% of the move up from the Jan 3 Flash Crash low, is at 1.29163 area. On more downside, the 1.2888 and 1.28637 are downside targets (see chart below). Move below the 1.28637 and The 1.2800-060 area becomes the next target.
