Japanese Candlesticks Analysis 16.03.2020 (GOLD, NZDUSD, GBPUSD)
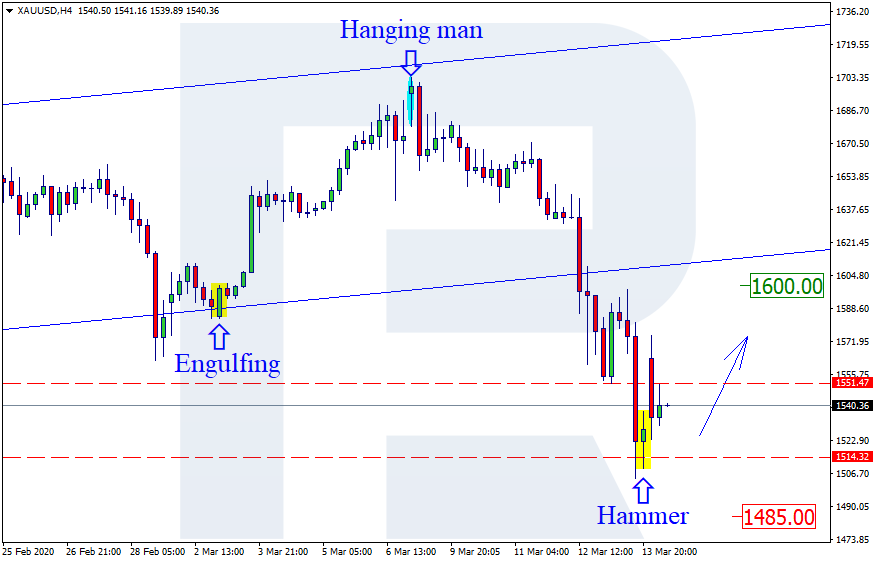
XAUUSD, “Gold vs US Dollar”
As we can see in the H4 chart, after falling and forming several reversal patterns, such as Hammer, Gold is testing the support level. Possibly, the pair may reverse and reach 1600.00. However, one shouldn’t ignore another scenario, according to which the instrument may continue falling towards the target at 1485.00.

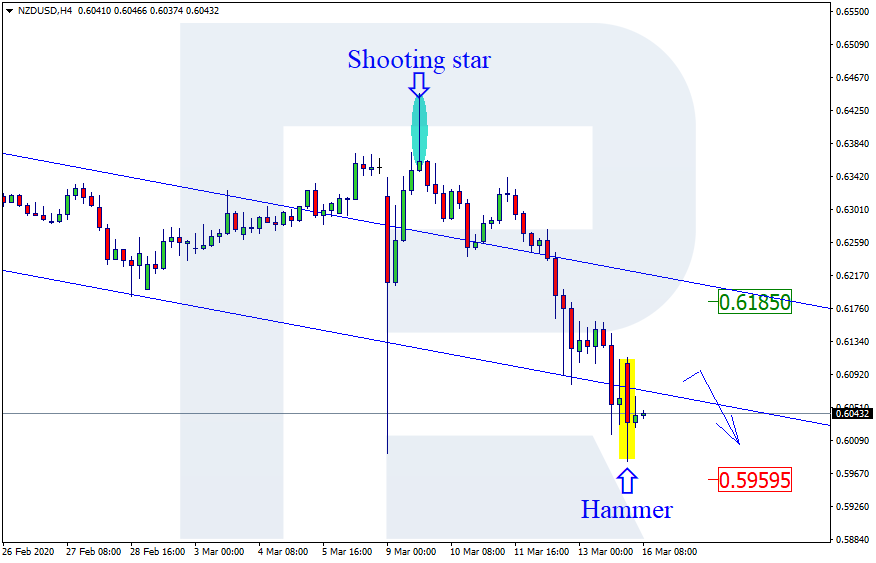
NZDUSD, “New Zealand vs. US Dollar”
As we can see in the H4 chart, after breaking the descending channel’s downside border and forming a Hammer reversal pattern, NZDUSD is expected to reverse and get back into the channel. In this case, the target may be at 0.6185. Later, the price may resume trading downwards. At the same time, one shouldn’t exclude an opposite scenario, according to which the instrument may fall towards 0.5959 without forming any serious corrections.
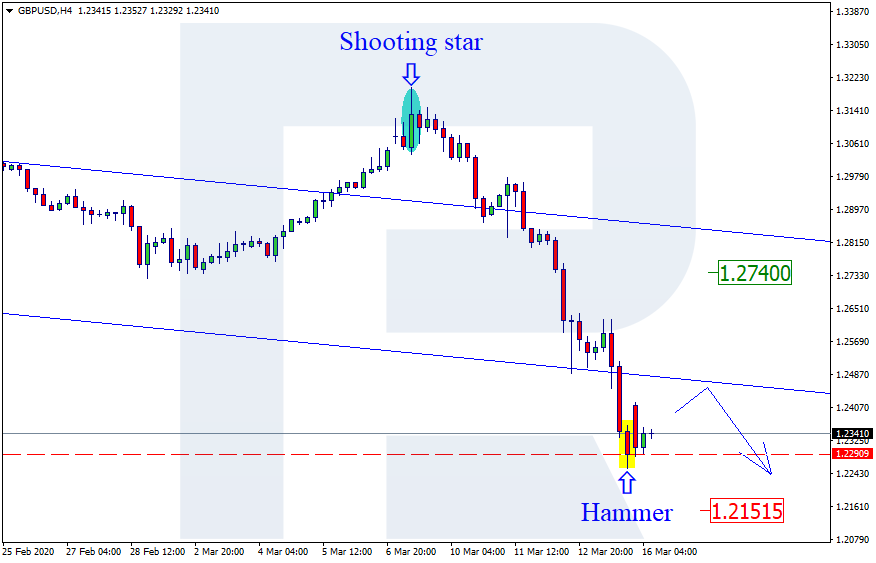
GBPUSD, “Great Britain Pound vs US Dollar”
As we can see in the H4 chart, the pair is no longer trading inside the descending channel. By now, GBPUSD has formed a Hammer reversal pattern not far from the support level. Possibly, the pair may reverse and get back into the channel; in this case, the target will be at 1.2740. Later, the market may continue the descending tendency. However, there is another scenario, which implies that the instrument may fall towards 1.2151 without reversing and forming any rising structures.