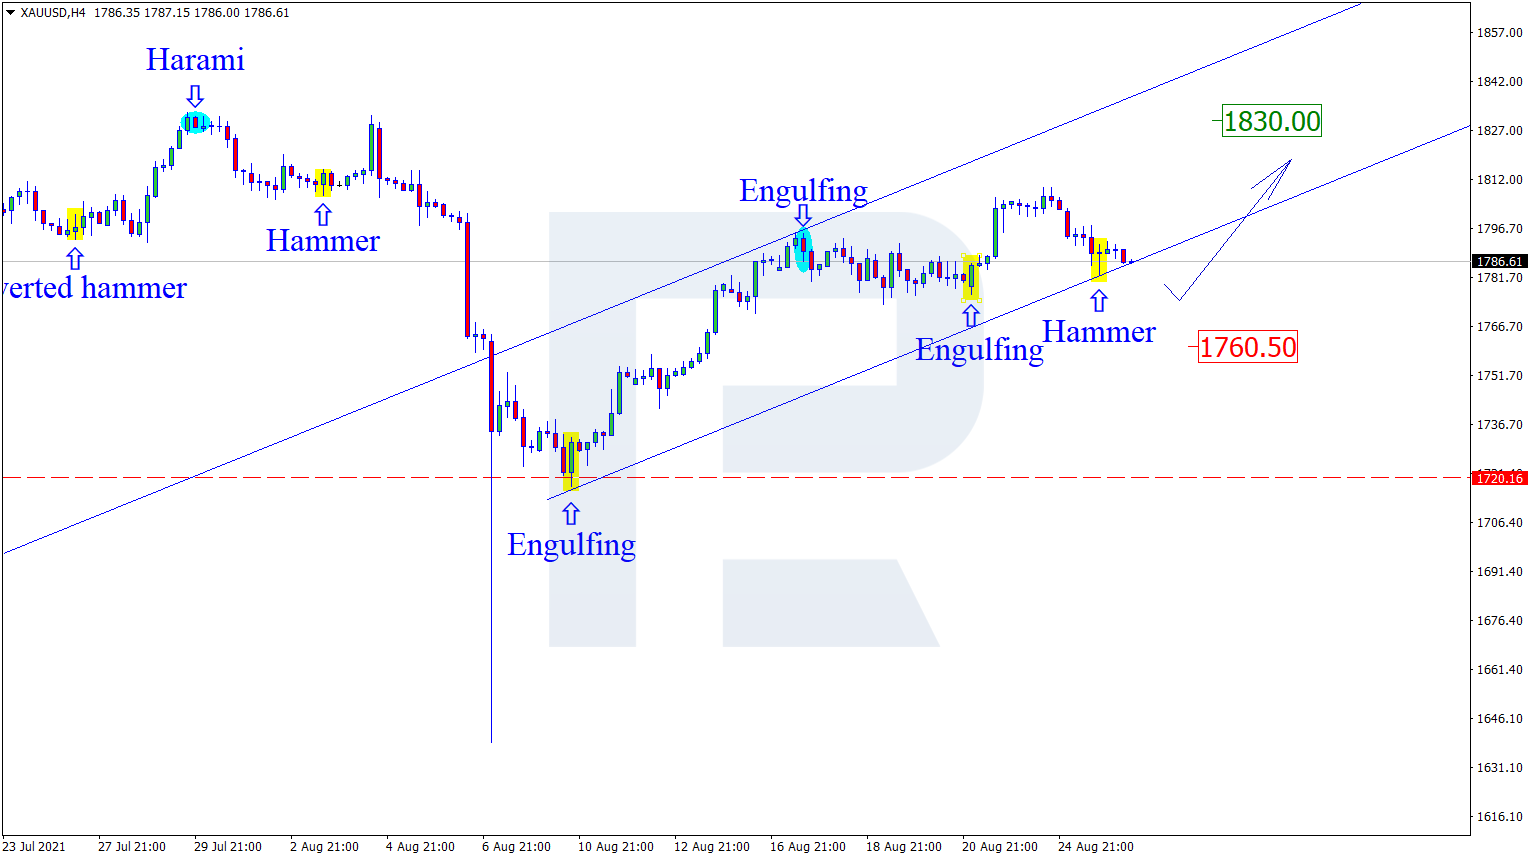
XAUUSD, “Gold vs US Dollar”
As we can see in the H4 chart, the correction within the uptrend continues. After forming several reversal patterns, such as Hammer, not far from the support level, XAUUSD may reverse and start a new growth to reach the resistance area at 1830.00. At the same time, an opposite scenario implies that the price may continue falling towards 1760.50 before resuming its ascending tendency.

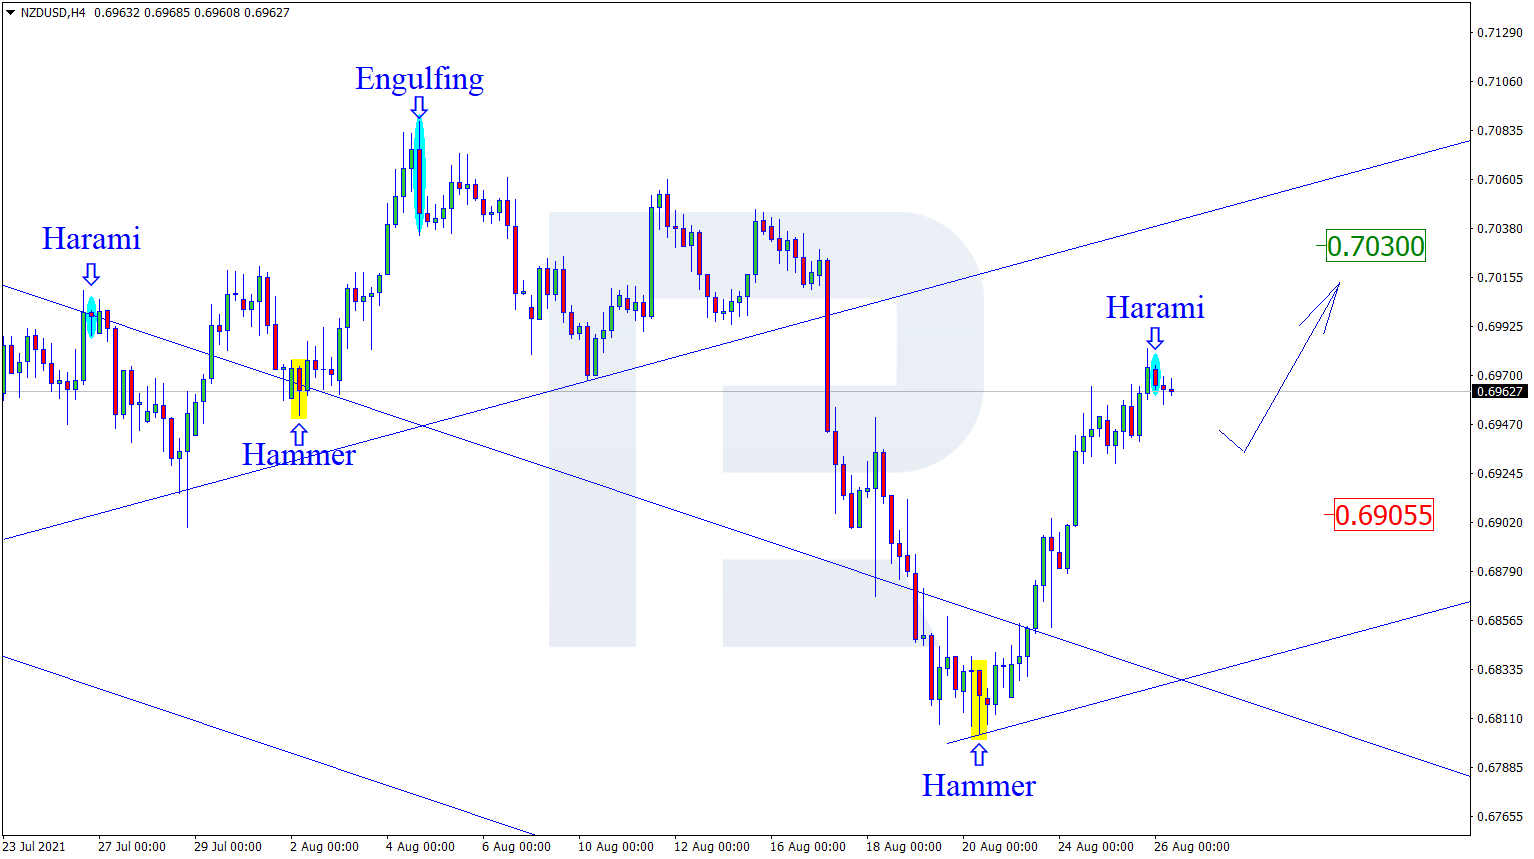
NZDUSD, “New Zealand vs US Dollar”
As we can see in the H4 chart, after testing the resistance area, NZDUSD has formed several reversal patterns, such as Harami. At the moment, the asset may reverse in the form of a new pullback. In this case, the correctional target may be the support level at 0.6905. After testing this level, the asset may rebound from it and continue moving upwards. However, an alternative scenario implies that the price may grow to reach 0.7035 without correcting towards the support level.
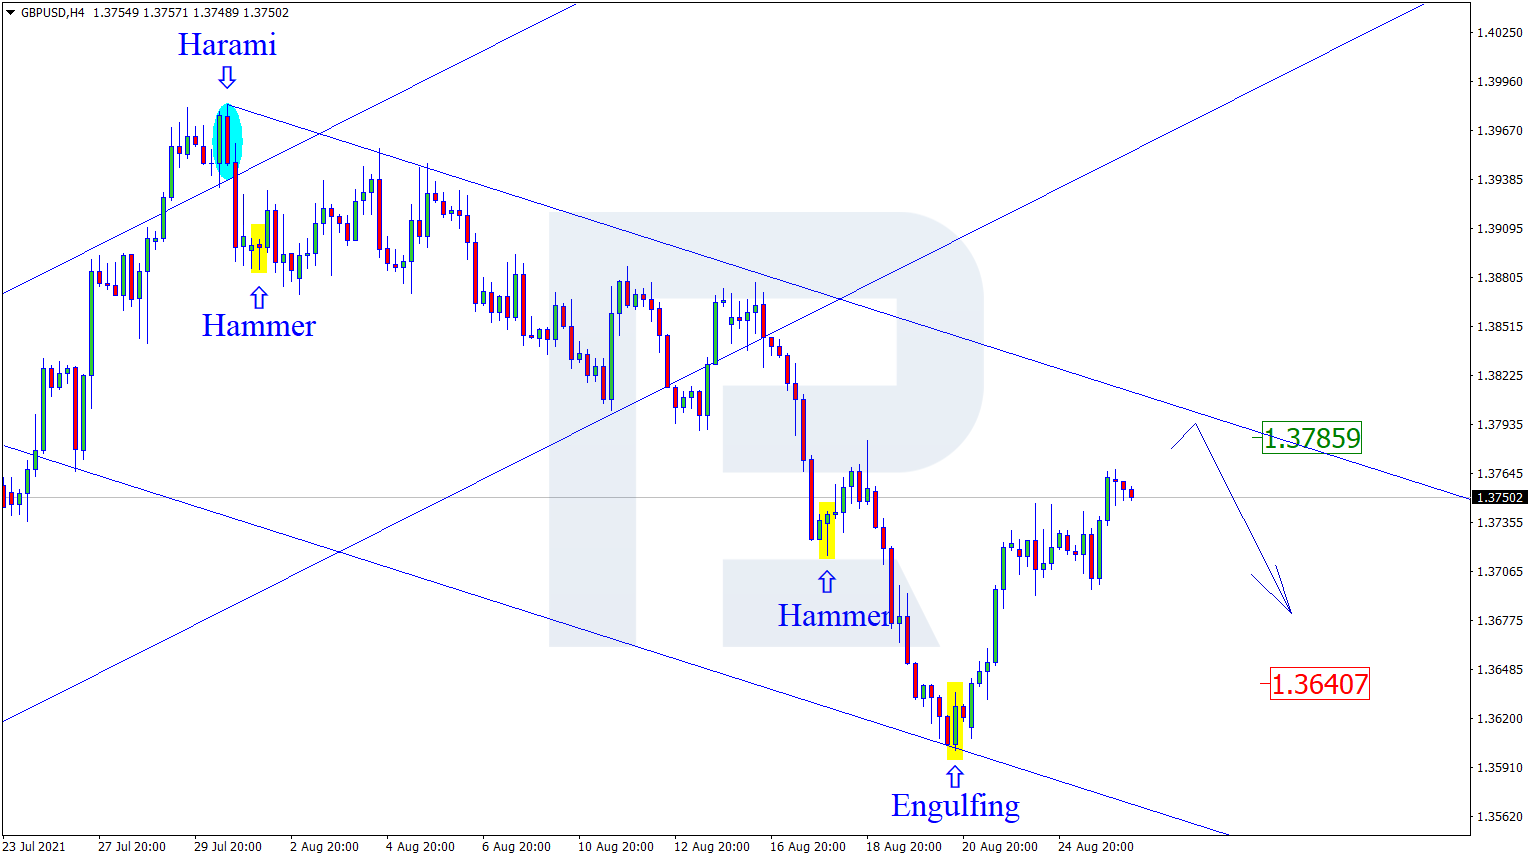
GBPUSD, “Great Britain Pound vs US Dollar”
As we can see in the H4 chart, the asset is still forming another correctional wave. By now, GBPUSD has formed several reversal patterns, such as Hammer and Engulfing, not far from the support level. At the moment, the pair is reversing and starting a new growth. In this case, the upside target may be the channel’s upside border at 1.3785. After testing this level, the market may rebound from it and resume falling. Still, there might be an alternative scenario, according to which the asset may fall towards the next support area at 1.3640 without testing the resistance area.