USDJPY, “US Dollar vs. Japanese Yen”
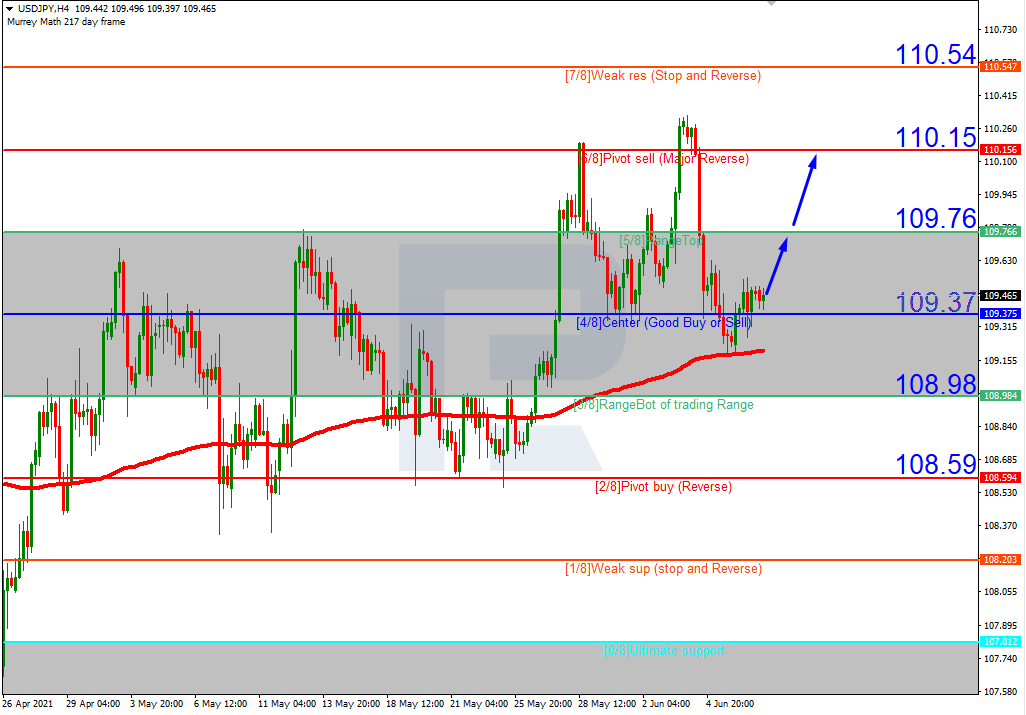
As we can see in the H4 chart, USDJPY is trading above the 200-day Moving Average, thus indicating an ascending tendency. In this case, the price is expected to rebound from 4/8 and then resume growing to reach the resistance at 6/8. However, this scenario may no longer be valid if the price breaks 4/8 to the downside. After that, the instrument may reverse and fall towards the support at 2/8.

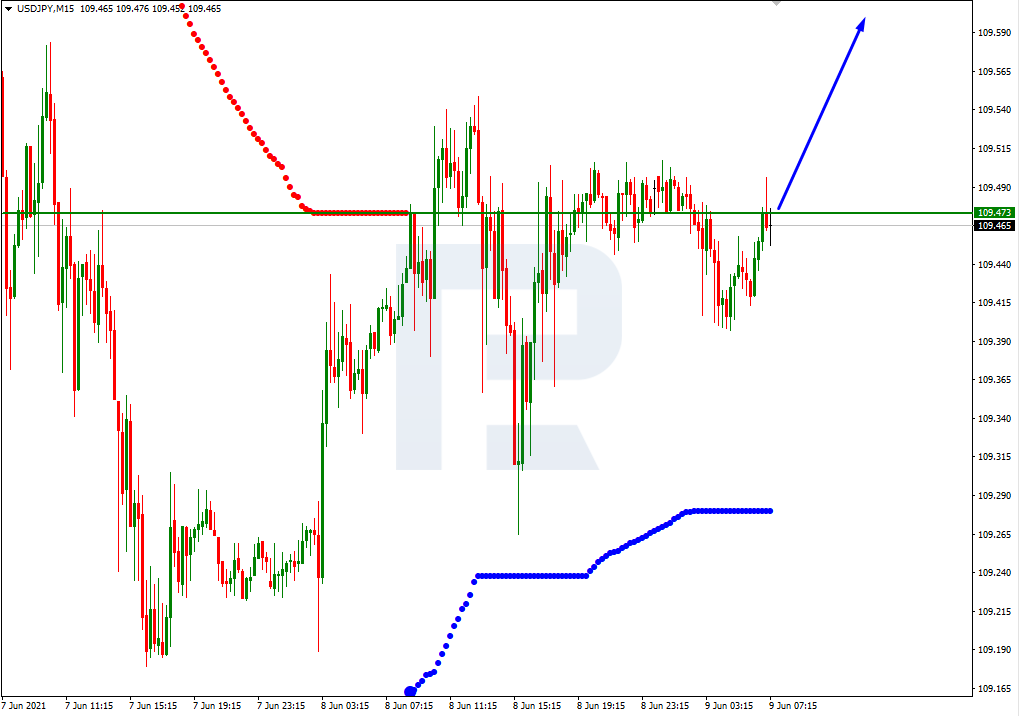
In the M15 chart, the pair may break the upside line of the VoltyChannel indicator and, as a result, continue the ascending tendency.
USDCAD, “US Dollar vs Canadian Dollar”
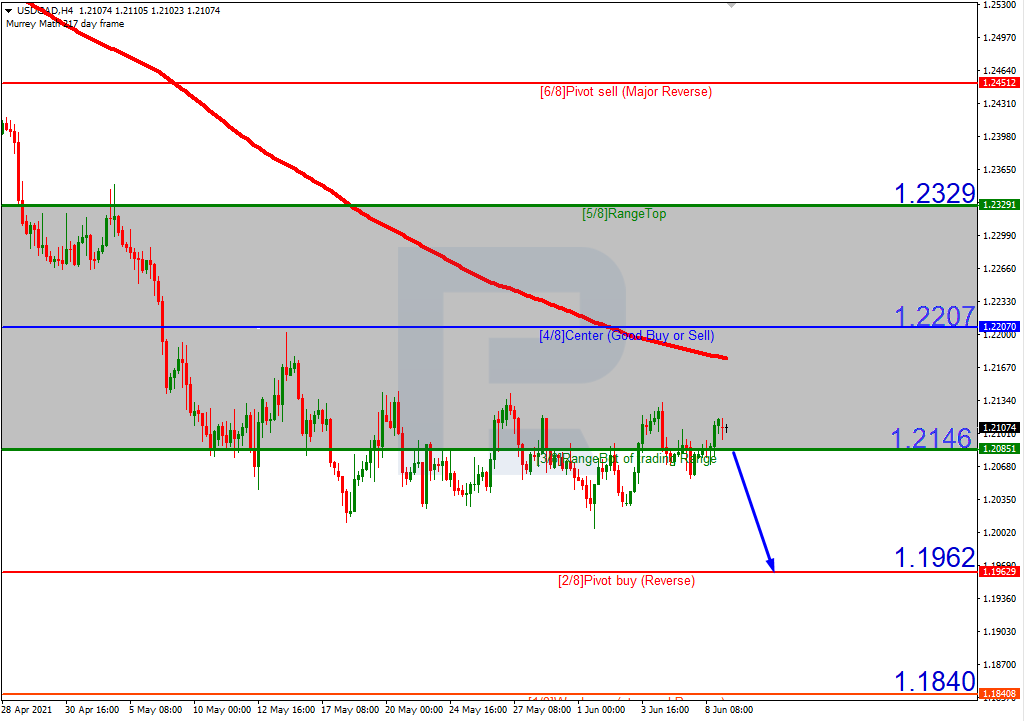
As we can see in the H4 chart, USDCAD continues trading downwards. In this case, the price is expected to break 3/8 and then continue falling towards the closest support at 2/8. Still, this scenario may no longer be valid if the price breaks 4/8 to the upside. After that, the instrument may reverse and grow to reach the resistance at 5/8.
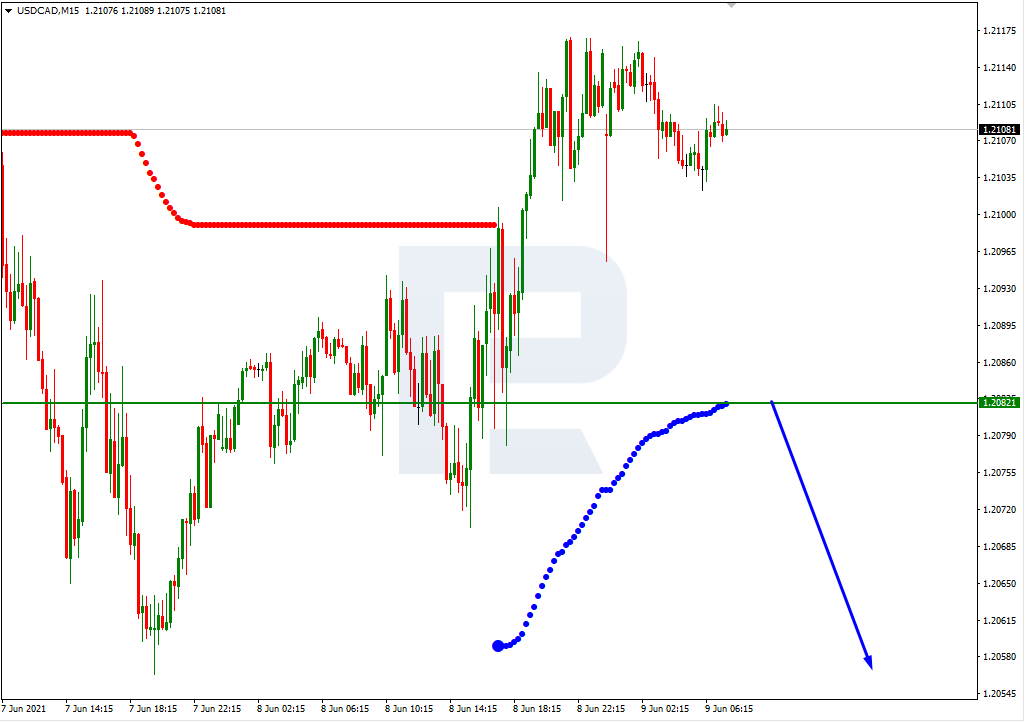
In the M15 chart, the pair may break the downside line of the VoltyChannel indicator and, as a result, continue trading downwards.