Support and Resistance Forex Monthly Strategy
Support and resistance on the monthly chart are very important technical indicators as they affect all lower timeframes. These areas on the chart usually indicate major multi-year highs or lows and the price almost certainly reacts at them on the lower timeframes.
This strategy is quite simple and based only on solid technical trading principles that the big institutions and interbank Forex traders also trade on. The classic indicators and patterns on the monthly timeframe work very well because so many people are trading by them and there is no single player that can control the market to that degree to cause fake-outs on the monthly chart. In contrast, all lower timeframes can be affected and are often manipulated in this way.
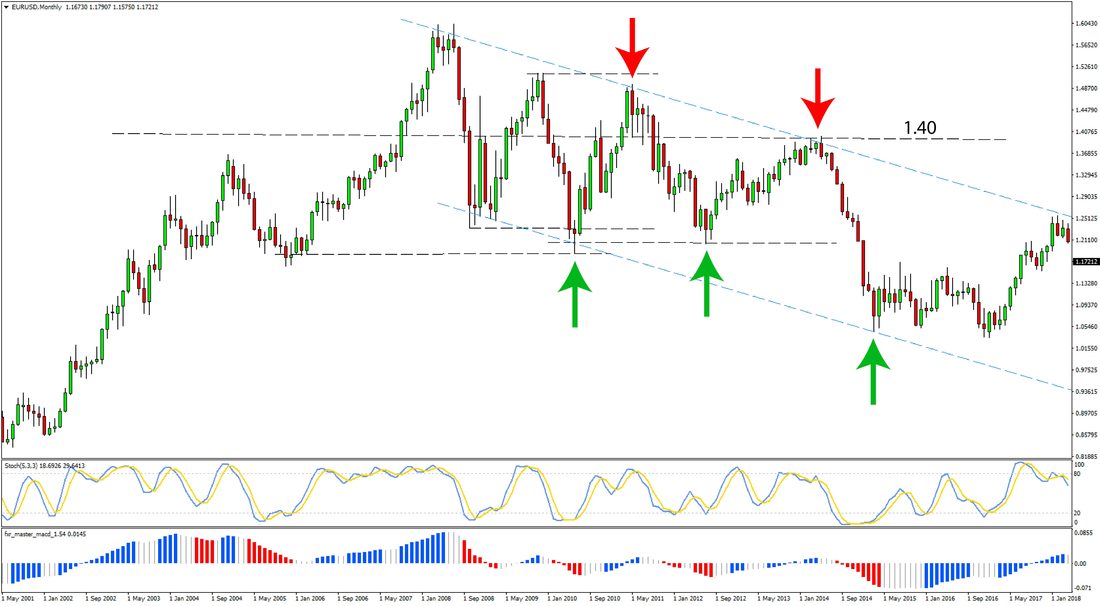
On the chart lower, we can see such trade examples on the monthly chart.

Support and Resistance Forex Monthly Strategy
Trading techniques and indicators for the strategy:
Big financial institutions and banks are trading based on these levels and indicators so high probability trades are generated. That’s why it’s important for any Forex trader to watch them and take note of any signals or patterns.
We are going to use the default MT4 Stochastic and the FxTR Master MACD indicators on the chart examples. The Master MACD can be download for free here.
Feel free to experiment with other indicators also. Only keep in mind to use a combination of a trend-showing indicator (Master MACD here) and an overbought/oversold momentum indicator (Stochastic here).
Regarding support and resistance, horizontal as well as trendline support/resistance zones are important. Also, turncoat support/resistance very often is a point of reversals and should also be watching and implemented in the strategy.
Trading conditions:
- Identify where support zones exist on the monthly chart. That includes both horizontal support due to past lows/highs but also support due to falling or rising trendlines that connect several past lows or highs.
- Look for a bullish signal to occur at the support zone. Either a bullish chart pattern or a bullish signal from the indicators.
- Place stop below the low of the bullish pattern
Long trade exit and targets:
- Place target at the next resistance higher
- Or exit when overbought levels are reached on the indicators.
Here’s an example of a long trade taken on the monthly chart:

Support and Resistance Forex Monthly Strategy
- Determine the most important resistance zones on the monthly chart
- Look for convergence of bearish signals at resistance
- Enter once the above conditions are satisfied
- Stop behind the top of the bearish pattern
Short trade exit and targets:
- Target the next support down
- An oversold signal on momentum indicators can also be a reason for an earlier exit
An example of a short trade is shown on the chart below.

Support and Resistance Forex Monthly Strategy
Keep in mind
- Trades can last for a very long time since this is a strategy that is traded on the monthly chart. Thus it should be treated as such and the trader should be prepared and equipped both with capital and patience for trading the monthly chart.
- A bigger deposit compared to trading the short-term charts will certainly be needed as stops will regularly be with a size of several hundred pips. The appropriate deposit can be calculated based on the maximum stop loss size and the position size (lots) intended to be traded.
- Following the macro fundamentals and the main drivers behind large trends in the Fx market will also be helpful when trading large timeframes such as the monthly. There are plenty of resources and articles on the Fx Trading Revolution website that can help traders to understand and trade the fundamentals.