rfxsignals October 7, 2025 No Comments

What Is Slippage and How to Avoid It

What Is Slippage and How to Avoid It

What Is Slippage and How to Avoid It — Practical Guide for Forex Traders

Reading time: ~8–10 mins • Updated:

Slippage is the difference between the expected price of a trade and the price at which it is actually executed. It is a hidden cost that eats into your returns if unchecked. This guide explains why slippage happens, how to measure it, real forex examples, and 12 practical ways to reduce or avoid slippage — especially useful for Indian traders and those trading INR pairs.

Chat on WhatsApp Join our Telegram
Want execution rules for your account?
View services

What is slippage? — the simple definition

Slippage occurs when the execution price differs from the price you saw or requested. If you place a buy order at 1.2000 and it fills at 1.2005, you experienced 0.5 pip (or 0.0005) of slippage. Slippage can be negative (you receive a worse price) or positive (you get a better price).

Why slippage happens — core causes

  • Market volatility: fast moves during news events or open/close sessions create large price swings and rapid quote changes.
  • Low liquidity: thin order books (e.g., exotic pairs or off-hours) mean large market orders move the price materially.
  • Order type: market orders execute immediately at available prices and are more prone to slippage than limit or stop-entry orders.
  • Broker execution model: some brokers aggregate liquidity poorly, have slow routing, or re-quote during high volatility.
  • Latency: delays between you clicking trade and the broker receiving it can cause the market to move.

Types of slippage — practical perspective

Consider two common scenarios:

1. Execution slippage (market fills)

Market orders fill at the best available price. If liquidity is thin beyond the best quote, the order "walks the book" and fills at worse successive prices.

2. Re-quote/failed fill slippage

Some brokers detect price movement and either re-quote for your approval or reject the trade, effectively causing opportunity cost or forcing a worse price.

How to measure slippage (simple metrics)

Two useful numbers to track:

  • Average slippage per trade: sum(all executed price - requested price) / number of trades.
  • Slippage as % of average spread: helps you see whether slippage is small relative to transaction cost.

Keep a spreadsheet tracking time, pair, order type, requested price, executed price, spread at execution, and remarks.

Real forex examples (illustrative)

- You place a market buy on EUR/USD at 1.0800; during a news spike the best available prices become 1.0802 and 1.0807, your order partially fills at those prices — slippage = up to 0.7 pip.
- You place a large market sell on USD/INR during thin India session and the order eats multiple liquidity layers — slippage can be several paisa per unit.

12 practical ways to avoid or reduce slippage

  1. Prefer limit orders for entry when possible. Limiting execution price prevents negative slippage (but may miss the trade).
  2. Use stop-entry orders rather than market orders for breakout trades. They convert to market only once price reaches your trigger but can still slip — combine with reasonable buffer.
  3. Avoid trading during major news unless you have a tested plan. Spikes widen spreads and increase slippage risk.
  4. Trade liquid pairs during main session overlaps. EUR/USD, GBP/USD and USD/JPY have deepest liquidity and lowest slippage.
  5. Reduce order size in thin markets. Break big trades into smaller child orders to avoid walking the book.
  6. Choose brokers with good execution and transparent slippage stats. Ask for execution reports and ECN/STP routing options.
  7. Use brokers with negative slippage policies or guaranteed stop loss if required. Note this may cost in commissions/premiums.
  8. Use proper position sizing and limit risk per trade. If a trade can gap, small size limits absolute loss from slippage.
  9. Pre-check average spread and liquidity at your intended trade time. If spread is wide, skip or reduce size.
  10. Automate execution where possible and reduce human latency. Algos or VPS near broker servers reduce delay.
  11. Test and measure slippage in a demo/live environment. Log fills and compare expected vs executed prices.
  12. Avoid exotic or illiquid crosses unless you understand their cost profile. INR exotics may carry bigger hidden execution costs.

Broker selection checklist (execution focused)

  • Ask for historical execution reports or slippage statistics.
  • Prefer regulated brokers with ECN/STP pools and competitive pricing.
  • Confirm order types supported (guaranteed SL, limit, stop-entry, OCO).
  • Check server/VPS proximity and average round-trip time if you scalp.

Technology & platform tips

For high-frequency or scalping strategies minimize latency: use a VPS, lower-latency internet, and a broker with fast routing. Avoid platforms that freeze or re-quote during high volatility.

Post-trade review — how to get better

Each week review your slippage log: which pairs, session times, order types and brokers produced worse fills? Use that data to adjust rules — maybe stop trading certain pairs in certain hours or switch to limit-only entries.

SEO-friendly internal & external linking strategy

Link this post to related site content and trustworthy external sources:

Final takeaway & quick execution checklist

  1. Prefer limit orders & trade liquid pairs during main sessions.
  2. Reduce size in thin markets and avoid headline spikes unless planned.
  3. Choose brokers with transparent execution and log fills to measure slippage.
#forex#slippage#execution#tradingtips
rfxsignals October 3, 2025 No Comments

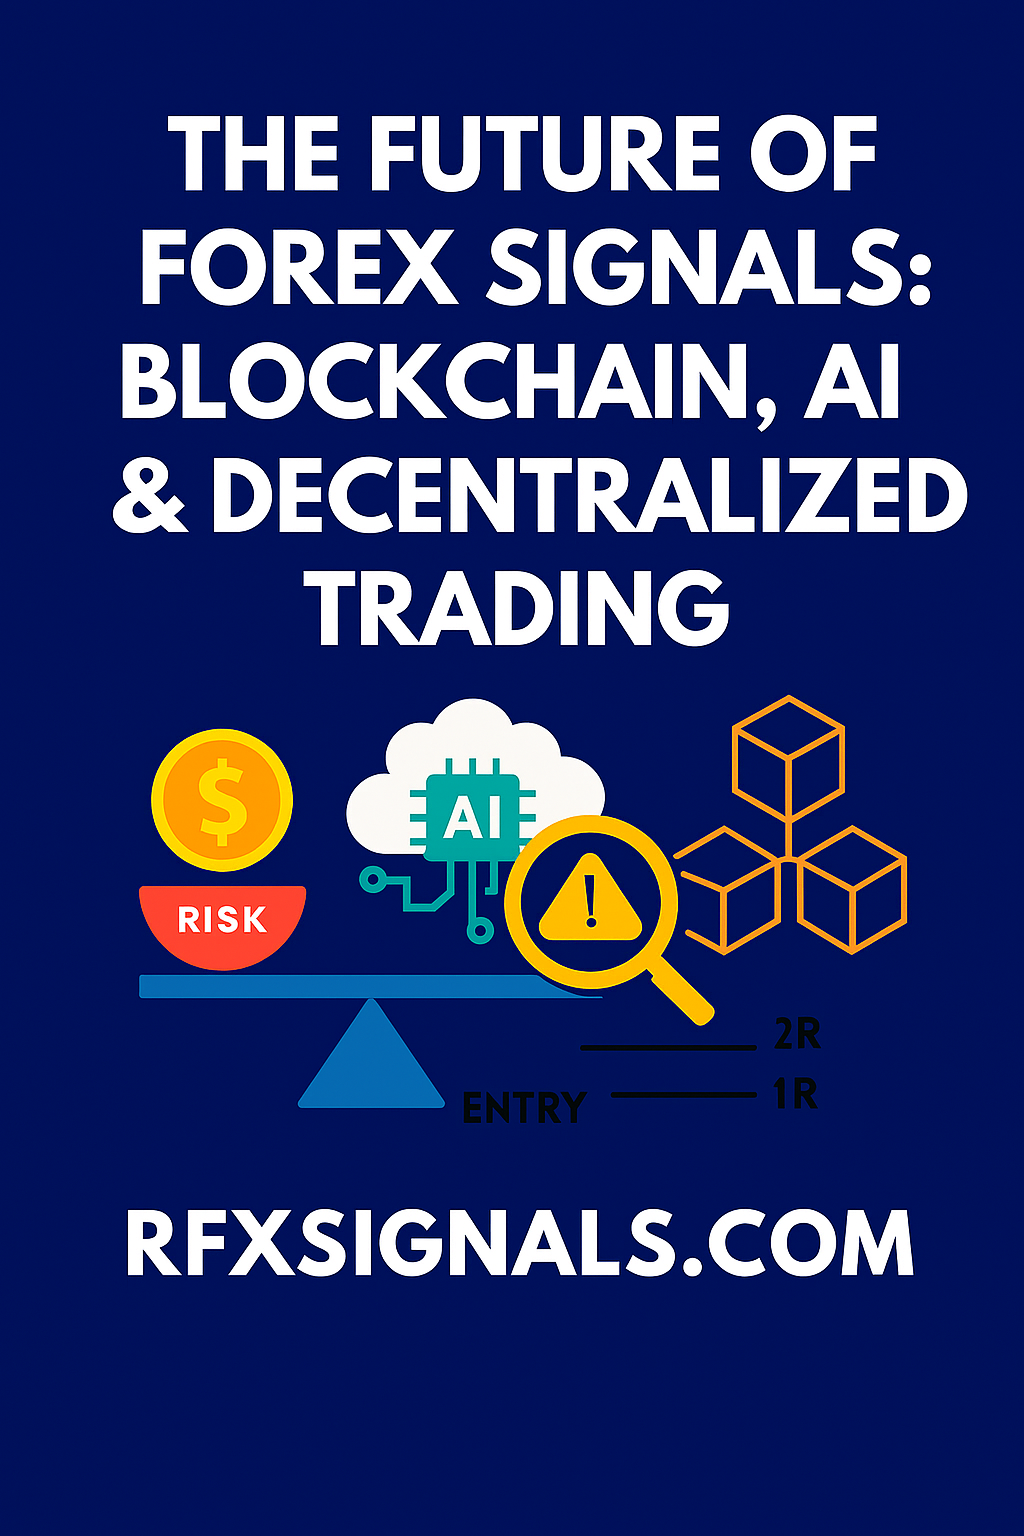
The Future of Forex Signals: Blockchain, AI & Decentralized Trading

The Future of Forex Signals: Blockchain, AI & Decentralized Trading

The Future of Forex Signals: Blockchain, AI & Decentralized Trading

The Forex trading world is evolving at a rapid pace. With the integration of Blockchain, Artificial Intelligence (AI), and Decentralized Trading platforms, the future of Forex signals looks more transparent, efficient, and profitable. In this guide, we will explore how these technologies are reshaping Forex trading and what traders can expect in the coming years.

1. Introduction to Forex Signals and Their Evolution

Forex signals have traditionally been generated by expert traders or trading software to guide others on when to buy or sell a currency pair. However, as markets become more complex and volatile, the demand for reliable, real-time, and transparent signals has grown significantly. This is where Blockchain, AI, and decentralized ecosystems come in to transform the industry.

2. The Role of Blockchain in Forex Signals

Blockchain technology ensures transparency and trust in Forex signals. By storing trade recommendations and results on an immutable ledger, traders can verify performance without manipulation.

  • Transparency: Every signal is recorded permanently.
  • Trustless environment: No middleman needed.
  • Fraud prevention: Impossible to alter past results.

3. Artificial Intelligence and Machine Learning in Forex

AI-powered algorithms analyze vast amounts of market data, detect hidden patterns, and predict potential outcomes. AI enhances the accuracy of signals by factoring in:

  • Market sentiment analysis
  • Historical price patterns
  • Volatility modeling
  • Risk-to-reward optimization

Machine learning allows systems to continuously learn and improve signal accuracy over time, making them far superior to traditional methods.

4. Decentralized Trading Platforms (DeFi in Forex)

Decentralized platforms eliminate intermediaries and give traders direct control of their funds and trades. These systems also allow peer-to-peer sharing of signals, ensuring:

  • Lower trading costs
  • Global accessibility
  • Greater security of funds
  • Democratization of trading signals

5. Benefits of Future Forex Signal Systems

The combination of Blockchain, AI, and decentralized platforms creates powerful advantages:

  • Transparency: No fake results.
  • Accuracy: AI-driven predictions.
  • Security: Decentralized data and funds.
  • Accessibility: Open to traders worldwide.

6. Challenges in Adopting These Technologies

Despite the potential, there are obstacles:

  • High cost of AI infrastructure
  • Regulatory uncertainties in decentralized systems
  • Technical knowledge required for adoption

7. The Road Ahead for Forex Traders

The future will likely see hybrid models where AI-driven signals are stored on blockchain ledgers and executed through decentralized platforms. This will give traders confidence, efficiency, and security.

🚀 Ready to Trade Smarter?

Join our community to access AI-powered, blockchain-backed Forex signals and trade with confidence.

Connect on WhatsApp Join on Telegram

© 2025 YourForexSite.com | All Rights Reserved.

rfxsignals September 29, 2025 No Comments

AI-Powered Forex Signals: Are Robots Beating Human Traders?

AI-Powered Forex Signals: Are Robots Beating Human Traders?
AI-Powered Forex Signals: Are Robots Beating Human Traders? | RFXSIGNALS

AI-Powered Forex Signals: Are Robots Beating Human Traders?

Machine learning and algorithmic systems now deliver forex signals every second — but are they consistently better than humans? This guide compares performance, explains how AI signals work, highlights pitfalls, and shows how to combine automated and human approaches for practical edge.

Short answer: sometimes — but context matters

AI systems can outperform humans in narrowly defined tasks: pattern recognition across massive datasets, fast execution, and constant operation without fatigue. Yet, "beating human traders" depends on what you measure. Over many instruments and long periods, well-designed AI can show superior risk-adjusted returns. In other cases — especially where markets shift structurally — human judgment and adaptation still matter.

How AI-powered forex signals work (in simple terms)

Most AI signals are generated by models trained on historical price data, technical indicators, order-flow features, macro inputs, and sometimes alternative data (news sentiment, economic calendars). Common model types include supervised learning classifiers, ensemble methods, LSTM/transformer-based sequence models, and reinforcement learning agents that try to maximize simulated returns.

Typical pipeline

  1. Data collection: ticks, minute/hour bars, fundamental and alternative data
  2. Feature engineering: indicators, lagged returns, volatility, seasonality flags
  3. Model training: cross-validation, hyperparameter search
  4. Backtesting & walk-forward validation
  5. Deployment: signal generation, risk management overlays, trade execution

Where AI has clear advantages

AI excels at:

  • Processing scale — scanning hundreds of pairs and timeframes simultaneously.
  • Pattern detection — finding non-linear relationships humans can miss.
  • Speed — executing strategies in milliseconds when intraday edge exists.
  • Consistency — no emotional mistakes or fatigue; rules are applied uniformly.

Where humans still win

Humans add value when:

  • Context matters — macro regime shifts, central bank interventions, or sudden liquidity changes.
  • Interpretability — understanding why a model signals a trade is crucial for risk management.
  • Edge adaptation — skilled traders can adapt quickly to new market regimes or news-driven events.

Common pitfalls with AI signals

Many AI-driven services overpromise. Common failure modes include:

  • Overfitting — models that memorize historical quirks without true predictive power.
  • Data snooping — testing many strategies without rigorous out-of-sample validation.
  • Survivorship bias — using filtered datasets that remove failed instruments.
  • Execution slippage — ignoring spreads, latency, and market impact in backtests.

How to evaluate whether an AI signal provider is legit

Don’t judge by flashy returns alone. Ask for transparent metrics and proofs:

  • Verified live track records (not only backtests).
  • Detailed performance metrics: expectancy, profit factor, max drawdown, Sharpe ratio.
  • Sample size: number of trades matters for statistical validity.
  • How they handle slippage, spreads, and commissions in reporting.
  • Access to raw signals or an API for independent testing — or a sandbox to forward-test.

Real-world performance: AI vs human — a blended view

Research and industry experience show mixed results. In highly liquid FX major pairs and short timeframes, algorithmic systems can outperform many discretionary traders due to latency and pattern recognition. But long-term macro trades, discretionary news plays, and adaptive risk management often still favor experienced humans or hybrid teams (humans + AI).

Case for hybrid systems

Instead of "AI vs humans", many successful shops use a hybrid approach: AI for signal generation and filtering, humans for regime assessment, oversight, and strategic adjustments. This combination reduces false positives, manages unexpected events, and allows adaptive rule updates.

How RFXSIGNALS uses automation & human oversight (recommended approach)

At RFXSIGNALS we recommend a layered approach:

  1. Algorithmic generation of candidate signals.
  2. Automated risk filters (max exposure, pair correlations).
  3. Human review for macro-critical events or low-confidence signals.
  4. Continuous monitoring and walk-forward re-validation.
Pro tip: Use confidence bands or model-probabilities. Publish only high-confidence signals to subscribers and archive the rest for model training.

Practical checklist before subscribing to AI signals

  1. Request a sample of raw signals and backtest code or allow you to forward-test on a demo account.
  2. Confirm how orders are executed — manual, semi-automated, or fully automated.
  3. Ask about model refresh cadence and how they respond to black-swan events.
  4. Check fee structure: fixed subscription vs performance fees vs hidden costs.

Ethics, transparency, and expectations

Honest providers disclose limitations and the statistical nature of signals. Avoid services promising guaranteed monthly returns or "set-and-forget" autopilot schemes. Responsible signal providers publish drawdown scenarios, sample sizes, and clear terms for using the signals.

Conclusion — Are robots beating humans?

Short answer: sometimes, in narrow, well-defined tasks. Long answer: the best outcomes usually come from combining strengths — machine speed and pattern detection with human context and oversight. If you want reliable signals, insist on transparency, test independently, and use strict risk management.

Related posts (internal & outbound link opportunities)

Next steps — try a demo & validate

Before committing real capital, forward-test any AI signals on a demo account for a few weeks and check live slippage against the provider’s reported fills. If you'd like, we offer sample signals and a 14-day demo — join our community below.

Published: Reading time: ~8–10 min Tags: AI, forex-signals, algorithmic-trading, RFXSIGNALS
rfxsignals September 19, 2025 No Comments

What is Technical Analysis in Forex?

What is Technical Analysis in Forex?
What is Technical Analysis in Forex? | RFXSignals

What is Technical Analysis in Forex?

By RFXSignals — Updated:

Technical analysis is the study of market price, volume, and historical data to forecast future price movements. In forex, where currencies trade 24/5, technical analysis helps traders identify trends, key price levels, and high-probability setups. This guide covers core concepts, practical techniques, risk management, and SEO & link-building strategies to promote this resource and drive traffic to rfxsignals.com.

Why Technical Analysis Works in Forex

Technical analysis is based on three assumptions: price discounts everything, prices move in trends, and history tends to repeat itself. Forex markets are largely driven by sentiment, macro events, liquidity flows, and institutional order flow — all of which are reflected in price. Studying charts allows traders to interpret market psychology visually and make probabilistic decisions.

Chart Types & Timeframes

Common chart types used in forex:

  • Line charts: Simple close-price line for quick trend identification.
  • Bar charts: Show open/high/low/close (OHLC) useful for intraday trading.
  • Candlestick charts: The most popular—candles visualise momentum and reversal patterns.

Timeframes range from ticks and minutes for scalpers to daily and weekly charts for swing traders. A multi-timeframe approach (e.g., higher timeframe trend + lower timeframe entries) is a best practice.

Support & Resistance

Support and resistance are horizontal or sloped levels where price has historically paused or reversed. Traders use them to place entries, stops, and take-profits. Validating levels with volume, previous price action, and confluence (e.g., moving averages or Fibonacci levels) improves reliability.

Indicators & Oscillators

Indicators are mathematical calculations applied to price. Popular categories:

  • Trend indicators: Moving Averages (SMA, EMA), MACD.
  • Momentum indicators: RSI, Stochastic — help spot overbought/oversold conditions.
  • Volatility indicators: Bollinger Bands, ATR — useful for sizing and stop placement.

Indicators are tools, not signals on their own. Combine them with price action for higher-probability setups.

Price Action & Chart Patterns

Price action trading focuses on raw price without heavy reliance on indicators. Key patterns include:

  • Trendlines & channels
  • Head and Shoulders, Double Tops/Bottoms
  • Triangles (symmetrical, ascending, descending)
  • Candlestick reversals (pin bars, engulfing candles)

Pattern recognition + context (trend, support/resistance) produces cleaner entries.

Developing a Technical Strategy

Building a durable strategy requires rules and repeatability. Steps:

  1. Choose timeframe and instruments (e.g., EUR/USD daily swings).
  2. Define entry criteria (e.g., pullback to EMA + bullish engulfing candle).
  3. Define exit criteria (risk-reward, trailing stop rules).
  4. Backtest over sufficient samples and market regimes.
  5. Forward-test in demo with realistic execution assumptions.

Backtesting, Demo & Live

Backtesting quantifies how a strategy performed historically. Combine backtesting with demo trading to test execution and psychology, then move to live with small capital. Include commissions, spreads, and slippage in your tests for realistic results.

Risk Management Essentials

Technical setups mean very little without risk management. Key rules:

  • Risk a small percentage per trade (commonly 0.5–2% of account equity).
  • Use stop-losses; avoid gambler’s behavior of moving stops farther after a losing trade.
  • Size position by volatility (use ATR to calculate a volatility-adjusted position size).

Common Mistakes to Avoid

  • Overfitting a strategy to past data without considering market regime changes.
  • Using too many indicators that give conflicting signals.
  • Ignoring trade management and letting winners turn into losers.

Tools & Platforms

Choose platforms that offer reliable data, charting, and backtesting. Popular options include MetaTrader 4/5, TradingView, and proprietary broker platforms. RFXSignals offers curated signals and educational material to help traders combine technical analysis with actionable setups.

SEO & On-Page Structure (what this HTML includes)

This page includes structured headings, meta tags, Open Graph data, and breadcrumb schema for search engines. To further optimize:

  • Improve page speed: compress images, use critical CSS, and leverage browser caching.
  • Optimize for featured snippets: include short definitions and lists near the top.
  • Use semantic HTML and accessible ARIA attributes where appropriate.

High-quality editorial backlinks boost authority. Consider the following tactics with careful redirect usage to preserve link equity.

Content & Outreach

  • Publish detailed guides, cheat sheets, and downloadable PDFs that other sites want to cite.
  • Guest post on finance and trading blogs, linking contextually to this guide with anchors like "technical analysis forex".
  • Participate in expert roundups and HARO to earn authoritative mentions.

Redirect Best Practices

  • Use 301 redirects for moved or consolidated content to keep link equity pointing to https://rfxsignals.com/what-is-technical-analysis-forex.
  • Avoid redirect chains (A → B → C). Keep redirects single-step and documented.
  • For campaign tracking, use query parameters on canonical landing pages (example: https://rfxsignals.com/go/tool?utm_source=partner) and ensure canonical tags are set correctly.

Internal Linking Examples

Example internal links to add on this and related pages:

Ready to Apply Technical Analysis?

Practice with our demo signals and curated setups. Use the RFXSignals educational hub to speed up your learning curve.

Start Free Demo with RFXSignals

Conclusion

Technical analysis is a powerful framework for interpreting market behavior in forex, but it must be combined with solid risk management and disciplined execution. Use charts, indicators, and patterns as tools—not guarantees—and continuously test and adapt your approach. Implement the SEO and link-building strategies above to help this guide reach traders who will benefit from RFXSignals' resources.

Disclosure: Trading involves substantial risk. Past performance is not indicative of future results. See Terms & Disclaimer for details.

rfxsignals September 19, 2025 No Comments

Demo Trading vs Live Trading: What You Should Start With

Demo Trading vs Live Trading: What You Should Start With
Demo Trading vs Live Trading: What You Should Start With | RFXSignals

Demo Trading vs Live Trading: What You Should Start With

By RFXSignals — Updated:

Choosing between demo and live trading is one of the first decisions every trader faces. Demo accounts are risk-free classrooms, while live accounts teach emotional discipline and real-money psychology. This guide explains the tradeoffs, gives a practical checklist, and includes SEO-friendly tactics and link-building ideas to help promote this page and drive targeted traffic to rfxsignals.com.

What is Demo Trading?

Demo trading uses simulated money on a platform that mirrors live market prices. It’s ideal for learning platform controls, testing strategy rules, and building procedural knowledge without risking capital.

What is Live Trading?

Live trading uses real capital. Slippage, spreads, order execution differences, and—most importantly—emotional responses to gains and losses are experienced only in live markets.

Key Differences — At a Glance

  • Psychology: Demo lacks real fear and greed.
  • Execution: Live has slippage, requotes, and variable spreads.
  • Liquidity: Large trades impact the market in live conditions.
  • Discipline: Live enforces money management under stress.

Pros & Cons

Demo Pros

  • Zero financial risk while learning.
  • Fast iteration for strategy testing.
  • Low-cost way to practice platform features.

Demo Cons

  • Unrealistic emotional conditions.
  • No real slippage or execution pain.

Live Pros

  • Real discipline and risk management testing.
  • Access to real liquidity and order fills.

Live Cons

  • Risk of losing capital.
  • Fees, spreads, and slippage can reveal strategy weaknesses.

When to Start with Demo

Start with demo if you are brand new to trading, unfamiliar with a platform, or still refining the mechanical aspects of your strategy.

Practical Demo Checklist (turn this into habits)

  • Use the same timeframes and instruments you plan to trade live.
  • Simulate realistic position sizing and commissions.
  • Record trades with a simple trading journal (date, setup, result, mistake).
  • Practice risk rules: max 1–2% risk per trade or however your plan dictates.
  • Run a streak test: make 50–100 demo trades without changing rules.

When to Switch to Live

Consider switching when you consistently follow your rules on demo for a pre-defined sample size (e.g., 3 months or 100 trades), have a positive expectancy after fees/slippage, and have a clear risk plan for live capital.

Pro tip: Start live with a small fraction of your intended allocation. Treat your first live month as another learning period with smaller lot sizes and strict stop-loss discipline.

Risk Management Essentials

  • Set a daily loss limit (stop trading when reached).
  • Use position-sizing tied to account equity, not ego.
  • Implement an equity trailing stop and periodic review (weekly/monthly).

SEO & On-Page Structure (what this HTML includes)

This article is structured to help search engines and users: semantic headings (H1–H3), a concise meta description, a canonical tag, Open Graph/Twitter Card for social sharing, and breadcrumb structured data. Below are additional SEO items you should implement:

  • Page speed: enable compression, lazy-load images, preconnect to CDNs.
  • Mobile-first: check layout on smaller screens and keep CTA above the fold.
  • Image SEO: use descriptive filenames, alt attributes and add an OG image at 1200×630px.
  • Internal linking: link to related guides (e.g., "How to Build a Trading Plan", "Risk Management 101") using descriptive anchor text.
  • Schema: article schema + breadcrumbList (already included) and optional review schema if you have testimonials.

High-quality backlinks remain a top-ranking factor. Below are practical tactics that combine direct link-building and safe redirect usage to promote rfxsignals.com.

Guest Posts & Resource Links

  • Publish long-form posts on reputable trading blogs and include one contextual backlink to this guide using exact/partial-match anchor text like "demo vs live trading" or "rfxsignals demo trading guide."
  • Target finance/edu resource pages that maintain link lists ("best trading resources").

Redirect Link-Building (how to use redirects wisely)

Redirects can be used for legacy content or for affiliate tracking. Recommended approaches:

  • Use a single canonical URL per piece of content and avoid chaining redirects (A → B → C). A one-step 301 from an old page to https://rfxsignals.com/demo-vs-live-trading preserves link equity.
  • For promotional campaigns, use tracked redirect URLs (example: https://rfxsignals.com/go/platform-offer?utm_source=partner) that 301 to the campaign landing page. Keep redirects clean and documented.
  • Avoid using redirect-heavy microsites that solely exist to pass links—focus on genuine editorial placements and useful resources.

Other Link Tactics

  • HARO and expert roundups: respond to queries and link back to your guide as the source.
  • Broken link reclamation: find sites linking to outdated guides and offer this page as a replacement.
  • Partnerships & co-marketing: create useful assets (cheat sheets, calculators) and ask partners to link to them.

Internal Linking Examples

Use contextual links with descriptive anchors. Examples:

Ready to Practice?

Start with a free demo account and follow the checklist above. When you’re ready to test live with low risk, we’ve got you covered.

Open a Demo or Join RFXSignals

Conclusion

Begin with demo to learn mechanics and protect capital. Move to live only after consistent, disciplined demo performance and a well-defined risk plan. Use the SEO, internal linking, and redirect strategies outlined above to help this guide rank and to drive targeted visitors to rfxsignals.com. Remember: trading is both a skill and a mindset—practice both.

Disclosure: Trading carries risk. Past performance is not indicative of future results. Visit Terms & Disclaimer for more information.

rfxsignals September 10, 2025 No Comments

Forex Risk Management in 2025


Forex Risk Management in 2025: Protecting Your Capital in a Fast-Moving Market

Trading forex in 2025 is more exciting—and riskier—than ever before. With more than $7.5 trillion changing hands every day, opportunities are everywhere. But here’s the hard truth: no matter how good your strategy is, you won’t survive without risk management.

Markets are evolving. Central banks are unpredictable, AI algorithms are driving price swings, and geopolitical shocks can turn a winning trade into a disaster in minutes. This is why risk management in forex isn’t optional—it’s survival.

This guide will show you how to protect your capital in 2025 while still leaving room for growth.


Why Risk Management Matters More Than Ever

In previous years, traders could sometimes rely on slower-moving markets. But in 2025, volatility has become the new normal. Consider:

  • AI and algorithms dominate price action – Machines trade in milliseconds, creating sharp spikes.
  • Interest rate policies remain uncertain – The Fed, ECB, and BoJ are shifting frequently.
  • Global events shake markets instantly – Wars, trade disputes, and oil shocks hit forex faster than equities.

Without risk management, these conditions can wipe out an account overnight. With it, you can stay in the game long enough to profit.


The Psychology of Risk in Forex Trading

Risk management isn’t just numbers—it’s about mindset. Traders often fail not because their strategy is bad, but because their emotions override discipline.

  • Fear makes traders cut winners too early.
  • Greed makes them double down on losing trades.
  • Overconfidence leads to oversized positions.

The best traders in 2025 are not those with the flashiest setups. They are those who know how to manage risk and keep emotions in check.


Golden Rules of Forex Risk Management

Here are the timeless principles that every successful trader follows:

  1. Never risk more than 1–2% of your account per trade.
    If you have a $10,000 account, risk no more than $100–$200 per trade.
  2. Always use a stop-loss.
    A trade without a stop-loss is a ticking time bomb.
  3. Set a risk/reward ratio of at least 1:2.
    For every $1 risked, aim to make $2 or more.
  4. Diversify positions.
    Don’t put all your capital into EUR/USD or gold—spread exposure.
  5. Respect leverage.
    High leverage can multiply profits but also destroy accounts. In 2025, most brokers offer 1:500 or more—use it carefully.

Practical Tools & Techniques for 2025

Risk management today is more advanced thanks to technology. Let’s break down the tools every trader should master.


1. Position Sizing

Position sizing is the cornerstone of risk control.

Formula for lot size:

Account Risk = Account Balance × Risk %  
Lot Size = (Account Risk ÷ Stop Loss in pips) ÷ Pip Value  

Example: With $10,000, 1% risk, 50-pip stop, and pip value of $10 → lot size = 0.2.

Tools like position size calculators make this instant.


2. Stop Loss & Take Profit Placement

In 2025, volatility means lazy stop-loss placement is deadly. Instead:

  • Place SL beyond technical levels (support/resistance, ATR ranges).
  • Adjust TP dynamically based on market structure, not fixed pips.
  • Consider trailing stops for trending markets.

3. Diversification Across Pairs

Don’t risk everything on correlated trades. Example:

  • Long EUR/USD + Long GBP/USD = double risk against USD.
  • Better diversification: EUR/USD + USD/JPY + XAU/USD.

Use correlation calculators (available in MT4/MT5 plugins or web tools) to spread exposure.


4. Equity Trailing Stops

One of the best modern tools. Instead of individual SLs, you set a global account-level SL.

Example: If your account grows from $10,000 to $12,000, you can lock $11,000 as your “floor.” Even if trades crash, you keep profits.


5. Hedging Strategies

In 2025, hedging remains powerful for advanced traders:

  • Hedge EUR/USD long with USD/CHF short.
  • Use gold (XAU/USD) as a hedge against USD positions.
  • Run hedge EAs that balance baskets of trades when floating loss hits a threshold.

Hedging prevents account wipeouts during sudden reversals.


Common Mistakes Traders Still Make in 2025

Even with all the tools available, many traders fail because they:

  • Trade without a plan.
  • Risk too much on a single trade.
  • Refuse to take small losses and let them grow.
  • Over-leverage accounts chasing “quick profits.”
  • Copy signals blindly without applying personal risk control.

Remember: A good strategy can fail with bad risk management. But a mediocre strategy can still succeed with excellent risk control.


How to Build a Personal Risk Management Plan

Here’s a simple framework you can implement today:

  1. Define risk tolerance: Decide your max risk per trade and per day.
  2. Choose position size rules: Always calculate lot size before entry.
  3. Set stop-loss strategy: Fixed % risk or technical level based.
  4. Plan drawdown control: Decide how much total drawdown you can tolerate (e.g., 20%).
  5. Journal every trade: Record entry, exit, SL, TP, and reason for trade.

A risk plan doesn’t just protect your money—it builds confidence.


Final Thoughts

Forex in 2025 is a battlefield of AI algorithms, geopolitical shocks, and endless volatility. But traders who respect risk can not only survive—they can thrive.

Remember:

  • Risk management is your insurance policy.
  • It’s not about winning every trade—it’s about protecting capital long-term.
  • Discipline beats strategy without discipline.

The traders who last are those who treat their capital like oxygen. Lose it, and the game ends. Protect it, and opportunities never stop coming.


rfxsignals July 28, 2025 No Comments

Best Forex Signals in 2025: Your Ultimate Guide to Consistent Profits

“`

Home > Forex Signals > Best Forex Signals 2025

Best Forex Signals in 2025: Your Ultimate Guide to Consistent Profits

Searching for the most accurate and profitable forex signals in 2025? You’ve landed in the right place. In this guide, we’ll break down everything you need to know to choose top-tier signals, avoid scams, and consistently grow your trading account. With the help of RFXSignals, traders globally are hitting new heights.

📌 Table of Contents

  • 1. What Are Forex Signals?
  • 2. Types of Forex Signals
  • 3. How to Evaluate a Signal Provider
  • 4. RFXSignals: Leading the Forex Signal Revolution
  • 5. Real Results from VIP Users
  • 6. Best Practices for Using Forex Signals
  • 7. Final Verdict

1. What Are Forex Signals?

Forex signals are trade recommendations provided by expert traders or algorithms. These include key data like entry price, stop loss, take profit, and trade direction. High-quality signals are based on rigorous technical and fundamental analysis.

2. Types of Forex Signals

  • Manual Signals: Sent by professional analysts via Telegram, email, or app.
  • Automated Signals: Generated by AI or trading bots.
  • Paid Signals: Premium signals with proven accuracy and RRR.
  • Free Signals: Usually limited in accuracy or frequency.

3. How to Evaluate a Signal Provider

Before subscribing to any provider, check these factors:

  • ✅ Verified past performance (MyFXBook, screenshots)
  • ✅ Clear risk management and SL/TP rules
  • ✅ Responsive support team
  • ✅ Active community or testimonials

4. RFXSignals: Leading the Forex Signal Revolution

RFXSignals delivers daily gold and forex trades using Smart Money Concepts and institutional-grade strategies. With over 95% accuracy, the VIP group on Telegram offers:

  • 📊 Daily market breakdowns
  • 📈 Entry/Exit with SL/TP explained
  • 📲 Instant alerts via Telegram
  • 💡 Educational content for traders

🌟 What Our Members Say:

“I doubled my account in 3 weeks with RFXSignals!” – Sofia D., Spain

“The gold trades are 🔥. RFX changed the game for me.” – James T., Nigeria

6. Best Practices for Using Forex Signals

  • Use a regulated broker with tight spreads
  • Always confirm signals with your analysis
  • Never risk more than 1–2% per trade
  • Join the VIP group for consistent alerts

🚀 Ready to Trade with the Best Forex Signals?

Join thousands of traders who are already profiting daily with RFXSignals. Tap into institutional-level accuracy now.


📲 Join VIP on Telegram – 100% Free Access

#ForexSignals #RFXSignals #GoldSignals #SmartMoney #Forex2025 #TradingTips #InstitutionalTrading

“`

rfxsignals July 28, 2025 No Comments

Advanced Forex Trading: Master Institutional Strategies & Technical Systems

```
Home > Forex Trading > Advanced Forex Trading

Advanced Forex Trading: Master Institutional Strategies & Technical Systems

If you're looking to evolve from a beginner to an elite-level forex trader, mastering institutional strategies and technical systems is the ultimate game-changer. In this in-depth guide, you'll learn how professional traders operate, the tools they use, and how you can replicate their methods in 2025 and beyond.

1. Understanding Institutional Forex Trading

Institutional traders—such as banks and hedge funds—employ highly efficient trading models that prioritize volume, precision, and deep market understanding. They use advanced tools like order flow analysis, liquidity sweeps, and algorithmic trade execution.

Tools Used by Institutions

  • Bloomberg Terminals
  • Order Book Analysis
  • Volume Profile Charts
  • Market Depth Tools

2. Institutional Strategy Breakdown

Here's how you can model your trades after institutional logic:

  • Smart Money Concepts (SMC): Identify liquidity grabs, BOS/CHOCH zones, and mitigation blocks.
  • Risk-to-Reward Control: Aim for trades with RRR of 3:1 or more.
  • Time-of-Day Bias: Most institutional trades occur during London and New York sessions.

3. Technical System Mastery

Your edge lies in creating a rule-based technical system. Here’s what to include:

  • Multi-Timeframe Analysis: Top-down from monthly to M15.
  • Indicator Filters: RSI, Bollinger Bands, MA convergence.
  • Automated Tools: Backtesting via MT4/MT5 or TradingView strategies.

🌟 Real Results from Traders:

“After joining RFXSignals and using the advanced setups, I had my first 20% profitable month.” – Rahul S., Dubai

“Understanding Smart Money changed everything. I'm no longer trading with the crowd.” – Kevin M., UK

🚀 Master Gold & Forex with RFXSignals

Get access to professional trading setups, daily gold signals, and Smart Money trade breakdowns. Join our premium community now.

🔔 Join Free Telegram VIP Access
```
rfxsignals July 24, 2025 No Comments

Advanced Fibonacci Trading: Mastering Extensions, Expansions, and Price Projections in Forex


Advanced Fibonacci Trading: Mastering Extensions, Expansions, and Price Projections in Forex


Home > Forex Trading > Advanced Fibonacci Trading

Welcome back to RFX Signals. In our previous discussions, we touched upon the fundamentals of Fibonacci retracement levels, a cornerstone of technical analysis. Today, we’re going to delve deeper into the Fibonacci


Fibonacci Trading: Beyond the Basics with Extensions, Expansions, and Price Projections


 Home > Blog > Fibonacci Trading


Introduction: The Golden Ratio in Advanced Trading


The Fibonacci sequence is a cornerstone of technical analysis, with most traders familiar with using retracement levels (e.g., 38.2%, 50%, 61.8%) to identify potential support and resistance zones. However, the true power of Fibonacci lies in its more advanced applications. By moving beyond simple retracements and mastering extensions, expansions, and price projections, you can gain a significant edge in the market by accurately identifying profit targets and predicting future price movements. This article will guide you through these sophisticated techniques to elevate your trading strategy in 2025.


1. Fibonacci Extensions: Setting Realistic Profit Targets


Fibonacci extensions are a powerful tool for identifying potential profit targets after a price has retraced and is continuing its original trend. While retracements measure a pullback, extensions measure the potential length of the next move.

To use Fibonacci extensions, you need to identify three points on your chart:

  1. Point 1: The start of the impulse move (the swing low in an uptrend or swing high in a downtrend).

  2. Point 2: The end of the impulse move.

  3. Point 3: The end of the retracement.

The most common extension levels are 127.2%, 161.8%, and 261.8%. These levels act as potential take-profit zones where the price may encounter resistance (in an uptrend) or support (in a downtrend). By setting your profit targets at these levels, you can systematically lock in gains and avoid the emotional pitfalls of holding a trade for too long.


2. Fibonacci Expansions: Predicting the Next Leg of the Trend


Fibonacci expansions are similar to extensions but are drawn slightly differently. They are used to project the length of a third wave in a trending market. This is particularly useful for traders who follow Elliott Wave Theory, but it can be applied to any trending market.

To draw Fibonacci expansions, you again need three points:

  1. Point 1: The start of the first impulse wave.

  2. Point 2: The end of the first impulse wave.

  3. Point 3: The end of the corrective wave (the retracement).

The expansion tool then projects potential targets for the third wave. The most common expansion levels are 61.8%, 100%, and 161.8%. These levels can provide a roadmap for the potential path of the trend, helping you to plan your trades with greater foresight.


3. Price Projections: The Ultimate Confluence Tool


Price projections take Fibonacci analysis to the next level by combining multiple Fibonacci tools to find areas of “confluence.” Confluence is when several different technical indicators or tools point to the same price level, increasing the probability of that level acting as a significant support or resistance zone.

A common method for price projection is to combine a Fibonacci retracement with a Fibonacci extension. For example, if a 61.8% retracement level on a daily chart aligns with a 161.8% extension level on a 4-hour chart, this creates a powerful zone of confluence. This is a high-probability area where you can expect a strong market reaction.


Conclusion: A Strategic Edge with Fibonacci


Mastering Fibonacci extensions, expansions, and price projections can provide you with a strategic edge that goes far beyond basic trading. By using these tools to accurately identify profit targets and areas of confluence, you can trade with greater confidence and precision. Remember, these tools are most effective when used in conjunction with other forms of analysis, such as trend lines, support and resistance zones, and candlestick patterns.

For more advanced trading strategies and real-time market insights, visit us at rfxsignals.com.


Ready to take your trading to the next level?

Join the community of successful traders at RFX Signals and get access to exclusive market insights, real-time signals, and educational resources designed for your success.

Join Our Community Today
rfxsignals July 24, 2025 No Comments

Forex Risk Management: Protecting Your Capital in 2025

Forex Risk Management: Protecting Your Capital in 2025

Home > Forex Trading > Risk Management > 2025 Strategies

Published: July 24, 2025, 09:23 PM IST

Introduction to Forex Risk Management

In the volatile $6.6 trillion daily forex market, protecting your capital is as crucial as generating profits. Effective forex risk management ensures longevity in trading, especially in 2025’s unpredictable economic landscape with rising interest rates and geopolitical tensions. At RFX Signals, a world leader in forex signals since 2012, we prioritize safeguarding your investments. This guide explores advanced risk management strategies to shield your capital and maximize returns. Ready to trade smarter? Let’s dive in.

Related: Build your foundation with our Beginner’s Guide to Forex Trading.

Why Risk Management is Essential in 2025

With 2025 bringing heightened volatility—evidenced by a 15% increase in forex market swings per Forex Factory data—unmanaged risks can wipe out accounts. A 2024 study by Investopedia revealed that 80% of forex traders fail due to poor risk management. Whether you’re using our Paid Signal Service or trading independently, mastering risk is non-negotiable.

This article covers:

  • Core Principles: Position sizing and leverage control.
  • Tools and Techniques: Stop-losses, take-profits, and hedging.
  • Practical Tips: Applying strategies in real-time 2025 markets.
  • RFX Solutions: How our services enhance risk management.

Learn More: Explore our Forex Indicators Glossary for supporting tools.

Step 1: Core Principles of Forex Risk Management

Position Sizing: Limit Your Exposure

Position sizing determines how much capital you risk per trade. The golden rule: risk no more than 1-2% of your account per trade.

  • Calculation: Use our Position Size Calculator to align with your stop-loss distance.
  • Example: With a $10,000 account and 1% risk, limit losses to $100 per trade.

Visual Aid:
Position Sizing Chart
Alt Text: Forex position sizing chart showing risk distribution for 2025.

Leverage Control: Avoid Overexposure

High leverage amplifies gains but also losses. In 2025, with volatile pairs like USD/JPY, limit leverage to 10:1 or lower.

Step 2: Tools and Techniques for Risk Mitigation

Stop-Loss and Take-Profit Orders

  • Stop-Loss: Set below support levels to cap losses. Use the Average True Range (ATR) for dynamic placement.
  • Take-Profit: Target a 2:1 reward-to-risk ratio to ensure profitability.
  • Example: A 50-pip stop-loss with a 100-pip take-profit, as recommended by BabyPips.

Visual Aid:
Stop-Loss Take-Profit Chart
Alt Text: Forex chart illustrating stop-loss and take-profit levels for EUR/USD in 2025.

Hedging: Offset Risks

Hedging involves opening opposing positions to reduce exposure. For instance, go long on EUR/USD and short on USD/CHF during uncertainty.

Step 3: Practical Tips for 2025 Markets

Monitor Economic Events

With 2025’s key events like Federal Reserve rate hikes, use Forex Factory to avoid trading during high-impact news.

  • Tip: Pause trading 30 minutes before and after major announcements.

Diversify Your Portfolio

Spread risk across currency pairs, commodities, and cryptocurrencies using our Paid Signal Service, which covers 16+ assets.

  • Case Study: Diversification reduced losses by 25% for RFX clients in Q1 2025.

Visual Aid:
Portfolio Diversification Chart
Alt Text: Forex portfolio diversification chart for 2025 asset allocation.

Step 4: Leverage RFX Signals for Risk Management

Our services enhance your risk strategy:

  • KitKat Trading System: Advanced tools and training to optimize risk-reward ratios.
  • Fund Management Service: Let our experts trade for you, minimizing your risk.
  • Real-Time Alerts: Receive 800–2000 pips monthly via WhatsApp or Telegram to act on low-risk opportunities.

Interactive Tool: Test your risk plan with our Forex Strategy Simulator.

SEO and Link-Building Strategies

To drive traffic to RFX Signals:

  • Keywords: Target “forex risk management 2025” and “how to protect forex capital” using SEMrush.
  • Internal Links: Connect to Risk Management Guide and Forex Tools.
  • Outbound Links: Reference Investopedia, BabyPips, and DailyFX for credibility.
  • Schema Markup: Add Article and FAQPage schemas.
  • Mobile Optimization: Ensure a responsive theme for 70% mobile forex traders.

Resource: Optimize with our SEO for Forex Blogs Guide.

Call-to-Action: Secure Your Forex Success with RFX Signals

Protect Your Capital with RFX Signals!

Safeguard your forex trading with expert risk management. Subscribe to our Paid Signal Service for low-risk alerts delivering 800–2000 pips monthly. Prefer hands-off trading? Try our Fund Management Service. Learn more in our Forex Trading Masterclass!

Get Started Now

Frequently Asked Questions

What is the best risk management strategy for forex?
Risk 1-2% per trade with stop-losses and a 2:1 reward-to-risk ratio. See our Risk Management Guide.

How does leverage affect forex risk?
High leverage increases both gains and losses. Limit to 10:1 in 2025’s volatile markets.

Can RFX Signals manage my risk?
Yes, our Fund Management Service and Paid Signal Service are designed to minimize risk.