rfxsignals October 3, 2025 No Comments

How to Create a Forex Signal Funnel That Converts Visitors into Subscribers

How to Create a Forex Signal Funnel That Converts Visitors into Subscribers
How to Create a Forex Signal Funnel That Converts Visitors into Subscribers | {{SITE_NAME}}

How to Create a Forex Signal Funnel That Converts Visitors into Subscribers

By • Estimated read: 8–10 minutes

Quick summary: A high-converting Forex signal funnel combines targeted landing pages, effective lead magnets, friction-free CTAs (WhatsApp, Telegram, email), automated nurture sequences, and data-driven testing. Below is a practical, step-by-step blueprint you can implement in Elementor and scale for organic traffic or paid campaigns.

Building a funnel isn’t just about capturing emails — it’s about capturing the right leads and moving them through a predictable path from visitor → trial subscriber → paid member. For Forex sites, trust and perceived value are paramount. Your funnel must reduce friction, prove signal performance quickly, and provide social proof that converts skeptics into subscribers.

1. Define the funnel stages

A simple, effective funnel has four stages:

  1. Attract: organic blog posts, SEO pages, PPC ads, and social content driving traffic to a landing page.
  2. Capture: landing page with lead magnet and clear CTA (WhatsApp, email, or Telegram opt-in).
  3. Nurture: automated email/WhatsApp sequences delivering value and proving signal credibility.
  4. Convert & Retain: onboarding, trial offers, member-only content, and upsell pathways for paid signals.

2. High-converting landing page elements

Your Elementor landing page should be lightweight and focused. Include:

  • Clear headline: promise a specific benefit (e.g., “Daily Forex Signals — Backtested & Real-Time”).
  • Concise subheadline: one-line reason to trust you (track record, transparency).
  • Lead magnet: free PDF, 3-day trial, or a live signal sample to demonstrate real value.
  • Social proof: time-stamped screenshots, case studies, or brief testimonials.
  • Primary CTA: WhatsApp/Email opt-in (use `wa.me` for mobile-friendly WhatsApp links).
  • Secondary CTA: “Learn More” to internal pages that support SEO and inbound links.

3. Choosing the best lead magnet for Forex signals

Lead magnet examples that convert well in trading niches:

  • “Top 5 High-Probability Setups” PDF with screenshots and historical results.
  • 3-day trial of live signals with reduced risk sizing.
  • Mini-course: “How We Build a Signal” — short videos + checklist.
  • Trade journal template (spreadsheet) pre-filled with example signals.

Pick one high-value magnet and A/B test the offer language and format.

4. Friction-free signup: forms, WhatsApp & Telegram

Minimal friction gets more subscribers. Options to consider:

  • One-field forms: ask only for email or phone number.
  • WhatsApp quick opt-in: `https://wa.me/{{WHATSAPP_NUMBER}}?text=...` prefilled message makes mobile conversions instant.
  • Telegram opt-in: for users who prefer channel-based delivery — `t.me/{{TELEGRAM_USERNAME}}`.

Provide alternative contact methods (email + WhatsApp) so users choose what’s easiest.

5. Nurture sequences that prove value

After capture, a carefully timed automation builds credibility and nudges conversion:

  1. Welcome message (immediate): deliver lead magnet and set expectations.
  2. Proof email (24 hours): show time-stamped past signals and outcomes.
  3. Education (day 3–7): short lessons on reading signals and risk management.
  4. Trial highlight (day 7–10): limited-time trial or discounted first month.
  5. Retarget & re-engage: if no conversion, use targeted content or WhatsApp reply prompts.

6. Segmentation and personalization

Not all visitors are the same. Segment by:

  • Experience level (beginner, intermediate, pro)
  • Preferred instrument (Forex pairs, crypto, indices)
  • Preferred delivery channel (WhatsApp, Telegram, Email)

Personalized messages increase conversion rates — e.g., “Here’s how EURUSD signals work” vs “Here’s our crypto signal process”.

7. Proof, transparency & trust signals

Forex audiences are skeptical. Use:

  • Public performance dashboards (daily P&L snapshots).
  • Third-party verification where possible (Myfxbook, FX Blue links — add outbound links for credibility).
  • Time-stamped screenshots and short video walk-throughs of live trades.

8. Pricing strategy & trial mechanics

Good strategies:

  • Free trial with limits: give sample signals but cap size or access duration.
  • Low entry pricing: a small monthly fee to qualify serious subscribers.
  • Tiered plans: Basic (daily signals), Pro (scaling entries + chat), VIP (1:1 support).

9. Measure, test & optimize

Key metrics to track:

  • Landing page conversion rate (visitors → leads)
  • Lead-to-subscriber conversion (trial → paid)
  • Churn rate and lifetime value (LTV)
  • Cost per acquisition (CPA) if using paid ads

Run A/B tests on headlines, lead magnets, CTA colors, and WhatsApp vs email opt-ins. Change only one element per test and run for a statistically significant period.

10. Automation stack & recommended tools

Lightweight stack suggestions:

  • Elementor (landing pages + forms)
  • Email automation: MailerLite, ConvertKit, or ActiveCampaign
  • WhatsApp business + `wa.me` links for direct chat
  • Telegram channel + bot for broadcast automation
  • Analytics: Google Analytics + Google Tag Manager + Funnel tracking
SEO & Link Strategy: Use internal links to related posts (signals, backtests, performance) and add outbound links to authoritative resources (regulatory guidance, industry tools). This improves topical relevance and link-building potential.

11. Retention: turning subscribers into long-term members

Retention beats acquisition. Tactics that work:

  • Weekly performance summaries and transparent P&L.
  • Monthly Q&A calls or webinars with trade rationale.
  • Member-only content and progressively valuable upgrades.
  • Referral incentives to turn members into evangelists.

12. Example funnel blueprint (practical)

Traffic source (SEO blog) → Landing page with PDF lead magnet → WhatsApp quick opt-in → Automated welcome + proof email → 3-day trial signals → Day 7 trial review & upsell → Paid onboarding with VIP channel access. Monitor conversion at each step and iterate monthly.

Conclusion

Building a high-converting Forex signal funnel requires clarity, proof, and low friction. Use Elementor to build fast landing pages, a WhatsApp/Telegram-first approach for instant conversions, and automation to scale nurture flows. Measure everything and iterate — small lifts across the funnel compound into large growth.
Disclaimer: Trading carries risk. This article is educational and not financial advice. Test funnel changes in small steps and measure impact before scaling.
rfxsignals October 3, 2025 No Comments

How to Detect Signal Manipulation in Volatile Markets

How to Detect Signal Manipulation in Volatile Markets
How to Detect Signal Manipulation in Volatile Markets | {{SITE_NAME}}

How to Detect Signal Manipulation in Volatile Markets

By Estimated read: 9–11 minutes

Overview: Volatile markets create fertile ground for legitimate signal noise and for deliberate signal manipulation. Knowing how to spot manipulation—fake fills, spoofing, coordinated alerts, and delayed data—helps you avoid poor trades and preserve capital. This guide lists red flags, diagnostic tests, and practical defensive rules you can implement immediately.

Volatile markets amplify every input — including the signals you follow. Distinguishing authentic signals from manipulated or low-quality alerts is essential for any trader relying on external feeds, community channels, or automated strategies. This article breaks detection into (A) red-flag behaviors, (B) data tests you can run, (C) cross-checks and forensic checks, and (D) defensive rules to keep your drawdown small when the market behaves badly.

1. Common types of signal manipulation

Understanding the methods helps detect them. Frequent manipulative behaviors include:

  • Spoofed fills: fake order information shown on some platforms but not actually executable on the exchange.
  • Delayed or stale data: feeds that lag market prices, making "real-time" signals inaccurate.
  • Coordinated pump-and-dump alerts: groups send bullish signals to create momentum, then exit.
  • Cherry-picked backtests: signals optimized for specific long-tailed periods that don’t hold live.
  • Wash alerts: test alerts sent to create perceived success before real trades are placed.

2. Red flags you should watch

If you see any of the following, treat the signal with suspicion:

  • Repeated "perfect" entries or exits with unrealistically tight stops.
  • Signals that arrive only after large market moves (late alerts).
  • High-volume claims without independent verification (no fill screenshots, no broker statements).
  • Channels that frequently change recommended targets/stops without transparent reasoning.
  • Pressure to act immediately or fear-of-missing-out (FOMO) prompts in messaging.

3. Quick data checks you can run (real-time)

When a signal arrives in a volatile market, run these rapid checks before risking capital:

  1. Timestamp check: Compare the signal timestamp to your price feed. If the signal refers to a price that happened >1–3 seconds earlier in a fast market, treat it as stale.
  2. Exchange verification: For crypto or ECN markets, verify the quoted level on the exchange's native order book or official API.
  3. Volume confirmation: Check whether volume on the move supports the claim. Low-volume moves during volatility often reverse quickly.
  4. Cross-feed confirmation: Look for the same move on a different data provider or broker.
  5. Order book depth: Observe whether large visible orders are genuine or vanish (a sign of spoofing).

4. Statistical and forensic tests (post-event)

For signals you already received, perform these retrospective checks to detect manipulation or poor signal hygiene:

  • Fill/Execution audit: Compare the claimed entry/exit to actual fills recorded by your broker; large discrepancies indicate misreporting.
  • Latency analysis: Measure the delay between alert and market price (log timestamps). A pattern of >X seconds delay in volatile periods is suspicious.
  • Correlation testing: Check if multiple symbols moved together artificially (e.g., many illiquid pairs spiking simultaneously).
  • Win/loss distribution review: Real strategies show varied outcomes; overly tidy drawdowns and smooth equity curves may be overfitted.

5. Cross-check sources and reputations

Signal quality depends on the sender. Maintain a source registry:

  • Grade sources by historical accuracy and transparency (A–F).
  • Prefer sources that publish post-trade evidence: time-stamped screenshots, broker reports, or public API calls.
  • Avoid exclusive-only groups that refuse to let you audit past signals.

6. Behavioral signs from chat/activity logs

Monitor the behavior of channel moderators or signal providers. Signs of manipulation include:

  • Deleting or altering messages after the fact to make a signal look better.
  • Amplifying FOMO with constant "now or never" messages.
  • Posting confusing mixed signals to create noise while insiders trade elsewhere.

7. Defensive trade rules to limit damage

You don’t need to root out every manipulative act; you need rules that protect capital. Implement these defensive rules:

  • Wait-for-confirmation: Require a price or volume confirmation before entering after a signal (e.g., close above/below the signal price on a 1-minute candle).
  • Reduced sizing in volatile windows: Scale position size down during scheduled news or extreme volatility.
  • Use limit entries with slippage caps: Only accept fills within acceptable slippage; reject fills beyond that to prevent chasing fake moves.
  • Predefine maximum exposure: Keep a portfolio-level cap; if multiple signals spike, reduce per-signal size.
  • Auto-stop audit: Keep logs of stop placement vs actual executed stop levels to detect mismatches quickly.

8. Automation & monitoring tools

Automation helps detect patterns faster than manual checks. Consider:

  • Recording all incoming alerts with timestamps and automatically matching them to price feed snapshots.
  • Setting automated alerts when fill slippage exceeds thresholds or when the order book shows disappearing liquidity.
  • Using simple statistical dashboards to flag sources whose reported results deviate significantly from actual fills.

9. Legal & ethical considerations

Some manipulative behaviors are illegal in regulated markets. If you suspect fraud (coordinated pump-and-dump, spoofing on regulated exchanges), document evidence and report to the relevant market regulator or exchange. Private chat disputes are common — preserve logs and timestamps before attempting to escalate.

Quick Checklist: 1) Always verify timestamps and price sources; 2) Check volume and order-book depth; 3) Reduce size in volatile windows; 4) Keep an audit trail for suspicious signals.

10. Example: a real-world detection workflow

Scenario: You receive a bullish breakout alert during a major economic release.

  1. Immediately snapshot the price from your primary feed and a secondary feed (exchange API or alternative broker).
  2. Check volume on the breakout candle; if volume is muted, treat the breakout as weak.
  3. If the order book shows large orders that vanish after you attempt to take them, abort the trade.
  4. If you still enter, reduce size by 50% and set a stricter slippage/stop rule.
  5. Log all timestamps and reconcile fills after the event — if your fills consistently differ, remove the source.

Conclusion

Signal manipulation is not always obvious, especially during high volatility. The best defense is a combination of skepticism, fast data checks, source auditing, and conservative trade rules that limit downside. Build these checks into your workflow and automate where possible — preserving capital during manipulated conditions is the fastest path to long-term profitability.

Disclaimer: This content is educational and not financial advice. Trading involves risk. Always test rules in a demo environment before scaling live.
rfxsignals September 30, 2025 No Comments

The Best Forex Signal Apps in 2025: Features, Reviews & Performance

The Best Forex Signal Apps in 2025: Features, Reviews & Performance

The Best Forex Signal Apps in 2025: Features, Reviews & Performance

A trader’s guide to the top Forex signal apps in 2025 — what features matter, how to evaluate real performance, and which platforms are leading the market for copy trading, alerts and verified signals.

Introduction — why app choice matters

Signal apps are no longer a niche: they power copy trading, automated alerts, verified signal subscriptions and social discovery. Choosing the right app affects execution, costs, transparency and your ability to verify performance. This guide compares the most-used platforms in 2025 and gives a practical checklist to pick the best fit for your goals.

What to look for in a signal app

Before comparing apps, know the decision criteria:

  • Transparency: timestamped trade logs, full-history exports and verified performance.
  • Execution quality: how the platform handles order routing, slippage and partial fills.
  • Costs: spreads, commissions, subscription fees and referral kickbacks.
  • Risk controls: per-provider max exposure, stop-loss enforcement and kill-switches.
  • Integration: broker compatibility, MT4/MT5 support, API and alert delivery methods (push, webhook, email).

Top apps & platforms in 2025 — quick overview

The landscape blends dedicated copy-trading networks, platform-native signals and powerful chart/alert ecosystems. The leading names are ZuluTrade, eToro, MetaTrader/MQL5 Signals, TradingView (alerts + social), and Myfxbook AutoTrade. Each excels in different areas, so match platform strengths to your needs. :contentReference[oaicite:1]{index=1}

1) ZuluTrade — best for curated copy trading

What it is: ZuluTrade is a specialist copy-trading marketplace that connects signal providers with followers, offering ranking, risk-scoring and performance analytics. It’s focused on social/copy trading with many providers to choose from. :contentReference[oaicite:2]{index=2}

Why traders like it

  • Provider ranking, historical metrics and community feedback
  • Flexible allocation controls and automatic risk-scaling
  • Integrations with many brokers and managed account options

Caveats

Watch for survivorship and selection bias in top lists, and verify fills on your broker — provider performance on ZuluTrade doesn’t always replicate across brokers.

2) eToro — best for social discovery + copy trading

What it is: eToro combines social feeds, public portfolios and copy-trading that lets users mirror “Popular Investors.” The platform emphasizes transparency and UX for retail traders. :contentReference[oaicite:3]{index=3}

Why traders like it

  • Easy onboarding and built-in community signals
  • Clear “copy” metrics and public performance histories
  • One-click copying for retail users

Caveats

eToro’s asset coverage and regulation vary by region. Also check fees and how position sizing maps from the provider to your account.

3) MetaTrader / MQL5 Signals — best for native, platform-integrated signals

What it is: The MetaTrader ecosystem (MT4/MT5) includes a large built-in signals marketplace (MQL5) where you can subscribe and auto-copy providers directly inside the trading terminal. This integrates tightly with brokers that support MT. :contentReference[oaicite:4]{index=4}

Why traders like it

  • Direct integration with execution terminal (lower bridging complexity)
  • Wide range of algo providers and EAs for automated strategies
  • Many providers publish detailed trade history on MQL5

Caveats

Because MQL5 is open, quality varies widely — verify provider longevity, copy fills and subscribe with small capital first.

4) TradingView — best for alerts, strategy discovery & community scripts

What it is: TradingView is primarily a charting/alert platform with a huge public script library and social community. Alerts can be sent via app push, email, SMS or webhooks — ideal for traders who want signals delivered to their execution system or mobile. :contentReference[oaicite:5]{index=5}

Why traders like it

  • Powerful Pine Script library and a massive community sharing ideas
  • Flexible alerting with webhook support — useful to drive auto-execution bridges
  • Great for researching and testing indicator-based signals

Caveats

TradingView is not an execution venue; you must build a reliable bridge (webhook → execution) and test latency/ordering carefully.

5) Myfxbook AutoTrade & marketplace — best for verified strategy stats

What it is: Myfxbook hosts performance analytics and an AutoTrade copy service where traders can subscribe to verified systems and track detailed metrics. It is often used to vet algos and shared systems. :contentReference[oaicite:6]{index=6}

Why traders like it

  • Independent verification and rich analytics (drawdown, growth, daily returns)
  • AutoTrade allows straightforward copying with performance transparency

Caveats

Provider selection still needs careful due diligence — exported stats are only as reliable as the underlying data feed and broker mapping.

How to compare app performance (practical checklist)

Don’t rely on screenshots or cherry-picked stats. Use this checklist to evaluate any signal app or provider:

  1. Request raw trade logs (timestamped entries, entries/exits, realized P&L).
  2. Run cost-adjusted backtests against your broker’s spreads, commissions and typical slippage.
  3. Test in demo first for 30–90 days to measure fills and latency.
  4. Check for survivorship bias — how many providers were removed from the platform’s top lists?
  5. Examine risk metrics: max drawdown, drawdown duration, and rolling Sharpe/Sortino ratios.
  6. Confirm execution mapping: ensure the provider’s trade sizing maps sensibly to your account size.

Costs & hidden fees to watch

Many platforms show gross performance but omit referral rebates, spread markups, or subscription stacking. Always compute net returns after:

  • Broker spreads and commissions
  • Platform subscription fees / provider commissions
  • Currency conversion or withdrawal fees

Final recommendations — which app should you pick?

If you want curated copy trading with risk tools, start with ZuluTrade. If you value community discovery and easy onboarding, try eToro. If you use MetaTrader and want terminal-native signals, explore MQL5. For research-first traders who want flexible alerting and webhook execution, TradingView is ideal. Use Myfxbook to verify stats and consider running any promising provider through AutoTrade/demo first. :contentReference[oaicite:7]{index=7}

Conclusion

The best Forex signal app in 2025 depends on your priorities: transparency, execution, or ease-of-use. Combine platform strengths with rigorous verification — demo-test fills, require full trade logs, and always adjust for costs. With the right process, signal apps can accelerate your trading; without verification, they’re a fast route to disappointment.

Want our free comparison spreadsheet?

Download a pre-filled comparison sheet (costs, features, verification checklist) to quickly evaluate signal apps against your broker and risk profile.

Further reading & sources

Vendor pages and recent reviews used to compile this guide: ZuluTrade reviews & platform pages, eToro copy trading reviews, MetaTrader/MQL5 signals listings, TradingView alerts documentation and Myfxbook provider listings. Use these sources to verify provider stats before subscribing. :contentReference[oaicite:8]{index=8}

RTech RFX Signals
RTech RFX Signals

We research and test signal providers, publish transparent trade logs and help traders choose platforms that match their risk profile.

rfxsignals September 30, 2025 No Comments

The Role of Sentiment Analysis in Signal Generation

The Role of Sentiment Analysis in Signal Generation

The Role of Sentiment Analysis in Signal Generation

Sentiment — from news, social media, positioning and options markets — is a powerful input for trading signals when engineered properly. This guide explains what to use, how to convert it into features, how to backtest and how to avoid common pitfalls.

Why sentiment matters

Price reflects information and expectations — and sentiment is the market’s aggregated expectations, fear and greed. Quantifying sentiment gives you a view of crowd behaviour that complements price-based technical indicators and fundamental macro data. When used carefully, sentiment features can provide early warnings of momentum shifts, overextended positioning, or regime changes.

Sources of sentiment

Sentiment is not a single thing — it comes from multiple channels. The most useful sources for FX signal generation are:

  • News sentiment: headlines, article tone and event coverage intensity (NFP, CPI, central bank minutes).
  • Social sentiment: Twitter/X, Reddit, Telegram channel chatter and other public forums (volume, polarity, velocity).
  • Positioning: Commitments of Traders (COT), broker aggregated positions and proprietary flow indicators.
  • Options & derivatives: skew, implied volatility shifts, put/call ratios — these reveal hedging demand and tail risk pricing.
  • Search & consumer signals: Google Trends spikes or search volume for terms like “buy EURUSD” can be supporting evidence.

Feature design — convert raw sentiment into trading inputs

Raw text or large tables are not directly useful for backtests. Convert them into normalized, time-aligned features:

1. Sentiment polarity and intensity

Use NLP (lexicon + transformer-based classifiers) to assign polarity scores (−1 to +1) and an intensity/confidence metric. Aggregate at chosen timeframes (e.g., 5-minute, hourly, daily).

2. Volume & velocity

A sudden spike in mentions (velocity) often matters more than the average polarity. Create features for mention volume, rolling z-score of volume, and cross-source corroboration (news + social spike).

3. Event flags and surprise scores

For macro events, derive surprise scores: actual − consensus (e.g., CPI surprise). Use both signed surprise and absolute surprise as features — the former suggests direction, the latter suggests volatility.

4. Positioning imbalance

Convert COT or broker flows into net positioning ratios and percentile ranks (where does current net long/short sit relative to the last N years?). Extremes often precede mean reversion.

5. Options-derived signals

Track changes in implied volatility, skew, and large block implied moves. Rapid increases in IV before scheduled events can indicate elevated tail-risk pricing.

Signal construction patterns

There are several robust ways to combine sentiment with price data:

Filter signals

Use sentiment as a filter: only take a technical breakout if sentiment polarity and volume confirm the move. This reduces false breakouts triggered by noise.

Contrarian signals

Extreme bullish social sentiment combined with crowded long positioning can be a contrarian sell signal — especially when sentiment is unanimous and lacks nuance.

Momentum augmenters

Use positive sentiment velocity to increase sizing on momentum trades; reduce size when sentiment turns flat or negative.

Event-driven overlays

Around macro events, use sentiment + surprise to determine trade posture: if a rate decision surprises together with positive news and positive social sentiment, bias long in the short-window trade.

Backtesting sentiment-based signals — special care

Sentiment backtests require careful engineering to avoid look-ahead bias and survivorship pitfalls:

  • Time alignment: ensure your sentiment timestamps reflect when information would be available (publish time, not crawl time).
  • Data persistence: keep historical snapshots — social platforms allow edits and deletions; news articles can be updated.
  • Latency modelling: include ingestion latency. If you only receive social feeds with a 30s delay, simulate this delay in backtests.
  • Out-of-sample testing: use rolling walk-forward validation because sentiment regimes change (e.g., pre- and post-a regulatory event).
  • Pre-commitment: document your feature pipeline and refrain from heavy post-hoc feature engineering on the whole dataset.

Evaluation metrics that matter

Standard ML metrics are useful, but in trading focus on money metrics:

  • Net P&L after transaction costs and slippage
  • Sharpe / Sortino ratio
  • Max drawdown and time-to-recover
  • Signal latency impact on fill price (simulate slippage)
  • Consistency of performance across regimes (stress tests)

Common pitfalls & how to avoid them

Many developers trip on the same traps:

  • Echo-chamber bias: relying on a single social platform that reflects retail chatter only; always corroborate across sources.
  • Overfitting lexicons: building a tone classifier tailored to historical jargon that doesn’t generalize.
  • Positioning data gaps: treating incomplete COT data as complete — always check coverage and reporting lag.
  • Ignoring non-stationarity: sentiment meaning can change (e.g., memes vs. serious news); monitor feature drift.

Practical workflow example

A practical pipeline might look like this:

  1. Collect feeds: news wires, curated Twitter stream, COT reports, options chain snapshots.
  2. Preprocess: deduplicate, timestamp normalize, filter by language and region.
  3. Score: NLP polarity + confidence, volume z-scores, surprise calculations, positioning percentiles.
  4. Fuse: combine sentiment scores with technical indicators into a composite signal with weights or a trained model.
  5. Backtest: time-aware validation with latency and cost models.
  6. Deploy: run in demo mode first, monitor feature drift and live fills, and set retraining cadence based on performance decay.

Case study (illustrative)

In backtests, a EURUSD strategy that required both a 1-hour RSI confirmation and a positive news polarity spike within the prior 60 minutes reduced false breakouts by ~30% and improved net P&L after costs versus the technical-only variant. The tradeoff was fewer signals — but better quality and lower drawdown.

Conclusion — sentiment amplifies but rarely replaces

Sentiment analysis is a powerful amplifier when combined with price and fundamental data: it helps filter low-probability signals, detect crowd extremes, and gauge event impact. But it’s an input, not a silver bullet. Robust pipelines, careful backtesting, latency modelling and continuous monitoring are essential. Start small, test in realistic demo conditions, and treat sentiment as one pillar of a multi-faceted signal generation system.

Want our sentiment starter pack?

Download sample sentiment features, demo notebooks and a timestamped feed template to accelerate your testing.

Further reading (authoritative outbound links)

For NLP and financial text analysis background, reputable resources include arXiv, Investopedia, and practical tutorials from libraries like Hugging Face and Stanford NLP.

RTech RFX Signals
RTech RFX Signals

We build practical FX signals, backtesting tools and datasets to help traders make data-driven decisions.

rfxsignals September 30, 2025 No Comments

The Hidden Cost of Free Forex Signals: What Traders Should Know

The Hidden Cost of Free Forex Signals: What Traders Should Know

The Hidden Cost of Free Forex Signals: What Traders Should Know

Free Forex signals are tempting, but they often carry hidden costs — financial, psychological and opportunity-based. This guide explains how to evaluate free signals, calculate their true cost, and choose safer alternatives.

Introduction — why “free” can be expensive

At first glance, free Forex signals look like a no-risk shortcut to profits: someone else does the analysis, you copy trades, and you keep the gains. But in FX, the difference between theory and execution is wide. Free signals often omit execution assumptions, real costs, or the edge’s fragility. The result? Traders who follow free alerts may underperform, lose money, or develop bad trading habits. This article breaks down the hidden costs and shows how to evaluate any signal provider — free or paid.

1. Transaction costs & slippage that aren't disclosed

Many free signals present entry and exit prices that assume perfect fills. Real trading includes spreads, commissions, and slippage — especially for high-frequency signals or during news. A signal that looks profitable on paper can be unprofitable after realistic costs.

  • Spread leakage: Signals often assume mid-market or ideal spreads; retail spreads vary by broker and time of day.
  • Slippage: Market moves between alert and execution — common during news or illiquid hours.
  • Commissions & swaps: These recurring costs are sometimes ignored in published performance tables.

2. Poorly-defined trade management

Free signals frequently list only entry and take-profit levels, but full trade management requires stop-loss rules, partial exit plans, position sizing and contingency for market events. Without these, traders may hold losing trades too long or overtrade winners, eroding returns.

What to check

Always look for documented rules: exact stop levels, max holding time, trade weight (lot size), and whether the signal is directional or hedge-ready. If it's missing — treat the signal with suspicion.

3. Survivorship & selection bias in advertised results

Providers often publish cherry-picked snapshots: only the best trades, or only recent winners. This creates survivorship bias that makes performance look better than reality. Ask for full historic logs with timestamped entries that include losing trades.

4. Latency and execution differences

If the provider and you are in different timezones or use different brokers, the execution price can differ substantially. For scalping signals, even a few hundred milliseconds matter. Some providers use institutional feeds — retail clients cannot replicate those fills.

5. Psychological costs and overreliance

Copying signals without understanding them reduces learning. Traders can become dependent, stop developing discipline, and panic when signals stop working. Free services may encourage frequent copying with little education — that breeds bad habits and erosion of trader skill.

6. Conflicts of interest and hidden monetization

Free signal providers may monetize via broker referral kickbacks, advertising, or selling aggregated trade lists. Some intentionally route followers to brokers where the provider receives rebates — which might explain certain trade timing. Transparency matters.

7. Quality & sustainability of edge

A profitable signal needs an edge (information, timing, or execution advantage). Many free systems are backtests optimized on historical data (data-snooping) and won't survive market regime changes. Sustainable edges require ongoing research and adaptation — usually not free.

How to evaluate free signals — a practical checklist

  1. Ask for full trade logs: timestamped entries, entries/exits, slippage and realized P&L after costs.
  2. Request a demo run: copy trades into a demo account for 30–90 days and measure real fills.
  3. Confirm trade management: stops, max drawdown limits, and position sizing rules are specified in writing.
  4. Calculate true returns: after spreads, commissions and realistic slippage per your broker.
  5. Search reviews & community feedback: reputable forums and independent trackers (be skeptical of reviews on the provider’s own page).
  6. Understand motivation: how does the provider make money? Affiliations with brokers? Subscription upsell?

Alternatives to blind copying

If you like free signals but want to reduce risk, consider:

  • Educational signals: providers that explain trade logic and why they enter/exit.
  • Filtered copying: only copy signals that meet your risk profile (e.g., at least 1:1 reward:risk and max drawdown limit).
  • Partial sizing: use smaller lot sizes or scale-in to test an unknown strategy live.
  • Paper trade first: replicate for months in a demo account under your broker to see true execution quality.

Red flags every trader should watch for

  • Opaque performance reports without downloadable logs
  • Guaranteed returns, especially large ones
  • Pressure to upgrade to a paid plan to “see real results”
  • No mention of risk or worst-case drawdown

Case study (illustrative)

Imagine a free channel that posts 20 scalps a week with advertised 70% win rate and average 15 pip winners. After measuring real fills on your broker, you discover average slippage/extra spread erodes 10 pips per trade, and commissions remove another 6 pips — converting a promising stream into a small loss. Without detailed logs and demo verification, this loss is easy to miss.

Conclusion — protect capital first

Free signals can be a useful learning tool if treated as education rather than a turnkey money machine. Always verify with real fills, demand documented rules, and only risk money you can afford to lose while testing. The cheapest signal is worthless if it destroys your account through hidden costs or poor risk controls.

Want signals that show full logs & execution details?

We publish timestamped historic trade logs, cost-adjusted backtests, and demo-ready packages so you can verify performance yourself before going live.

Further reading (authoritative outbound links)

For deeper background on trade execution and realistic backtesting, see resources like Investopedia, BabyPips, and academic articles on realistic trading simulations.

RTech RFX Signals
RTech RFX Signals

Actionable Forex trade ideas, transparent trade logs and backtesting tools for retail traders.

rfxsignals September 29, 2025 No Comments

Smart Money Concepts in Forex: What Your Signals Might Be Missing

Smart Money Concepts in Forex: What Your Signals Might Be Missing
How to Build a Forex Signal Dashboard with Real-Time Alerts | RFXSIGNALS

How to Build a Forex Signal Dashboard with Real-Time Alerts

Design and build a lightweight, reliable forex signal dashboard that streams signals in real time, prioritizes high-confidence alerts, and integrates with WhatsApp/Telegram for instant delivery. This guide covers architecture, data sources, alert rules, UX tips, testing and deployment.

Overview: what a signal dashboard should do

A well-built forex signal dashboard is more than a list of alerts. It should collect signals from sources, deduplicate and score them, display priority alerts, provide quick context (timeframe, reasoning, confidence), and trigger real-time notifications to traders via push, Telegram, WhatsApp, or email. The focus is speed, clarity, and low false-positive noise.

Core architectural components

Keep the architecture simple and decoupled so each part can scale independently:

  • Ingestion layer: receive signals via webhook, API, or batch CSV exports.
  • Processing & scoring: normalize timestamps, assign confidence scores, and de-duplicate.
  • Alert engine: rules for triggering notifications (thresholds, cooldowns, rate limits).
  • Dashboard UI: lightweight front-end to view, filter, and acknowledge signals.
  • Delivery & integrations: webhook to execution systems, Telegram/WhatsApp gateways, email/SMS.
  • Storage & logging: time-series DB or relational store for audits and analytics.

Data sources & normalization

Typical signal inputs include model outputs (probabilities), human-curated alerts, third-party providers, and price-event detectors (breakouts, volatility spikes). Important normalization steps:

  1. Convert all timestamps to UTC.
  2. Normalize pair names (EURUSD vs EUR/USD).
  3. Map direction values (buy/sell, long/short) to a consistent schema.
  4. Attach metadata (timeframe, model-id, confidence score, recommended SL/TP).

Scoring & priority rules

Not all signals deserve a popup. Build a scoring function that weights:

  • Model confidence / probability
  • Signal recency (newer signals rank higher)
  • Liquidity & spread conditions (e.g., avoid low-liquidity hours)
  • Cross-checks (corroboration by multiple models or indicators)

Example score formula (simple): score = 0.6 × confidence + 0.3 × corroboration + 0.1 × liquidity_score. Use score thresholds to determine whether to send mobile/popup alerts or only display in the dashboard.

Alert engine rules & rate limiting

Misconfigured alerts cause noise. Use these safety rules:

  • Cooldown per pair: don't alert the same pair more than once in X minutes unless confidence increases.
  • Max alerts per minute: global cap to avoid flooding subscribers.
  • Priority channels: high-score alerts → push & Telegram; medium → dashboard & email; low → archived for review.
  • Execution safety: block alerts during major news or during known outages.

Real-time integrations: Telegram, WhatsApp, Webhooks

Delivery options vary by audience. Telegram bots are straightforward for channels and groups; WhatsApp requires approved Business API or third-party gateway. For execution, expose a webhook to your broker/execution engine with strict authentication.

Note: Always include message metadata (signal id, timestamp, recommended SL/TP, confidence) so recipients can verify and reproduce the signal if needed.

Designing the dashboard UI (keep it lightweight)

Design principles:

  • One glance clarity: pair, direction, confidence, time, reason.
  • Color semantics: green buy, red sell, amber for medium confidence.
  • Fast filters: by pair, timeframe, confidence, source.
  • Acknowledge & comment: allow traders to acknowledge signals and add quick notes.
  • Mobile-friendly: a responsive layout or a simple PWA for push notifications.

Monitoring & observability

Track these metrics to keep your dashboard healthy:

  • Signal throughput (signals/minute)
  • Alert delivery success rate (Telegram/WhatsApp webhook status)
  • Average time from ingestion to delivery (latency)
  • False-positive rate (signals with negative expectancy)
  • User acknowledgements / click-throughs

Testing strategy before going live

Test thoroughly:

  1. Unit tests: ingestion and normalization functions.
  2. Integration tests: simulate webhook inputs and downstream delivery.
  3. Load tests: ensure the system handles burst signals (e.g., 10× expected load).
  4. Forward-test: run the dashboard in "silent mode" for 30 days and compare delivered signals vs actual price outcomes.

Security & compliance

Protect your APIs and data. Use API keys, HMAC signatures for webhooks, TLS everywhere, and role-based access in the dashboard. If you store user phone numbers, follow applicable privacy laws (GDPR, etc.) and use encrypted storage.

Deployment & cost considerations

Keep hosting simple at first:

  • Use a managed PostgreSQL or TimescaleDB for storage.
  • Host the processing on a small container cluster (e.g., AWS ECS, DigitalOcean Apps) with autoscaling.
  • Use a messaging gateway for Telegram and an approved WhatsApp Business provider for WhatsApp alerts.
  • Estimate costs: storage + compute + gateway fees (WhatsApp charges per message for Business API).

Example stack (fast, low-cost)

LayerExample
IngestionWebhook endpoints (Node/Python Flask)
ProcessingPython worker (Celery/RQ) or Node worker
StoragePostgres / TimescaleDB
DashboardReact (Vite) or simple server-side rendered pages
DeliveryTelegram bot, WhatsApp Business API, Webhooks

Operational checklist before full launch

  1. Validate timestamp alignment for all sources (UTC).
  2. Run 30-day silent forward test and review false-positive rate.
  3. Confirm delivery SLAs with messaging gateways.
  4. Define escalation rules for outages (fallback email/SMS).
  5. Prepare an onboarding guide for subscribers (how to set alerts, recommended sizes).

Related posts (internal & outbound)

Final thoughts & next steps

Start small: implement ingestion, a simple scoring rule, and a Telegram/WhatsApp delivery for high-confidence signals. Run a 30–90 day forward test in silent mode to measure latency, delivery, and signal quality. Iterate on scoring, reduce noise, and add features like acknowledgements and audit logs as you learn what users need.

Published: Reading time: ~10–12 min Tags: signal-dashboard, real-time-alerts, forex, RFXSIGNALS
rfxsignals September 29, 2025 No Comments

How to Build a Forex Signal Dashboard with Real-Time Alerts

How to Build a Forex Signal Dashboard with Real-Time Alerts
How to Build a Forex Signal Dashboard with Real-Time Alerts | RFXSIGNALS

How to Build a Forex Signal Dashboard with Real-Time Alerts

Design and build a lightweight, reliable forex signal dashboard that streams signals in real time, prioritizes high-confidence alerts, and integrates with WhatsApp/Telegram for instant delivery. This guide covers architecture, data sources, alert rules, UX tips, testing and deployment.

Overview: what a signal dashboard should do

A well-built forex signal dashboard is more than a list of alerts. It should collect signals from sources, deduplicate and score them, display priority alerts, provide quick context (timeframe, reasoning, confidence), and trigger real-time notifications to traders via push, Telegram, WhatsApp, or email. The focus is speed, clarity, and low false-positive noise.

Core architectural components

Keep the architecture simple and decoupled so each part can scale independently:

  • Ingestion layer: receive signals via webhook, API, or batch CSV exports.
  • Processing & scoring: normalize timestamps, assign confidence scores, and de-duplicate.
  • Alert engine: rules for triggering notifications (thresholds, cooldowns, rate limits).
  • Dashboard UI: lightweight front-end to view, filter, and acknowledge signals.
  • Delivery & integrations: webhook to execution systems, Telegram/WhatsApp gateways, email/SMS.
  • Storage & logging: time-series DB or relational store for audits and analytics.

Data sources & normalization

Typical signal inputs include model outputs (probabilities), human-curated alerts, third-party providers, and price-event detectors (breakouts, volatility spikes). Important normalization steps:

  1. Convert all timestamps to UTC.
  2. Normalize pair names (EURUSD vs EUR/USD).
  3. Map direction values (buy/sell, long/short) to a consistent schema.
  4. Attach metadata (timeframe, model-id, confidence score, recommended SL/TP).

Scoring & priority rules

Not all signals deserve a popup. Build a scoring function that weights:

  • Model confidence / probability
  • Signal recency (newer signals rank higher)
  • Liquidity & spread conditions (e.g., avoid low-liquidity hours)
  • Cross-checks (corroboration by multiple models or indicators)

Example score formula (simple): score = 0.6 × confidence + 0.3 × corroboration + 0.1 × liquidity_score. Use score thresholds to determine whether to send mobile/popup alerts or only display in the dashboard.

Alert engine rules & rate limiting

Misconfigured alerts cause noise. Use these safety rules:

  • Cooldown per pair: don't alert the same pair more than once in X minutes unless confidence increases.
  • Max alerts per minute: global cap to avoid flooding subscribers.
  • Priority channels: high-score alerts → push & Telegram; medium → dashboard & email; low → archived for review.
  • Execution safety: block alerts during major news or during known outages.

Real-time integrations: Telegram, WhatsApp, Webhooks

Delivery options vary by audience. Telegram bots are straightforward for channels and groups; WhatsApp requires approved Business API or third-party gateway. For execution, expose a webhook to your broker/execution engine with strict authentication.

Note: Always include message metadata (signal id, timestamp, recommended SL/TP, confidence) so recipients can verify and reproduce the signal if needed.

Designing the dashboard UI (keep it lightweight)

Design principles:

  • One glance clarity: pair, direction, confidence, time, reason.
  • Color semantics: green buy, red sell, amber for medium confidence.
  • Fast filters: by pair, timeframe, confidence, source.
  • Acknowledge & comment: allow traders to acknowledge signals and add quick notes.
  • Mobile-friendly: a responsive layout or a simple PWA for push notifications.

Monitoring & observability

Track these metrics to keep your dashboard healthy:

  • Signal throughput (signals/minute)
  • Alert delivery success rate (Telegram/WhatsApp webhook status)
  • Average time from ingestion to delivery (latency)
  • False-positive rate (signals with negative expectancy)
  • User acknowledgements / click-throughs

Testing strategy before going live

Test thoroughly:

  1. Unit tests: ingestion and normalization functions.
  2. Integration tests: simulate webhook inputs and downstream delivery.
  3. Load tests: ensure the system handles burst signals (e.g., 10× expected load).
  4. Forward-test: run the dashboard in "silent mode" for 30 days and compare delivered signals vs actual price outcomes.

Security & compliance

Protect your APIs and data. Use API keys, HMAC signatures for webhooks, TLS everywhere, and role-based access in the dashboard. If you store user phone numbers, follow applicable privacy laws (GDPR, etc.) and use encrypted storage.

Deployment & cost considerations

Keep hosting simple at first:

  • Use a managed PostgreSQL or TimescaleDB for storage.
  • Host the processing on a small container cluster (e.g., AWS ECS, DigitalOcean Apps) with autoscaling.
  • Use a messaging gateway for Telegram and an approved WhatsApp Business provider for WhatsApp alerts.
  • Estimate costs: storage + compute + gateway fees (WhatsApp charges per message for Business API).

Example stack (fast, low-cost)

LayerExample
IngestionWebhook endpoints (Node/Python Flask)
ProcessingPython worker (Celery/RQ) or Node worker
StoragePostgres / TimescaleDB
DashboardReact (Vite) or simple server-side rendered pages
DeliveryTelegram bot, WhatsApp Business API, Webhooks

Operational checklist before full launch

  1. Validate timestamp alignment for all sources (UTC).
  2. Run 30-day silent forward test and review false-positive rate.
  3. Confirm delivery SLAs with messaging gateways.
  4. Define escalation rules for outages (fallback email/SMS).
  5. Prepare an onboarding guide for subscribers (how to set alerts, recommended sizes).

Related posts (internal & outbound)

Final thoughts & next steps

Start small: implement ingestion, a simple scoring rule, and a Telegram/WhatsApp delivery for high-confidence signals. Run a 30–90 day forward test in silent mode to measure latency, delivery, and signal quality. Iterate on scoring, reduce noise, and add features like acknowledgements and audit logs as you learn what users need.

Published: Reading time: ~10–12 min Tags: signal-dashboard, real-time-alerts, forex, RFXSIGNALS
rfxsignals September 29, 2025 No Comments

Top 5 Signal Providers Compared: Accuracy, Speed & ROI

Top 5 Signal Providers Compared: Accuracy, Speed & ROI
Top 5 Signal Providers Compared: Accuracy, Speed & ROI | RFXSIGNALS

Top 5 Signal Providers Compared: Accuracy, Speed & ROI

Choosing a signal provider isn’t just about claimed returns. Accuracy, execution speed, transparency, and realistic ROI assumptions matter most. This guide compares five leading provider types, the metrics to inspect, and a practical checklist so you can pick the right service for your goals.

Why comparing signal providers properly matters

Many providers advertise high returns, but those numbers are often cleaned, backtested, or cherry-picked. A meaningful comparison focuses on repeatable metrics: accuracy (how often signals are correct relative to expectation), speed (how fast the trade can be executed at advertised price), and ROI adjusted for risk, spread and slippage. The goal is to identify providers that deliver consistent edge under realistic conditions.

How we compare providers — the framework

We use five dimensions to compare providers:

  1. Accuracy: percent of winning trades vs total trades and expectancy.
  2. Speed & latency: time from signal to execution and slippage statistics.
  3. Realized ROI: net of spreads, commissions and typical slippage.
  4. Transparency & track record: live verified results, sample size, and reporting method.
  5. Risk management: position sizing rules, stop discipline, and max exposure limits.

The top 5 provider types (what you’ll usually find)

Providers cluster into types — each has strengths and trade-offs:

1. Human-curated signal services (experienced traders)

Pros: context-aware, adaptive to macro events, often conservative. Cons: limited capacity, human bias, slower execution. Best for: discretionary traders who want explanation & trade context.

2. Algorithmic/AI signal providers

Pros: scans many markets, runs 24/7, fast. Cons: risk of overfitting, opacity, needs monitoring. Best for: high-frequency or systematic traders comfortable with automation.

3. Copy-trading platforms (social/copy services)

Pros: easy to follow proven traders, good for passive users. Cons: crowd impact, leader survivorship bias, and platform risk. Best for: beginners who prefer hands-off execution—test with small capital first.

4. Hybrid services (signals + execution API)

Pros: combines algorithmic signal generation with human oversight or execution automation. Cons: higher cost, complexity. Best for: traders who want the speed of automation and safety of human checks.

5. Broker-provided signals & in-platform indicators

Pros: seamless execution, integrated. Cons: potential conflict of interest, limited transparency. Best for: traders wanting simplicity but verify fills carefully.

Quick comparison table (what to look for)

Provider TypeAccuracySpeedRealistic ROIBest For
Human-curatedModerate (50–65%)Slow-ModerateMediumDiscretionary traders
Algorithmic/AIVariable (45–70%)FastHigh (if robust)Systematic traders
Copy-tradingDepends on leaderVariesVariableBeginners
HybridHigher (if well-managed)FastHighSerious traders
Broker signalsModerateFastLow-MediumConvenience seekers

Deep dive: accuracy vs expectancy

Accuracy alone is misleading. A strategy with 70% wins but very small winners and large, rare losers can be disastrous. Expectancy — average P&L per trade — is the better single-number summary: Expectancy = (Win% × AvgWin) − (Loss% × AvgLoss). When comparing providers, request both win-rate and average win/loss size, not only percent winners.

Execution speed & slippage — the hidden ROI killer

A provider might publish fast signals, but your fills determine real ROI. If signals are delivered by chat or email, execution may be delayed, increasing slippage. Providers that offer direct API execution or broker integration generally minimize this problem. Always test on a demo account to measure real slippage against the provider’s claims.

Transparency & statistical validity

Beware of short track records and tiny sample sizes. A provider with 20 trades and 80% wins is far less convincing than one with 2,000 trades and 55% wins. Ask for: live verified statements (e.g., Myfxbook, broker statements), raw signal logs, and clear definitions of how they calculate returns.

Questions to ask any signal provider

  • Do you publish live results or only backtests?
  • How do you handle spread, slippage and commissions in reported ROI?
  • Can I get raw signal logs to independently backtest?
  • What’s your typical time-to-fill and recommended execution method?
  • How many concurrent clients use the same signal (crowd impact)?
  • What are the maximum drawdown and worst monthly loss historically?

A practical selection checklist (use before subscribing)

  1. Verify > 300 live trades or multi-year live track record.
  2. Confirm provider reports ROI net of realistic spreads and commissions.
  3. Forward-test on demo for 30–90 days and record slippage.
  4. Prefer providers that offer API/broker integration for fast fills.
  5. Check risk controls: max exposure, size caps, stop enforcement.

Case study (how small slippage reduces ROI)

Imagine a provider with 100 trades/month average return 1% per trade gross. If average slippage+spread eats 0.3% per trade, monthly net drops 30%. Over time, that gap compounds — so execution matters as much as signal accuracy.

How RFXSIGNALS approaches provider evaluation

We combine automated backtesting, live forward-samples, and independent verification. Our priority: realistic reporting, clear risk rules, and API execution where possible. If you want, we publish a sample signal log and a demo-forward test so subscribers can independently verify performance.

Pro tip: Always align signal risk with your personal risk budget. A high-ROI provider with extreme drawdowns may be unsuitable if you can’t stomach the volatility.

Related posts (internal & outbound link opportunities)

Final checklist & next steps

When choosing a signal provider, prioritize transparency, realistic ROI calculations, and execution quality. Start small, forward-test, and only scale after verifying fills, slippage, and risk controls in your broker. If you want a personalized shortlist based on your capital, pair preferences and risk tolerance, reply with "Shortlist me" and we’ll prepare a tailored comparison.

Published: Reading time: ~9–11 min Tags: signal-providers, forex-signals, ROI, execution
rfxsignals September 29, 2025 No Comments

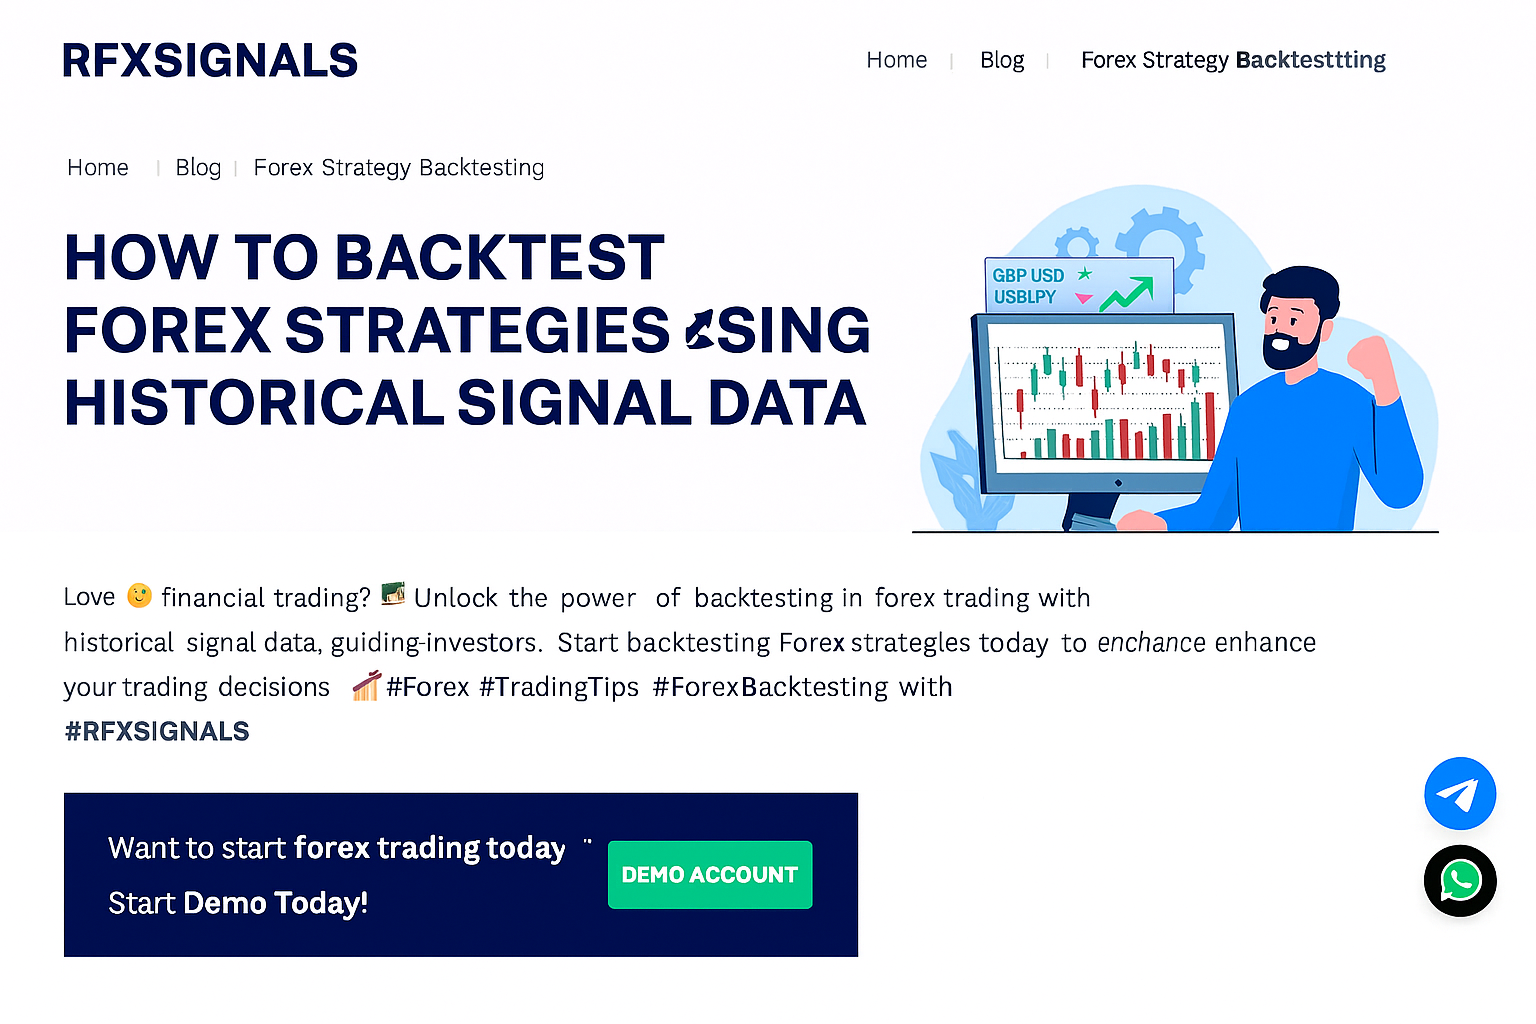
How to Backtest Forex Strategies Using Historical Signal Data

. How to Backtest Forex Strategies Using Historical Signal Data
How to Backtest Forex Strategies Using Historical Signal Data | RFXSIGNALS

How to Backtest Forex Strategies Using Historical Signal Data

A practical, step-by-step framework for testing trading signals on historical FX data — learn how to prepare data, choose metrics, run tests, and avoid common pitfalls so your live trading has the best chance to succeed.

Why backtesting with historical signal data matters

Backtesting converts signals into measurable evidence. Instead of trusting memory or gut, you validate how a signal would have performed across many market cycles. Historical signal testing helps uncover edge, estimate expectancy, reveal drawdowns, and spot curve-fitting before real capital is at risk.

Step 1 — Define the strategy and hypothesis

Clear rules make reliable tests. Write a one-line hypothesis: e.g., “Buy EUR/USD at breakout of 1-hour consolidation when RSI(14)<30; TP=40 pips; SL=20 pips.” Record timeframes, instruments, signal conditions, trade sizing rules, and execution assumptions (fills/slippage).

Checklist

  • Signal trigger (exact conditions)
  • Entry, stop, and take-profit rules
  • Position sizing and risk per trade
  • Trading hours and instrument list
  • Assumptions about slippage, spread, commissions

Step 2 — Gather reliable historical signal & price data

Use tick or minute price series when possible, and ensure your historical signals are timestamped consistently (UTC preferred). Common sources: broker historical dumps, premium tick data vendors, and exported signal logs. Keep a separate log of raw signals (timestamp, pair, direction, reason) and price series — never edit the raw signal file after testing starts.

Tip: Keep two folders: raw_data/ (immutable) and test_data/ (preprocessed). Track a data checksum or version so results remain reproducible.

Step 3 — Clean & align data (most common source of errors)

Misaligned timestamps and missing candles are the top causes of false results. Convert all times to one timezone, handle DST if your source uses local time, and fill gaps (or label them). Make sure the signal timestamp matches the price you assume for entry (open, close, mid, ask, or bid?).

Quick data hygiene steps

  1. Normalize timestamps to UTC.
  2. Remove duplicates and repair missing ticks/candles.
  3. Match signal timestamp to bar close or next bar open (explicitly).
  4. Apply realistic spreads, slippage, and commissions.

Step 4 — Choose backtesting method & tools

You can backtest with Excel (small sample), Python (pandas/backtrader/zipline), or specialized platforms (MetaTrader strategy tester, TradingView Pine Script, Amibroker). For signal-level testing (not rule re-test), feed your signal log into the engine that replays price series and enforces your execution rules.

Recommended approach for signal data

Replay price series bar-by-bar, check for signal triggers at the exact timestamps, and open trades using the assumed execution price (next-bar open or intrabar price). If you lack tick data, conservatively assume worst-case fill within the next bar range.

Step 5 — Define metrics that matter

Beyond net profit, track these metrics:

  • Expectancy = (Average win × Win rate) − (Average loss × Loss rate)
  • Sharpe ratio (risk-adjusted returns)
  • Max Drawdown (peak-to-trough drop)
  • Profit factor = Gross profit / Gross loss
  • Number of trades (statistical significance)
  • Average holding time

Step 6 — Run tests: in-sample, out-of-sample & walk-forward

Split your data: keep an in-sample period to iterate and an out-of-sample period to validate true performance. Walk-forward testing mimics live re-optimization and is ideal when you tune parameters.

Step 7 — Stress test and sensitivity analysis

Introduce realistic frictions: larger spreads, random slippage, missed fills during news, and comission increases. Check how small parameter changes affect performance — if tiny changes destroy the edge, the system is likely overfit.

Step 8 — Review common failure modes

  • Data snooping / curve fitting
  • Survivorship bias (ex: only testing pairs that survived)
  • Look-ahead bias (using future data in rules)
  • Incorrect timezone alignment

Step 9 — Convert results to a live plan

If the backtest passes statistical and stress checks, write a clear execution plan: starting capital, risk % per trade, live monitoring rules, stop-loss behavior, and a monthly review schedule. Always forward-test on a small live/sample account before scaling.

Step 10 — Document everything and keep reproducible logs

Store code, raw data, test outputs, and the exact environment (Python versions, platform settings). Use a test report template showing hypothesis, assumptions, metrics, and action decision (deploy / iterate / discard).

Backtesting report template (short):
  • Hypothesis & rules
  • Data sources & timeframes
  • Assumptions (spread, slippage, commissions)
  • In-sample / Out-of-sample periods
  • Key metrics & charts (equity curve, DD)
  • Decision: Deploy / Further test / Discard

Related posts (internal linking for SEO)

Final checklist before live deployment

  1. Reproduce test on a clean machine with raw data.
  2. Run out-of-sample and walk-forward tests.
  3. Stress test with worse spreads/slippage.
  4. Document the live execution plan and monitoring rules.
  5. Begin with small capital & scale systematically.

If you want a ready-to-run backtest template (Python/pandas or MT5 script) specific to your historical signal logs, reply with "Send template" and attach a small sample of your signal CSV (timestamp,pair,direction,reason) — I'll format a reproducible starter.

Published: Reading time: ~8–10 min Tags: backtesting, forex, signals, risk management
rfxsignals September 25, 2025 No Comments

How to Create Your Own Forex Strategy and Test It

How to Create Your Own Forex Strategy and Test It
How to Create Your Own Forex Strategy and Test It | RFXSignals
Free Signals • Community: Telegram

How to Create Your Own Forex Strategy and Test It

Overview: Building a forex strategy that fits your capital, schedule and temperament is the single most important step toward consistent trading. This practical guide walks you through idea generation, defining rules, backtesting, forward-testing, measuring performance, and iterating — plus how to use RFXSignals resources and community channels for templates, trade examples, and checklist downloads.

Want ready-made templates & sample journals?

Join our Telegram & WhatsApp communities to get strategy templates, Excel backtest sheets, and example trade logs shared weekly.

Step 1 — Start with a clear objective

Define what you want the strategy to achieve. Be specific:

  • Timeframe — scalping (M1–M5), intraday (M15–H1), swing (H4–Daily).
  • Target return & risk — e.g., 10% annual growth with max drawdown 8%.
  • Max trade frequency — how many trades per day/week you can realistically manage.

Having a clear objective helps you choose indicators, timeframes and rules that match your life and capital.

Step 2 — Define your edge (idea)

Your edge can be a simple price-action setup, a technical filter, or a hybrid. Examples of edges:

  • Breakout of consolidation confirmed by ATR expansion.
  • Pullback to EMA(50) in the direction of daily trend with RSI confirmation.
  • SMC order block retest on H4 leading to continuation.

Write the idea in one sentence. Example: “Buy EUR/USD on H1 when price pulls back to the 50 EMA and forms a bullish rejection candle while Daily trend is up.”

Step 3 — Turn the idea into unambiguous rules

Rules must be testable. Convert fuzzy language into precise conditions:

  • Entry: EMA(50) slope > 0 on Daily; H1 price closes above EMA(50) after a wick rejection of at least 0.5 × ATR(14).
  • Stop: place stop 1.2 × ATR(14) below entry or below the structure low.
  • Target: 2× risk or trailing using ATR-based stop.
  • Position sizing: risk 0.5% per trade.

Document every parameter so a backtest can apply them exactly.

Step 4 — Collect & prepare data for backtesting

Good data is essential. Use reliable historical price with spreads and commission where possible:

  • Get at least 2–5 years of tick or minute data for intraday systems; daily OHLC is fine for swing strategies.
  • Include realistic spread and slippage assumptions (e.g., 0.5 pip for EUR/USD + 1 pip slippage for market entries).
  • Correct for missing data and time-zone mismatches.

Step 5 — Backtest systematically

Start with simple tools—Excel for manual rules, or a platform like TradingView (Pine), MetaTrader (EA), or Python for automated testing. Key steps:

  1. Implement exact entry/exit logic.
  2. Run the test across your dataset and record trades.
  3. Simulate commissions, spread and realistic fills.

Important metrics to record:

  • Profit factor, expectancy, win rate, average win/loss.
  • Maximum drawdown and run-up behavior.
  • Average trade length and number of trades per period.
Tip: Don’t obsess over win rate. A low win rate system can be profitable if the winners are big enough (positive expectancy). Focus on expectancy and drawdown control.

Step 6 — Walk-forward & out-of-sample testing

To reduce curve-fitting risk, apply these practices:

  • Split data: use 70% in-sample for development and 30% out-of-sample for testing.
  • Walk-forward: re-optimize on a rolling window (e.g., optimize on 1 year, test on next 6 months) to validate stability.
  • Parameter sensitivity: test a range of parameters (e.g., EMA 45–55) to ensure small changes don’t destroy results.

Step 7 — Forward-test on demo (paper-trade)

Run the system on a live demo account for a minimum of 4–12 weeks, using the exact money management and execution rules. Forward testing verifies real-world behavior (slippage, partial fills, human reaction) that backtests may not capture.

Step 8 — Measure & monitor portfolio metrics

Track both per-trade and portfolio-level metrics:

  • Monthly P/L and drawdown curves.
  • Expectancy (average R × win rate).
  • Sharpe or Sortino ratios, and trade frequency consistency.

Step 9 — Iterate: improve, not overfit

Use insights from backtest and forward-test to improve the strategy. Typical improvements:

  • Add a filter to avoid low-probability regimes (e.g., ADX < 18 blocks trend trades).
  • Adjust position sizing or incorporate volatility scaling (risk per trade proportional to ATR).
  • Introduce execution rules (delay entries at news time, avoid thin liquidity periods).

Every change should be retested out-of-sample to ensure robustness.

Step 10 — Deployment & risk controls

When you go live with real capital:

  • Start small (10–25% of demo sizing) and scale up as you confirm live performance.
  • Implement portfolio-level risk caps: daily loss limit, max open risk, and monthly drawdown stop.
  • Keep automated alerts and a manual override to pause trading on anomalies.

Practical templates & journal

Maintain a trade journal with these fields: date, pair, timeframe, strategy tag, entry, stop, target, risk (%), outcome, emotion, and lesson learned. RFXSignals members can request sample Excel templates and backtest spreadsheets in our Telegram/WhatsApp channels.

Link Building & Funnel — How to use this article to grow traffic

Checklist before you call a strategy 'ready'

  • Backtested with 2+ years of realistic data (spreads & slippage included).
  • Out-of-sample tests show consistent edge.
  • Forward-tested on demo for 4–12 weeks with positive expectancy.
  • Defined position sizing and portfolio risk limits.
  • Trade journal and routine in place for ongoing improvement.

Need strategy templates or a walkthrough?

Join RFXSignals to download backtest spreadsheets, demo templates and example trade logs — or ask in Telegram for a free review of your strategy draft.

Conclusion & next steps

Creating your own forex strategy is iterative work: idea → rules → backtest → forward-test → live with controls. Keep changes measured, avoid overfitting, and rely on data-driven decisions rather than hope. Use the RFXSignals community for templates, peer reviews, and real-world examples to accelerate your learning curve.

Disclaimer: This article is educational and not financial advice. Forex trading carries risk — always test thoroughly on demo accounts and trade only with capital you can afford to lose.