rfxsignals October 9, 2025 No Comments

Tamil-English: What Is Margin Call?

Tamil-English: What Is Margin Call?
What Is Margin Call? | Tamil-English | YOUR_DOMAIN

What Is Margin Call? — Tamil & English Explanation

By Approx. 9–12 min read
Learn margin calls in simple words — English explained with Tamil translations for easier understanding.

In forex and CFD trading, a margin call is a warning from your broker that your account equity has fallen below the required maintenance margin. If not corrected, the broker may automatically close positions to prevent further losses.

(Forex மற்றும் CFD வர்த்தகத்தில், Margin Call என்பது உங்கள் ப்ரோக்கர் உங்கள் கணக்கின் ஈக்விட்டி தேவையான பராமரிப்பு மார்ஜினிற்குக் கீழ்நிலையாகவுள்ளதா எனக் கண்டுகொண்டு உங்களுக்கு தகவல் அளிக்கும் எச்சரிக்கை ஆகும். சரிசெய்யப்படாவிட்டால், மேலதிக இழப்புகளைத் தடுக்கும் நோக்கில் ப்ரோக்கர் positions-ஐ தானாக முடக்கலாம்.)

What is margin and leverage?

Margin is the money you need to put up to open a leveraged position. Leverage lets you control a larger position with a smaller amount of capital. For example, 1:100 leverage means £1,000 controls £100,000 of currency.

(Margin என்பது லெவரேஜ் கொண்ட ஒரு நிலையை திறக்க தேவையான பணமாகும். லெவரேஜ் உங்கள் குறைந்த பணத்துடன் பெரிய நிலையை கட்டுப்படுத்த உதவுகிறது. உதாரணமாக, 1:100 லெவரேஜ் என்றால் £1,000 மூலம் £100,000 அளவிலான நாணயத்தை கட்டுப்படுத்தலாம்.)

Maintenance margin vs initial margin

When you open a position, the broker requires an initial margin. The maintenance margin is the minimum equity you must keep to keep positions open. A margin call occurs when equity falls below the maintenance margin.

(நீங்கள் ஒரு நிலையை திறக்கும் போது, ப்ரோக்கர் ஆரம்ப_margin-ஐ அவசியம் கேட்கும். Maintenance margin என்பது நிலைகள் திறந்திருக்க கடைசியாகவே வைத்திருக்க வேண்டிய குறைந்தமதிப்பு. Equity maintenance margin-க்கு கீழாகும் போது margin call ஏற்படும்.)

How margin calls happen — a simple example

Imagine you have $1,000 in your account and open a position that requires $100 margin (with leverage). If your open positions move against you and losses reduce your equity to $80, and the maintenance margin is $100, the broker will issue a margin call or start closing positions.

(உங்களிடம் $1,000 இருப்பதாக நினைத்துக் கொள்ளுங்கள்; ஒரு நிலையைத் திறக்க $100 margin தேவைப்படுகிறதெனில் (லெவரேஜுடன்). உங்கள் நிலைகள் எதிர்மறையாக செல்லும்போது இழப்புகள் உங்கள் ஈக்விட்டியை $80 ஆகக் குறைத்து விட்டால், மற்றும் maintenance margin $100 என்றால், ப்ரோக்கர் margin call-ஐ அனுப்பலாம் அல்லது நிலைகளை மூடலாம்.)

Margin call vs stop out

A margin call is usually a warning. A stop out level is when the broker starts liquidating positions automatically — typically at a lower equity level than the margin call. Different brokers have different thresholds; check your broker's policy.

(Margin call என்பது பொதுவாக ஒரு எச்சரிக்கை. Stop out என்பது ப்ரோக்கர் தானாகவே நிலைகளை likvidate செய்யத் தொடங்கும் நிலை — இது பொதுவாக margin call-க்குப் கீழான ஒரு ஈக்விட்டி நிலை. ப்ரோக்கர்களுக்கு வெவ்வேறு விதமான தகுதிகள் உள்ளன; உங்கள் ப்ரோக்கரின் கொள்கையைப் பார்க்கவும்.)

Common causes of margin calls

  • High leverage without proper risk control
  • Lack of stop loss or too-tight stop loss that hits during volatility
  • Holding large positions relative to account size
  • Unexpected high-impact news or gaps

(Margin call-க்கு பொதுவான காரணங்கள்: அதிக லெவரேஜ், போதுமான ரிஸ்க் கட்டுப்பாடு இல்லாமை, stop loss இல்லாமை அல்லது மிக நெருங்கிய stop loss, கணக்கு அளவுக்கு அதிகமான நிலைகள், எதிர்பாராத உயர்மட்ட செய்திகள்.)

How to avoid margin calls — practical tips

1. Use conservative leverage: Lower leverage reduces the chance that small price moves wipe out equity.

1. பாதுகாப்பான லெவரேஜ் பயன்படுத்துங்கள்: குறைந்த லெவரேஜ் சிறிய விலையின் மாற்றங்களால் ஈக்விட்டி அழிக்கப்படுவதன் வாய்ப்பை குறைக்கிறது.

2. Always place stop losses: Stops limit downside and prevent a small loss turning into a stop out.

2. எப்போதும் stop loss வைக்கவும்: downside-ஐ கட்டுப்படுத்தும் மற்றும் சிறிய இழப்புகள் stop out-ஆக மாறாமல் காக்கும்.

3. Size positions appropriately: Use position-sizing rules like risking 0.5–2% of account per trade.

3. நிலை அளவீட்டை சரியாக பணியுங்கள்: ஒரு வர்த்தகத்திற்கான 0.5–2% என்ற போன்று விதிகளை பின்பற்றுங்கள்.

4. Monitor news and volatility: Avoid large positions before major news releases.

4. செய்திகள் மற்றும் வேகத்தை கவனியுங்கள்: பெரிய செய்திகளுக்கு முன்னர் பெரிய நிலைகளை பிடிக்க வேண்டாம்.

5. Keep a buffer: Maintain extra equity above the required maintenance margin to absorb normal fluctuations.

5. ஒரு தொடுப்பு வைத்திருங்கள்: maintenance margin-க்கு மேலாக கூடுதல் ஈக்விட்டி வைத்திருங்கள்.

What to do if you get a margin call

Don’t panic. Actions you can take:

  • Add funds to your account to restore margin
  • Reduce exposure by closing or reducing losing positions
  • Adjust stop losses if appropriate (but avoid moving stops to chase price)

பanik் கொள்ளாதீர்கள். நீங்கள் செய்யக்கூடியவை: கணக்கில் பணம் சேர்க்கவும், இழப்பான நிலைகளை மூடவும், stop loss-ஐ சரிசெய்யவும் (ஆனால் price-ஐ பின்தொடர்ந்து stop-ஐ நகர்த்தாதீர்கள்).

Broker policies and margin requirements

Different brokers list initial and maintenance margin requirements on their websites. Some brokers offer negative balance protection which prevents your account from going below zero; this is useful for retail traders. Always read the fine print.

வெவ்வேறு ப்ரோக்கர்கள் தங்கள் வலைத்தளங்களில் ஆரம்ப மற்றும் பராமரிப்பு மார்ஜின் தேவைகளை குறிப்பிடுகின்றனர். சில ப்ரோக்கர்கள் negative balance protection-ஐ வழங்குகின்றனர்; இது உங்கள் கணக்கு பூஜ்ஜியத்தைக் கீழ்க்கொண்டுவராமல் பாதுகாக்கும். சிறு வர்த்தகர்களுக்கு இது பயனுள்ளது. நன்றாக fine print-ஐப் படியுங்கள்.

Examples and calculator

Here is a simple formula to estimate margin used: Margin = (Notional Value) / Leverage. Use this to plan position sizes. Many brokers also provide margin calculators — use them to verify before placing trades. (Inbound link below.)

Margin-ஐ கணக்கிட சுருக்கமாக: Margin = (Notional Value) / Leverage. நிலை அளவை திட்டமிட இதைப் பயன்படுத்துங்கள். பல ப்ரோக்கர்கள் margin calculators வழங்குகின்றனர் — வர்த்தகத்தை இடுவதற்கு முன் அவற்றைப் பயன்படுத்துங்கள்.

Related reading

Common myths about margin calls

Myth: Margin calls mean bad brokers. Reality: Margin calls are a risk management tool; frequent margin calls usually mean the trader is overleveraged or lacks risk rules.

தவறான நம்பிக்கை: Margin call என்றால் ப்ரோக்கர் மோசமானவர். உண்மை: Margin call என்பது ஒரு அபாயக் கட்டுப்பாடு கருவி; அடிக்கடி margin call வருவது என்றால் வர்த்தகர் அதிக லெவரேஜ் பயன்படுத்துகிறான் அல்லது ரிஸ்க் விதிகள் இல்லை.

Final tips

  1. Use risk per trade limits.
  2. Prefer lower leverage when starting out.
  3. Keep emergency funds to top up margin if needed.
  4. Read your broker's margin policy and stop-out levels.

இறுதி குறிப்புகள்: வர்த்தகத்திற்கான ரிஸ்க் எல்லைகளைப் பயன்படுத்தவும்; துவக்கத்தில் குறைந்த லெவரேஜை விரும்புங்கள்; அவசர நிதிகளை வைத்திருங்கள்; உங்கள் ப்ரோக்கரின் margin கொள்கையைப் படியுங்கள்.

Quick summary (English)

A margin call is a broker warning when your equity falls below maintenance margin. Avoid it with conservative leverage, position sizing, stops, and a cash buffer.

சுருக்கம் (தமிழில்)

Margin call என்பது நீங்கள் வைத்திருக்க வேண்டிய பராமரிப்பு மார்ஜினுக்குக் கீழாக உங்கள் ஈக்விட்டி குறைவாகினால் வரும் ப்ரோக்கர் எச்சரிக்கை. இதை தடுப்பதற்கு பாதுகாப்பான லெவரேஜ், சரியான நிலை அளவு, stop loss மற்றும் பணத் தொகை பாதுகாவலையைப் பயன்படுத்துங்கள்.

Disclaimer: Trading forex involves risk. This article is educational and not financial advice.

rfxsignals October 9, 2025 No Comments

Forex Trading Psychology: Tips for Beginners

Forex Trading Psychology: Tips for Beginners
Forex Trading Psychology: Tips for Beginners | YOUR_DOMAIN

Forex Trading Psychology: Tips for Beginners

By 8 min read
Start with mindset. Successful forex trading is 80% psychology and 20% strategy. This guide gives beginner-friendly, actionable tips to manage emotions, control risk, and build a consistent trading routine.

Forex trading attracts beginners with the promise of fast returns, 24/5 markets and easy access. But beyond charts and indicators, the most decisive factor for long-term success is psychology — discipline, patience, and emotional control. In this article you’ll learn simple, repeatable habits that protect your capital and help you trade with confidence.

1. Understand why psychology matters

Markets don’t care about your feelings. They only respond to supply and demand. However, traders are human: fear causes missed opportunities and greed fuels reckless risking. Understanding the role of the mind turns those emotional reactions into manageable inputs instead of destructive forces.

2. Start with a trading plan — and follow it

A trading plan is your instruction manual. It defines:

  • Markets & timeframes you trade
  • Entry and exit rules
  • Risk per trade (e.g., 0.5–2% of account equity)
  • Maximum daily/weekly drawdown thresholds
Consistently following a written plan reduces emotional decision-making and makes performance measurable.

3. Use risk management as your first defense

Proper risk management is the mechanical removal of emotion. Limiting risk per trade to a small, predetermined percent of your account ensures you can survive losing streaks and keep trading. Use stop-losses and position sizing calculators to enforce this rule. Remember: preserving capital is more important than pursuing large wins.

4. Control emotions with simple rules

Two common traps are revenge trading and overtrading. Revenge trading is trying to recover losses quickly — usually leading to bigger losses. Overtrading often happens when traders chase setups without waiting for confirmed signals. Use simple behavioral rules such as:

  • Stop trading after 3 losing trades in a row for the day.
  • Take breaks when feeling stressed, tired, or distracted.
These rules protect both capital and mental clarity.

5. Keep a trade journal — and be brutally honest

A trade journal is both a record and a feedback loop. Record entries include date/time, pair, timeframe, entry/exit, stop-loss, take-profit, outcome, and a short note on why you entered. Every week, review your journal and look for patterns: are you letting winners run? Are you cutting winners too early? Are you frequently entering around news when volatility spikes? The journal turns emotion into data that can be improved.

6. Build routines that support discipline

Successful traders rely on consistent routines. Create a pre-market checklist: check economic calendar events, confirm open positions, confirm risk use, and note high-level bias. After-market routines include reviewing trades and logging outcomes. Rituals make discipline automatic and reduce the need for willpower in the heat of the trade.

7. Learn to accept uncertainty

No trade is certain. Lose the illusion of control and focus on probabilities. If your edge wins 55% of the time with a favorable risk-reward, that edge will produce profits over many trades. Obsessing over single outcomes increases stress and leads to poor choices.

8. Practice with small size and scale up

Start trading live with very small sizes or use a demo account for pattern recognition and platform familiarity. As your journal proves consistency and your psychological responses stabilize, scale position size slowly. Increasing size too quickly invites strong emotional reactions that break rules.

9. Use automation where appropriate

Automation — alerts, limit orders, or algorithmic entries — removes emotional latency. If you consistently struggle to place an order at a planned price, automation ensures the execution matches your plan. Many traders combine manual analysis with automated execution for best results.

10. Manage stress outside trading

Healthy sleep, exercise, and nutrition improve decision-making. Trading performance is often a lagging indicator of lifestyle quality. If you’re chronically tired or stressed, your judgment will decline. Prioritize well-being like you would risk management.

11. Avoid information overload

Beginner traders often chase every indicator, system, or signal. This creates confusion and inconsistent decision-making. Limit yourself to one or two timeframes and a couple of indicators that complement your price-action understanding. Less noise equals clearer choices.

12. Create measurable performance metrics

Set objective metrics: monthly return target, max drawdown, win rate, average R (reward-to-risk) per trade. Measure these consistently. If a metric drifts outside acceptable bounds, stop trading and analyze. Clear metrics remove subjective judgments and prompt data-driven adjustments.

13. Learn from experienced traders — but adapt

Seek mentors, public trade critiques, or community feedback, but avoid mindlessly copying others. Each trader has a unique temperament and capital base. Learn principles, then adapt them into a plan that suits your personality and schedule.

14. Recovering from losses: practical steps

Losses are inevitable. When you encounter a drawdown, reduce position sizes and return to fundamentals: check your journal, re-run your edge proof (backtesting), and if necessary, take a short break. Trying to 'win back' losses quickly is a psychological trap that usually worsens the situation.

15. Final checklist before you trade

  1. Do you have a plan for this trade? (entry, stop, target)
  2. Is your position size within risk limits?
  3. Are there major news events that could affect this pair?
  4. Do you feel emotionally stable right now to execute the trade?

Quick tip

If you feel impulse to change the plan mid-trade, step away and wait 30 minutes. Most impulsive decisions fade when given time.

Related reading

Conclusion

Forex trading psychology is a practice, not an innate trait. By building a written plan, limiting risk, keeping a disciplined routine, and journaling trades, beginners can reduce emotional mistakes and increase the probability of long-term success. The market will always be noisy — your job is to manage what’s inside your control: your plan, your risk, and your reactions.


Disclosure: Trading forex involves risk. Past performance is not indicative of future results. Always trade within your risk tolerance.

rfxsignals October 7, 2025 No Comments

How to Read a Forex Chart (Tamil-English)

How to Read a Forex Chart (Tamil-English)

How to Read a Forex Chart — Tamil & English Guide

ஃபோரெக்ஸ் சார்டை எப்படி வாசிப்பது — தமிழ் மற்றும் ஆங்கில வழிகாட்டி
Reading time: ~9–11 mins • Updated:

Learn the fundamentals of reading forex charts: candlesticks, timeframes, trend structure, support & resistance, indicators, and a simple 8-step trade checklist — explained in English with Tamil translations so beginners from Tamil-speaking regions can follow easily.

இந்தக் கட்டுரையில், கொண்டு-, நேரக் காலங்கள், மாடல்கள், மற்றும் நடைமுறையான பரீட்சை பட்டியலுடன் கூடிய எளிய பயிற்சி வழிகாட்டிகள் உள்ளன.
Chat on WhatsApp Join our Telegram
Need a Tamil PDF or video?
Contact us

1. Candlesticks — the language of price

Candlesticks show four prices: open, high, low and close (OHLC). A candle body represents the open-to-close range and the wicks (shadows) show extremes. Learn a few patterns: pin bar (rejection), engulfing (momentum), doji (indecision).

கேண்டில்ஸ்டிக்கள் நான்கு விலைகளை காட்டுகின்றன: ஓபன், ஹை, லோ மற்றும் க்ளோஸ் (OHLC). சில பொதுவான மாடல்களை கற்றுக்கொள்ளுங்கள்: பின் பார் (மீறுதல்), எங்கல்ஃபிங் (வலிமை), டோஜி (மறுப்பு).

2. Timeframes — which chart to use

Charts come in multiple timeframes: 1m, 5m, 15m, 1H, 4H, Daily, Weekly. Higher timeframes give stronger, more reliable signals but slower trades. Choose timeframe based on style: scalpers (1–15m), intraday (15m–1H), swing (4H–Daily), position (Daily+).

காலக் காலங்கள்: உயர்ந்த காலங்கள் அதிக நம்பகத்தன்மை உண்டு ஆனால் மெதுவாக நடக்கின்றன. உங்கள் வர்த்தக பாணிக்கு ஏற்றவை தேர்வு செய்யுங்கள்.

3. Trend & Market Structure

Identify trend by price swings: higher highs & higher lows = uptrend; lower highs & lower lows = downtrend. Mark swing highs and lows to understand structure. Trendlines and moving averages (e.g., 50/200 SMA) help visualize direction.

உயர்வு உயரங்கள் மற்றும் உயர்ந்த தாழ்வுகள் என்றால் மேல்நோக்கி போக்கு; கீழ்நோக்கி போக்கு என்பது விலை அமைப்பால் அறிகுறியானது.

4. Support & Resistance (S/R)

Support is a price level where buyers historically step in; resistance is where sellers appear. Draw horizontal levels at previous swing highs/lows and round numbers (e.g., 1.2000). These levels act as targets, stops, or decision zones.

முந்தைய சுவிங் உயரங்கள்/தாழ்வுகளில் ஹாரிசொண்டல் ஆதரவு/எதிர்ப்பு நிலைகளை அடிக்கடி காணலாம் — இவை நிதி முடிவுகளுக்குப் பயன்படும்.

5. Volume & Tick Activity (context)

Volume (where available) or tick activity confirms moves — strong price move with high volume is more trustworthy. Many forex retail platforms lack true volume; use proxies (broker tick volume) or focus on price action.

பல வணிக தளங்களில் உண்மையான வால்யூம் கிடையாது — broker tick volume போன்ற proxy-களை பயன்படுத்துங்கள் அல்லது விலையியல் செயல்பாட்டை அதிகரிக்கவும்.

6. Indicators — tools, not rules

Popular indicators: Moving Averages (SMA/EMA), RSI, MACD, ATR. Use indicators for confirmation — don’t let them replace structure. Example: use ATR for stops, RSI for overbought/oversold context, MA for trend filter.

அயக்கியிகள் உதவிகள் மட்டுமே — அவர்கள் உங்களை வழிநடத்த உதவுவர், உத்தரவாக அல்ல.

7. Entry & Exit Principles

A simple repeatable plan: (1) identify trend (higher timeframe), (2) wait for pullback to S/R or MA, (3) confirm with a price action signal (pin/bar/engulf), (4) place stop beyond structure, (5) set target using next S/R or R:R ratio (1:2 or 1:3).

ஒரே மாதிரி பிளான்: பருப்பு-பின்னால் S/R க்கு வரும்போது, ஒரு உறுதிப்படுத்தும் மணி வழி பார்த்து நுழையவும் மற்றும் நிலைகளை அமைக்கவும்.

8. Multiple Timeframe Analysis (MTF)

Use higher timeframe for bias (Daily/4H) and lower timeframe for precise entries (1H/15m). Only take trades in the direction of the higher-timeframe trend to improve odds.

உயர்ந்த நேர அட்டவணை முனைப்பை நிர்ணயிக்கிறது; குறைந்த நேர அட்டவணை உங்களுக்கான நுழைவேலை தரும்.

9. Common Chart Patterns

Recognize patterns: Double Top/Bottom, Head & Shoulders, Triangles, Flags. Patterns are probability tools — measure the pattern height for targets and confirm breakout with retest if possible.

வகைகள்: இரட்டை உச்சி/அடுக்கு, தலை மற்றும் தோள்கள், திக்டிகள் — ரீதியாகப் பயன்படுத்தவும்.

10. Practical 8-step Chart Checklist (use before every trade)

  1. Higher-timeframe trend: bullish / bearish / sideways? (உயர்தரம் போக்கு)
  2. Identify nearest support/resistance and round numbers. (நெருங்கிய S/R)
  3. Check volatility (ATR) and session liquidity. (அசைவம் & ATR)
  4. Wait for pullback to structure or MA. (பின்னடைவு)
  5. Confirm with price action candle (pin, engulf). (உறுதிப்படுத்தல்)
  6. Calculate position size using % risk & SL pips. (அளவை கணக்கு)
  7. Place stop beyond structure and set TP (1:2+ or S/R target). (SL/TP அமைப்பு)
  8. Journal the trade and review outcome. (ஜர்னல் & மீளாய்வு)
இந்த பட்டியலை ஒவ்வொரு வர்த்தகத்துக்கும் பயன்படுத்துங்கள் — அது ஒழுங்குமுறை மற்றும் மேம்பாட்டுக்கு உதவும்.

SEO-friendly internal & external links (suggested)

Link to related content on your site and authoritative external pages:

Final thoughts — practice beats theory

Reading charts becomes intuitive after deliberate practice. Backtest setups, paper trade or use demo for 4–8 weeks, and maintain a trade journal in Tamil or English to record reasoning and outcomes. Over time you’ll see which patterns, timeframes and instruments suit your style.

நடைமுறை பயிற்சி அவசியம். டெமோவில் உங்கள் விதிகளை சோதித்து ஜர்னல் வைத்தால் வெற்றிக்கான சாத்தியங்கள் அதிகரிக்கும்.
#Forex#ChartReading#TradingTamil#TechnicalAnalysis
rfxsignals October 7, 2025 No Comments

How to Use Moving Averages for Trend Trading

How to Use Moving Averages for Trend Trading

How to Use Moving Averages for Trend Trading — Practical Guide & Rules

Reading time: ~9–11 mins • Updated:

Moving averages (MAs) are among the simplest and most powerful tools for identifying trends, smoothing noise, and defining entries/exits. This guide covers which MAs to use, how to choose periods and timeframes, crossover systems, confirmation techniques, risk management, and ready-to-use recipes for Forex, stocks and crypto traders.

Quick summary — key takeaways

  • Use Simple MA (SMA) to observe long-term direction and Exponential MA (EMA) for responsive signals.
  • Common period setups: 20/50/200 for trend structure; 9/21 for shorter, nimble entries.
  • Combine MAs with price action and higher-timeframe confirmation to reduce false signals.
  • Always size risk per trade and prefer trades that align with the higher-timeframe trend.

What a moving average does (simple explanation)

A moving average smooths price by averaging recent data points. It reduces noise so you can see the underlying trend direction. There are two common types:

  • Simple Moving Average (SMA) — arithmetic mean of prices over N periods. Smooth but laggy.
  • Exponential Moving Average (EMA) — gives more weight to recent prices, so it reacts faster to changes.

Which MA should you pick? (rules of thumb)

Choice depends on your time frame and style:

  • Scalpers / Intraday: 8–21 EMA for quick signals (1–15m charts).
  • Swing traders: 20 MA and 50 MA on 1H/4H charts for better noise control.
  • Position traders: 100 / 200 SMA to define long-term trend (daily/weekly).

Start with classic sets (9/21/50/200) and tune to the instrument’s volatility.

Three practical MA-based trend setups

1) Trend filter + pullback entry (recommended)

Use a higher-timeframe MA as trend filter (e.g., daily 200 SMA). On your trade timeframe (4H/1H) wait for price to pull back to a shorter MA (20 SMA/EMA) and show a rejection (pin bar, bullish engulfing). Enter in direction of the higher-timeframe trend. This reduces mean-reversion losses and increases probability.

2) Two-MA crossover (simple system)

Entry: when the fast MA (e.g., 9 EMA) crosses above the slow MA (e.g., 21 EMA) — buy. Exit: when it crosses back below. Use higher-timeframe trend alignment and volume/ATR filter to avoid whipsaws. Always combine crossovers with a stop based on recent volatility.

3) MA Ribbon / Multi-MA confluence

A cluster of aligned MAs (e.g., 8/13/21/34 EMA) forming a ribbon indicates strong trend momentum. Look for pullbacks to the ribbon’s upper or lower edge for entries; the tighter the ribbon, the stronger the trend often is.

Entry, stop and target rules

A repeatable plan is essential. Example rule-set:

  • Entry: Price closes above fast MA and above a confirmation candle (e.g., bullish engulfing) on 1H chart.
  • Stop Loss (SL): below recent swing low or a multiple of ATR(14) (e.g., 1.5×ATR).
  • Take Profit (TP): fixed R:R 1:2 or structure-based (next resistance / Fibonacci extension).
  • Position sizing: calculate LOT so that SL risk = chosen % of account.

Reduce false signals — confirmation checklist

Moving averages give many signals; filter them:

  • Confirm with higher-timeframe trend (only take trades in the same direction).
  • Check volume or tick activity — good confirmation for breakouts.
  • Use ATR to avoid taking signals in extremely low volatility environments.
  • Avoid trading across major news events unless you have a tested plan.

Multi-timeframe approach (MTF)

Use a two-frame check: higher timeframe (e.g., daily) defines the bias; lower timeframe (e.g., 1H) times entries. Example: Daily 200 SMA is up → only take buys on 1H when price pulls back to 20 EMA and shows bullish price action.

Examples & visual rules (how to practice)

Backtest visually on 50–100 charts: mark MA crosses, filter by market structure, record SL/TP and outcome. Use demo accounts to forward test the exact MA periods you intend to use. Track win rate, average R:R and expectancy.

Common pitfalls and how to avoid them

  • Whipsaw losses: avoid small-period crossovers on choppy markets; prefer higher-timeframe alignment.
  • Overfitting: don’t optimize MA periods excessively on historical data — keep rules robust and simple.
  • Ignoring volatility: fixed pip stops without ATR consideration lead to premature exits.

Combining MAs with other tools

Best results come from combining MAs with non-redundant indicators: price action, support/resistance, Fibonacci levels, and volume. An MA tells you direction; price action tells you context.

Sample strategy (ready-to-test)

Strategy: 21 EMA (fast), 50 SMA (trend), ATR(14) for stops.

  1. Bias: 50 SMA slope positive and price above 50 SMA → bullish bias.
  2. Entry: 21 EMA crosses above short pullback and a confirmation candle closes above 21 EMA on 1H.
  3. SL: 1.5×ATR below entry.
  4. TP: 2× risk or next swing resistance; trail with 21 EMA after price moves 1×ATR in your favor.

Broker & execution tips

Use brokers with reliable execution and low spread on your chosen instrument. For intraday MA trading, lower spreads and low latency matter. Always confirm that your platform's MAs match your backtest (some platforms use different price sources — close vs typical).

SEO-friendly internal & external linking strategy

Link this article to related pages and a few trusted external references:

Final checklist before you trade

  1. Confirm higher-timeframe trend (200 SMA or 50 SMA).
  2. Validate entry with price action and ATR-based stop.
  3. Size position so SL risk = chosen % of account.
  4. Backtest and forward-test on demo for at least 3 months before scaling live.
#Trading#MovingAverages#TrendTrading#Forex
rfxsignals October 7, 2025 No Comments

How to Trade News Events in Forex

How to Trade News Events in Forex

How to Trade News Events in Forex — A Practical Step-by-Step Guide

Updated: • Reading time: ~8–10 mins

Trading forex around scheduled news events (FOMC, NFP, CPI, RBI policy, GDP releases) offers high opportunity but also high risk. This guide gives a repeatable plan — preparation, entry rules, position sizing, and exit management — so you trade news events with discipline instead of betting on headlines.

Quick summary — what you’ll learn

  • How to prepare for news: calendar, liquidity windows, and pair selection
  • Two practical news-trade methods: volatility fade & breakout capture
  • Risk rules: position sizing, stop placement, and trade management
  • Checklist for execution and post-news review to improve performance

Why news trading is different from routine setups

News events compress information. Prices can move violently in seconds, creating big winners and losers. Unlike routine technical trades, you face larger slippage, spread widening, and occasional spikes/gaps — so standard indicators must be augmented with a news-specific playbook.

Step 1 — Preparation (the part most traders skip)

Preparation beats luck. Use a reliable economic calendar (e.g., your broker calendar or institutional calendars) and mark high-impact events: FOMC decisions, US Nonfarm Payrolls (NFP), CPI, GDP, RBI rate decisions and any surprise local headlines. Know the scheduled time in your time zone and watch for pre-event commentary.

  • Choose pairs: trade pairs that react predictably to the release (e.g., USD pairs on US data). For INR-sensitive moves, watch USD/INR and EUR/INR.
  • Session overlap: news often moves most when the respective session is active. NFP during New York session; RBI during India session.
  • Check liquidity: thin liquidity increases spreads — avoid exotics unless you can absorb costs.

Step 2 — Two reliable news-trade strategies

1) The Volatility Fade (mean-reversion)

Many news moves overshoot. The volatility fade attempts to enter after the initial spike once the immediate panic subsides and liquidity returns. Key rules:

  • Wait 30–120 seconds after the print to allow the first spike and quote noise to settle.
  • Use a limit order near the opposite side of the spike (e.g., if price jumps up, place a sell limit a few pips below the spike top).
  • Set a tight stop (e.g., a multiple of the printed volatility) and a modest target (1:1 to 1:2 initial R). Expect whipsaws — place small size.

2) Breakout Capture (ride the momentum)

Sometimes the market confirms a directional breakout after news. The breakout capture trades momentum rather than fading it.

  • Define the pre-news range (1–15 minutes). Place entry orders beyond that range (stop-entry) after the release.
  • Use wider stops to allow for initial volatility and trail stops as the move confirms.
  • Prefer breakout capture on truly directional surprises (e.g., much hotter CPI or a surprise rate cut/hike).

Step 3 — Risk management (non-negotiable)

News trades are riskier — treat them accordingly. Limit risk per trade to a small percentage of equity (0.25–1% typical for news), reduce position size, and predefine maximum daily exposure.

  • Use fixed risk per trade, not fixed lot size.
  • Account for spread widening — your stop must include the widened spread amount.
  • Consider using limit entries after the first move to control slippage for fade trades.

Order types & tech tips

Market orders during releases can suffer severe slippage. Use stop-entry orders for breakout strategies and limit orders for fades. Make sure your broker accepts quick cancels and supports conditional orders — otherwise use a platform with guaranteed SL if available.

Practical checklist — 10 minutes before, 1 minute before, and at release

10 minutes prior

  • Confirm event time and expected impact on your chosen pair.
  • Reduce leverage and set max exposure for the session.
  • Place or prepare orders and note stop/target levels.

1 minute prior

  • Freeze new trade entries not related to the event.
  • Ensure charts and DOM (depth) are ready; close unrelated positions if needed.

At release

  • Do not chase initial spikes. Let quotes settle if fading.
  • If breakout activates your stop-entry, manage risk and trail stops as the trend confirms.

Common psychological traps

Fear-of-missing-out (FOMO) and revenge trading after a stop are the biggest killers. Plan every trade, accept the small losing streaks, and review trades objectively. Post-news journaling will accelerate improvement.

Post-news review — how to learn fast

Keep a trade journal for each news event: timestamp, entry/exit, spread experienced, slippage, and rationale. Over time you’ll learn which events and pairs suit your style and which setups produce consistent edges.

SEO-friendly internal & external links to include

To boost SEO and topical authority, link this article to relevant internal pages and 2–3 high-authority external sources:

Final checklist — ready-to-print before the next release

  1. Pick the event and pair → verify session overlap
  2. Decide: fade or breakout → set order type
  3. Calculate risk & adjust size → include spread/slippage
  4. Execute with discipline → journal outcome
#forex#newstrading#USDINR#trading
rfxsignals October 3, 2025 No Comments

How to Detect Signal Manipulation in Volatile Markets

How to Detect Signal Manipulation in Volatile Markets
How to Detect Signal Manipulation in Volatile Markets | {{SITE_NAME}}

How to Detect Signal Manipulation in Volatile Markets

By Estimated read: 9–11 minutes

Overview: Volatile markets create fertile ground for legitimate signal noise and for deliberate signal manipulation. Knowing how to spot manipulation—fake fills, spoofing, coordinated alerts, and delayed data—helps you avoid poor trades and preserve capital. This guide lists red flags, diagnostic tests, and practical defensive rules you can implement immediately.

Volatile markets amplify every input — including the signals you follow. Distinguishing authentic signals from manipulated or low-quality alerts is essential for any trader relying on external feeds, community channels, or automated strategies. This article breaks detection into (A) red-flag behaviors, (B) data tests you can run, (C) cross-checks and forensic checks, and (D) defensive rules to keep your drawdown small when the market behaves badly.

1. Common types of signal manipulation

Understanding the methods helps detect them. Frequent manipulative behaviors include:

  • Spoofed fills: fake order information shown on some platforms but not actually executable on the exchange.
  • Delayed or stale data: feeds that lag market prices, making "real-time" signals inaccurate.
  • Coordinated pump-and-dump alerts: groups send bullish signals to create momentum, then exit.
  • Cherry-picked backtests: signals optimized for specific long-tailed periods that don’t hold live.
  • Wash alerts: test alerts sent to create perceived success before real trades are placed.

2. Red flags you should watch

If you see any of the following, treat the signal with suspicion:

  • Repeated "perfect" entries or exits with unrealistically tight stops.
  • Signals that arrive only after large market moves (late alerts).
  • High-volume claims without independent verification (no fill screenshots, no broker statements).
  • Channels that frequently change recommended targets/stops without transparent reasoning.
  • Pressure to act immediately or fear-of-missing-out (FOMO) prompts in messaging.

3. Quick data checks you can run (real-time)

When a signal arrives in a volatile market, run these rapid checks before risking capital:

  1. Timestamp check: Compare the signal timestamp to your price feed. If the signal refers to a price that happened >1–3 seconds earlier in a fast market, treat it as stale.
  2. Exchange verification: For crypto or ECN markets, verify the quoted level on the exchange's native order book or official API.
  3. Volume confirmation: Check whether volume on the move supports the claim. Low-volume moves during volatility often reverse quickly.
  4. Cross-feed confirmation: Look for the same move on a different data provider or broker.
  5. Order book depth: Observe whether large visible orders are genuine or vanish (a sign of spoofing).

4. Statistical and forensic tests (post-event)

For signals you already received, perform these retrospective checks to detect manipulation or poor signal hygiene:

  • Fill/Execution audit: Compare the claimed entry/exit to actual fills recorded by your broker; large discrepancies indicate misreporting.
  • Latency analysis: Measure the delay between alert and market price (log timestamps). A pattern of >X seconds delay in volatile periods is suspicious.
  • Correlation testing: Check if multiple symbols moved together artificially (e.g., many illiquid pairs spiking simultaneously).
  • Win/loss distribution review: Real strategies show varied outcomes; overly tidy drawdowns and smooth equity curves may be overfitted.

5. Cross-check sources and reputations

Signal quality depends on the sender. Maintain a source registry:

  • Grade sources by historical accuracy and transparency (A–F).
  • Prefer sources that publish post-trade evidence: time-stamped screenshots, broker reports, or public API calls.
  • Avoid exclusive-only groups that refuse to let you audit past signals.

6. Behavioral signs from chat/activity logs

Monitor the behavior of channel moderators or signal providers. Signs of manipulation include:

  • Deleting or altering messages after the fact to make a signal look better.
  • Amplifying FOMO with constant "now or never" messages.
  • Posting confusing mixed signals to create noise while insiders trade elsewhere.

7. Defensive trade rules to limit damage

You don’t need to root out every manipulative act; you need rules that protect capital. Implement these defensive rules:

  • Wait-for-confirmation: Require a price or volume confirmation before entering after a signal (e.g., close above/below the signal price on a 1-minute candle).
  • Reduced sizing in volatile windows: Scale position size down during scheduled news or extreme volatility.
  • Use limit entries with slippage caps: Only accept fills within acceptable slippage; reject fills beyond that to prevent chasing fake moves.
  • Predefine maximum exposure: Keep a portfolio-level cap; if multiple signals spike, reduce per-signal size.
  • Auto-stop audit: Keep logs of stop placement vs actual executed stop levels to detect mismatches quickly.

8. Automation & monitoring tools

Automation helps detect patterns faster than manual checks. Consider:

  • Recording all incoming alerts with timestamps and automatically matching them to price feed snapshots.
  • Setting automated alerts when fill slippage exceeds thresholds or when the order book shows disappearing liquidity.
  • Using simple statistical dashboards to flag sources whose reported results deviate significantly from actual fills.

9. Legal & ethical considerations

Some manipulative behaviors are illegal in regulated markets. If you suspect fraud (coordinated pump-and-dump, spoofing on regulated exchanges), document evidence and report to the relevant market regulator or exchange. Private chat disputes are common — preserve logs and timestamps before attempting to escalate.

Quick Checklist: 1) Always verify timestamps and price sources; 2) Check volume and order-book depth; 3) Reduce size in volatile windows; 4) Keep an audit trail for suspicious signals.

10. Example: a real-world detection workflow

Scenario: You receive a bullish breakout alert during a major economic release.

  1. Immediately snapshot the price from your primary feed and a secondary feed (exchange API or alternative broker).
  2. Check volume on the breakout candle; if volume is muted, treat the breakout as weak.
  3. If the order book shows large orders that vanish after you attempt to take them, abort the trade.
  4. If you still enter, reduce size by 50% and set a stricter slippage/stop rule.
  5. Log all timestamps and reconcile fills after the event — if your fills consistently differ, remove the source.

Conclusion

Signal manipulation is not always obvious, especially during high volatility. The best defense is a combination of skepticism, fast data checks, source auditing, and conservative trade rules that limit downside. Build these checks into your workflow and automate where possible — preserving capital during manipulated conditions is the fastest path to long-term profitability.

Disclaimer: This content is educational and not financial advice. Trading involves risk. Always test rules in a demo environment before scaling live.
rfxsignals October 3, 2025 No Comments

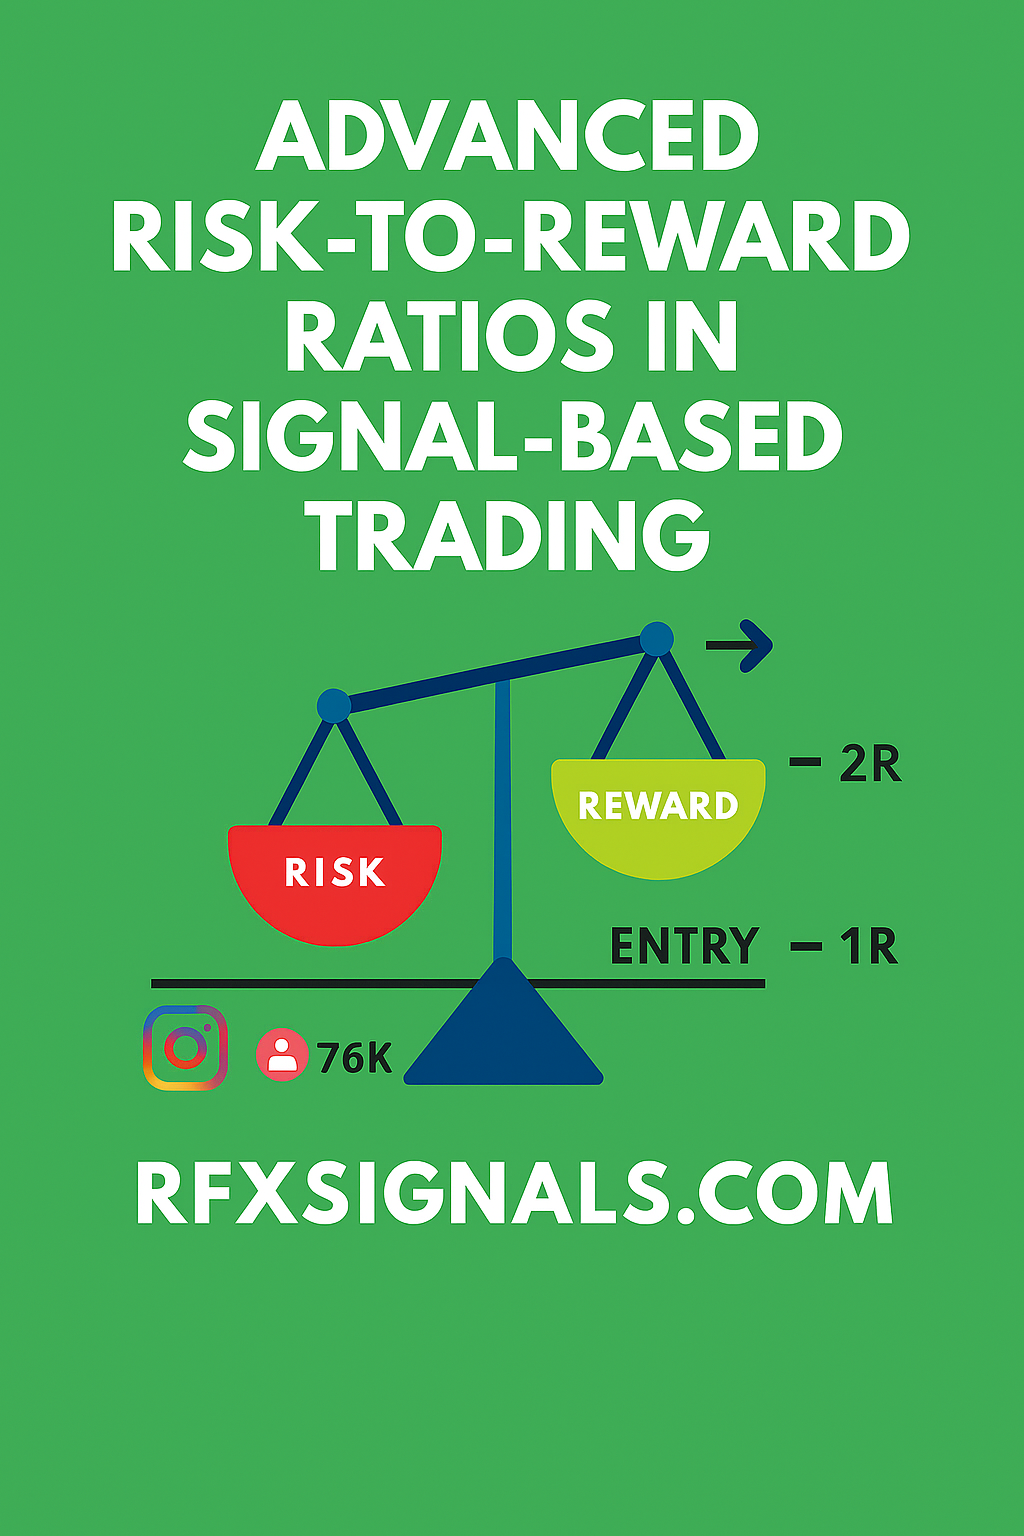
Advanced Risk-to-Reward Ratios in Signal-Based Trading

Advanced Risk-to-Reward Ratios in Signal-Based Trading
Advanced Risk-to-Reward Ratios in Signal-Based Trading | {{SITE_NAME}}

Advanced Risk-to-Reward Ratios in Signal-Based Trading

By Estimated read: 9 minutes

Summary: Signal-based trading requires more than following alerts — it needs a disciplined approach to risk-to-reward (R:R). This guide shows advanced methods to determine R:R in multi-signal setups, how to size positions for edge preservation, and practical rules to improve long-term expectancy.

Signal-based trading transforms subjective market views into repeatable processes. But without robust risk-to-reward rules, winning signals can be eroded by poor sizing and mismanaged stop placement. This article explores advanced R:R concepts tailored for traders who rely on signals — whether algorithmic, manual, or community-driven — and want to convert positive hit-rate signals into long-term profitability.

1. Why R:R matters more with signals

Signals often arrive clustered (several signals in a narrow time window) or as contradicting messages from different indicators. A naive, fixed R:R (like 1:2 always) ignores context: market volatility, signal quality, and overlapping exposure. Advanced traders adapt R:R dynamically to preserve edge while keeping drawdown under control.

2. Signal quality and expected value (EV)

Before assigning R:R, evaluate signal quality. Key metrics:

  • Historical hit rate (over similar conditions)
  • Average win and loss size
  • Signal correlation with price regime (trending vs range)

Use these to estimate EV. If a signal historically shows a 40% win rate with an average win 2× average loss, the expectancy per trade = 0.4×2 − 0.6×1 = 0.2 units; this positive EV lets you accept lower R:R (e.g., 1:1) while maintaining profitability.

3. Dynamic R:R: volatility and regime adjustment

Set stops and targets relative to volatility (ATR or realized volatility). Rules of thumb:

  • Low-volatility regime → tighter stops, smaller targets (preserve capital)
  • High-volatility regime → widen stops but increase target multiples to maintain R:R
  • Use ATR multiples to compute stop distance and derive target = stop_distance × desired_RR

Example: ATR(14) = 20 pips. If your signal is strong in trending markets, set stop = 1×ATR (20 pips) and target = 3×ATR (60 pips) for R:R 1:3.

4. Combining multiple signals: scaling and staggered R:R

When two or more signals (e.g., indicator + price action) align, you can scale position entries and use staggered R:R:

  1. Entry A (initial signal): 50% position, stop at conservative level, target at 1:1.5
  2. Entry B (confirming signal): add 30%, tighter stop trailing to breakeven, target at 1:3
  3. Final add (strong macro confirmation): 20%, wider target 1:4 if trend continuation confirmed

Staggering reduces risk when signal reliability is uncertain and magnifies profits on strong trends.

5. Position sizing rules for multi-signal exposure

Preserve account equity by sizing to total exposure, not per signal. Use these steps:

  1. Decide max account risk per trade (e.g., 1% of equity).
  2. If you expect multiple correlated signals, reduce per-signal risk (e.g., 1% total split into 0.5% and 0.5%).
  3. Calculate lot size = (account_risk_amount) ÷ (stop_distance in quote currency).

This prevents over-leveraging when several signals hit simultaneously.

6. Trade management: moving stops, partial exits, and expectancy preservation

After entry, follow a documented rule set:

  • At +1R, move stop to breakeven for initial portion to eliminate downside for the remainder.
  • Use partial exits at key levels (support/resistance or Fibonacci) instead of arbitrary fixed profits.
  • Trail stop after the trade achieves target multiples to lock in gains and let winners run.

Well-structured management can turn a moderate R:R into superior system expectancy.

7. Handling correlated alerts and portfolio-level R:R

Many signals are correlated (e.g., EURUSD and GBPUSD). Treat correlated trades as a single portfolio exposure. Compute portfolio R:R by aggregating potential P&L and risk across correlated positions and size accordingly to keep total risk within limits.

8. Backtesting R:R strategies on signal streams

Backtest using realistic assumptions: slippage, spread, and partial fills. Test several R:R bands (1:1, 1:2, 1:3) across different market regimes and measure drawdowns and Sharpe/Sortino ratios. Focus on metrics that matter to you — a higher R:R with rare wins may still underperform a lower R:R with higher hit rate.

9. Psychological & operational considerations

Higher R:R often means fewer wins and requires discipline. Use automation for signal execution where possible to remove execution hesitation. Document every trade and review monthly to refine R:R rules.

Quick Checklist: 1) Measure signal EV; 2) Adjust R:R by volatility; 3) Size per total exposure; 4) Use staggered entries for confirmation; 5) Backtest with realistic costs.

10. Practical example (step-by-step)

Signal: Breakout + momentum confirmation on 1H chart.

  1. ATR(14)=18 pips → stop = 1×ATR = 18 pips
  2. Target = 3×ATR = 54 pips → R:R = 1:3
  3. Account risk = 1% → risk per trade = $100 on $10,000 account
  4. Position size = $100 ÷ (18 pips × pip_value) → compute lots accordingly
  5. At +1R, move 50% of position to breakeven, trail remainder with 0.5×ATR

11. SEO & link strategy (for publishers)

When publishing signal-based content, link internally to relevant pages (e.g., /signals, /case-studies, /pricing) and externally to authoritative sources (e.g., educational resources). Use anchor text naturally: “signal performance report,” “ATR volatility guide,” etc. This article includes suggested internal links to improve thematic relevance and outbound links to trusted learning resources.

Conclusion

Advanced R:R in signal-based trading is a multi-dimensional problem: balance signal quality, volatility, and total portfolio exposure. Dynamic R:R, staggered entries, and disciplined sizing transform signals from noisy alerts into a sustainable advantage. Use consistent backtests and keep the rules simple enough to follow in real-time.

Disclaimer: Trading carries risk. Past performance is not indicative of future results. This content is educational and not financial advice.
rfxsignals September 30, 2025 No Comments

How to Trade Forex News Events Using Signal Timing

How to Trade Forex News Events Using Signal Timing

How to Trade Forex News Events Using Signal Timing

Master the art of trading Forex news events using precise signal timing. Learn step-by-step strategies, risk controls, and tools that give traders an edge during volatile releases.

Introduction: Why News Trading Needs Signal Timing

Trading Forex around news events is high-risk, high-reward. Sudden volatility can deliver huge moves — both up and down — in minutes. Signal timing adds discipline by letting traders prepare, anticipate, and act with precision rather than emotion.

Understanding Forex News Events

Forex markets respond to economic data releases, geopolitical events, central bank statements, and political developments. Examples include:

  • Central bank rate decisions
  • Non-Farm Payrolls (NFP)
  • GDP and CPI reports
  • Unemployment figures
  • Geopolitical tensions

The Role of Signal Timing in News Trading

Signal timing combines technical and fundamental inputs to align trades with news events. Instead of trading purely on gut feeling, traders use alerts, pre-set conditions, and verified signals to time entry and exit points.

Step-by-Step News Trading Strategy Using Signal Timing

Step 1 — Identify High-Impact News

Use an economic calendar (Investing.com, ForexFactory.com) to identify events likely to cause volatility. Prioritize high-impact events with historical market movement.

Step 2 — Define Your Trading Window

Define a clear entry window before or after the release. Example: enter 5 minutes after release if price stabilizes, or pre-set entry with limit orders if expecting a breakout.

Step 3 — Use Verified Signal Sources

Subscribe to real-time news signal providers or automated alert services (TradingView, Myfxbook AutoTrade, MQL5 signals) to trigger your trades with precision.

Step 4 — Risk Management Rules

- Limit risk per trade to a small percentage (e.g., 1-2% of capital).
- Use stop-loss orders to protect against adverse moves.
- Consider trailing stops to lock in profit during volatility.

Top Signal Tools for Forex News Trading

  • TradingView Alerts: Highly customizable alerts with webhook integration for automation.
  • MetaTrader/MQL5 Signals: Integrated platform signals that can auto-execute trades.
  • ForexFactory Economic Calendar: High-impact news listings updated in real-time.
  • Myfxbook AutoTrade: Copy proven strategies with historical verification.

Case Study: Trading NFP with Signal Timing

Let’s simulate an NFP news trade:

  1. Review NFP release schedule on ForexFactory.
  2. Set alerts 10 minutes before release via TradingView.
  3. Check provider signals for pre-event sentiment.
  4. Place orders with stop-loss limits based on recent volatility.

Managing Risk During News Events

Volatility spikes during news can cause slippage and widen spreads. Mitigate risk by:

  • Using limit orders instead of market orders
  • Reducing trade size
  • Using broker platforms with fast execution speeds

Inbound & Outbound Links for SEO

See related strategies: Backtest Forex Strategies, Investing.com Economic Calendar, TradingView Alerts.

Conclusion: Signal Timing — The Competitive Edge

Signal timing transforms news trading from guesswork to systematic execution. Combining verified signals, economic calendars, and disciplined risk management creates an edge in Forex markets that is otherwise dominated by volatility and noise.

Start trading news with precision

Download our free News Trading Signal Timing checklist and join our WhatsApp community for live alerts.

RTech RFX Signals
RTech RFX Signals

Helping traders leverage news events with precise signal timing — tested strategies, real-time alerts & risk management advice.

rfxsignals September 30, 2025 No Comments

Signal Fatigue: When to Ignore the Noise and Trust Your System

Signal Fatigue: When to Ignore the Noise and Trust Your System

Signal Fatigue: When to Ignore the Noise and Trust Your System

Signal fatigue — the urge to abandon tested systems after a rough patch — is one of trading’s stealthiest performance killers. Learn how to spot fatigue, quantify it, and create objective rules that protect capital and preserve edge.

Introduction — what is signal fatigue?

Signal fatigue is the trader’s tendency to lose confidence in a working strategy during temporary drawdowns, overreact to noise, chase new ideas, or tweak rules impulsively. It looks harmless at first — “I’ll just adjust the stop here” — but repeated adjustments during noise erode edge, increase turnover, and often transform a profitable system into a losing one.

Why signal fatigue happens

Several psychological and structural factors cause fatigue:

  • Loss aversion: humans feel losses more intensely than gains, prompting desperate changes after drawdowns.
  • Recency bias: recent losses loom larger than long-term results.
  • Survivorship bias & FOMO: seeing others report quick wins can make you abandon slow, steady systems.
  • Poor risk management: when sizing is too aggressive, normal volatility looks like failure.
  • Noise-heavy environments: high-volatility regimes produce many false signals that test discipline.

Recognize the red flags

The first step is objective detection. Watch for:

  • Frequent rule changes after drawdowns.
  • Increasing trade frequency without documented strategy changes.
  • Emotional entries: impulsive trades after watching a losing streak.
  • Ignoring pre-defined stop-loss or sizing rules “just this once”.
  • Switching brokers or signal providers after a short underperformance period.

Quantify fatigue — metrics to monitor

Make signal fatigue measurable. Track these metrics in your trading dashboard:

  • Change frequency: count rule edits or parameter changes over rolling windows (e.g., edits per 30 days).
  • Turnover rate: ratio of trades per week relative to historical norm.
  • Deviation from plan: proportion of trades that deviate from the documented entry/exit rules.
  • Psychological volatility: a self-report score (1–10) you log daily for discipline and emotion.
  • Performance vs. baseline: rolling net P&L compared to expected P&L distribution from backtests (z-score of returns).

When to ignore the noise — set objective guardrails

The cure to emotional tinkering is pre-commitment. Define rules that automatically limit changes and force objective review:

1. Pre-commit rule change windows

Allow strategy parameter changes only during scheduled review windows (e.g., monthly). Immediate edits are disabled unless a documented severe-event threshold is met.

2. Minimum sample rules

Require a minimum number of trades or a minimum trading duration (e.g., 90 trades or 6 months) before parameter optimization is allowed.

3. Maximum allowed edit rate

Limit the number of allowed edits to strategy code or parameters (e.g., max 2 per quarter) unless performance breaches a kill-switch.

4. Kill-switch rules

Define objective kill-switches that pause trading and force a forensic review: e.g., drawdown > X% within Y days or consecutive losses > N trades at position size > threshold.

Trust your system — statistical tests & confidence bands

Convert your system’s historical performance into confidence ranges. Use these techniques:

  • Bootstrap stress tests: simulate thousands of re-samples of historical trades to estimate the distribution of drawdowns and returns.
  • Monte Carlo: randomly reorder or resample trades while preserving serial correlation to see expected worst-case drawdowns.
  • Control charts: plot cumulative P&L with upper/lower control bands (e.g., 95% CI). If live P&L remains within bands, treat volatility as expected noise.

Practical routines to reduce fatigue

Implement operational and personal routines that reduce emotional reactions:

  • Daily non-trading checklist: a short list you tick each morning (e.g., market regime check, news flags, position sizing confirmation).
  • Trade journaling: record rationale for every manual intervention — this creates friction that discourages impulsive changes.
  • Scheduled review meetings: weekly or monthly performance reviews with documented action items rather than on-the-fly decisions.
  • Small experiment funds: set aside a tiny percentage of capital (1–5%) for experimental tweaks so the core account remains untouched.

Human-in-the-loop vs. fully automated systems

Both models have pros and cons. Fully automated systems remove emotion but require robust safeguards. Human-in-the-loop allows judgement but is susceptible to fatigue. Hybrid approach recommendation:

  1. Automate execution and risk controls (stop, max exposure, kill-switches).
  2. Keep signal generation and parameter changes behind scheduled human review and documented testing.
  3. Allow manual override only with two-person consent (if running as team) or with mandatory journal entry for solo traders.

Case study — a small real-world example

A mid-sized retail strategy with a historical Sharpe of 1.6 experienced a 12% drawdown over 40 trading days in a high-volatility regime. Traders panicked and tightened stops, increasing turnover 3x and halving net returns over the next 3 months. After pausing and running Monte Carlo stress tests, they found the drawdown was a 1-in-12 event within expected distribution. They reinstated original sizing, re-tested with longer horizons, and recovered performance — illustrating how premature tinkering amplified losses.

Checklist: What to do when doubt creeps in

  1. Stop trading new edits immediately; switch to observation-only mode.
  2. Check objective metrics: drawdown vs expected, control-chart position, edit-rate.
  3. Run quick diagnostics (data integrity, slippage, broker issues).
  4. If diagnostics clear, run bootstrap/Monte Carlo to place current drawdown in context.
  5. Only change rules within the next scheduled review window with documented rationale and out-of-sample testing on a small capital slice.

Conclusion — discipline as an edge

Signal fatigue is not a bug — it’s a predictable human behavior. The antidote is structure: quantifiable metrics, pre-commitment rules, kill-switches, and disciplined review processes. Systems don’t fail because of markets alone — they fail because humans abandon them at the worst possible time. Treat discipline as part of your edge and design your workflow to protect it.

Free checklist: "Stop the Tinkering" — discipline rules for traders

Download our one-page checklist with kill-switch templates, review cadence, and journaling template to protect your edge.

Further reading

For psychological frameworks and risk management techniques, see resources such as Investopedia and academic articles on behavioral finance. Combine reading with the practical checklist above to convert theory into disciplined routines.

RTech RFX Signals
RTech RFX Signals

We publish practical Forex strategies, discipline templates and transparent backtests to help traders protect capital and scale knowledgeably.

rfxsignals September 30, 2025 No Comments

The Role of Sentiment Analysis in Signal Generation

The Role of Sentiment Analysis in Signal Generation

The Role of Sentiment Analysis in Signal Generation

Sentiment — from news, social media, positioning and options markets — is a powerful input for trading signals when engineered properly. This guide explains what to use, how to convert it into features, how to backtest and how to avoid common pitfalls.

Why sentiment matters

Price reflects information and expectations — and sentiment is the market’s aggregated expectations, fear and greed. Quantifying sentiment gives you a view of crowd behaviour that complements price-based technical indicators and fundamental macro data. When used carefully, sentiment features can provide early warnings of momentum shifts, overextended positioning, or regime changes.

Sources of sentiment

Sentiment is not a single thing — it comes from multiple channels. The most useful sources for FX signal generation are:

  • News sentiment: headlines, article tone and event coverage intensity (NFP, CPI, central bank minutes).
  • Social sentiment: Twitter/X, Reddit, Telegram channel chatter and other public forums (volume, polarity, velocity).
  • Positioning: Commitments of Traders (COT), broker aggregated positions and proprietary flow indicators.
  • Options & derivatives: skew, implied volatility shifts, put/call ratios — these reveal hedging demand and tail risk pricing.
  • Search & consumer signals: Google Trends spikes or search volume for terms like “buy EURUSD” can be supporting evidence.

Feature design — convert raw sentiment into trading inputs

Raw text or large tables are not directly useful for backtests. Convert them into normalized, time-aligned features:

1. Sentiment polarity and intensity

Use NLP (lexicon + transformer-based classifiers) to assign polarity scores (−1 to +1) and an intensity/confidence metric. Aggregate at chosen timeframes (e.g., 5-minute, hourly, daily).

2. Volume & velocity

A sudden spike in mentions (velocity) often matters more than the average polarity. Create features for mention volume, rolling z-score of volume, and cross-source corroboration (news + social spike).

3. Event flags and surprise scores

For macro events, derive surprise scores: actual − consensus (e.g., CPI surprise). Use both signed surprise and absolute surprise as features — the former suggests direction, the latter suggests volatility.

4. Positioning imbalance

Convert COT or broker flows into net positioning ratios and percentile ranks (where does current net long/short sit relative to the last N years?). Extremes often precede mean reversion.

5. Options-derived signals

Track changes in implied volatility, skew, and large block implied moves. Rapid increases in IV before scheduled events can indicate elevated tail-risk pricing.

Signal construction patterns

There are several robust ways to combine sentiment with price data:

Filter signals

Use sentiment as a filter: only take a technical breakout if sentiment polarity and volume confirm the move. This reduces false breakouts triggered by noise.

Contrarian signals

Extreme bullish social sentiment combined with crowded long positioning can be a contrarian sell signal — especially when sentiment is unanimous and lacks nuance.

Momentum augmenters

Use positive sentiment velocity to increase sizing on momentum trades; reduce size when sentiment turns flat or negative.

Event-driven overlays

Around macro events, use sentiment + surprise to determine trade posture: if a rate decision surprises together with positive news and positive social sentiment, bias long in the short-window trade.

Backtesting sentiment-based signals — special care

Sentiment backtests require careful engineering to avoid look-ahead bias and survivorship pitfalls:

  • Time alignment: ensure your sentiment timestamps reflect when information would be available (publish time, not crawl time).
  • Data persistence: keep historical snapshots — social platforms allow edits and deletions; news articles can be updated.
  • Latency modelling: include ingestion latency. If you only receive social feeds with a 30s delay, simulate this delay in backtests.
  • Out-of-sample testing: use rolling walk-forward validation because sentiment regimes change (e.g., pre- and post-a regulatory event).
  • Pre-commitment: document your feature pipeline and refrain from heavy post-hoc feature engineering on the whole dataset.

Evaluation metrics that matter

Standard ML metrics are useful, but in trading focus on money metrics:

  • Net P&L after transaction costs and slippage
  • Sharpe / Sortino ratio
  • Max drawdown and time-to-recover
  • Signal latency impact on fill price (simulate slippage)
  • Consistency of performance across regimes (stress tests)

Common pitfalls & how to avoid them

Many developers trip on the same traps:

  • Echo-chamber bias: relying on a single social platform that reflects retail chatter only; always corroborate across sources.
  • Overfitting lexicons: building a tone classifier tailored to historical jargon that doesn’t generalize.
  • Positioning data gaps: treating incomplete COT data as complete — always check coverage and reporting lag.
  • Ignoring non-stationarity: sentiment meaning can change (e.g., memes vs. serious news); monitor feature drift.

Practical workflow example

A practical pipeline might look like this:

  1. Collect feeds: news wires, curated Twitter stream, COT reports, options chain snapshots.
  2. Preprocess: deduplicate, timestamp normalize, filter by language and region.
  3. Score: NLP polarity + confidence, volume z-scores, surprise calculations, positioning percentiles.
  4. Fuse: combine sentiment scores with technical indicators into a composite signal with weights or a trained model.
  5. Backtest: time-aware validation with latency and cost models.
  6. Deploy: run in demo mode first, monitor feature drift and live fills, and set retraining cadence based on performance decay.

Case study (illustrative)

In backtests, a EURUSD strategy that required both a 1-hour RSI confirmation and a positive news polarity spike within the prior 60 minutes reduced false breakouts by ~30% and improved net P&L after costs versus the technical-only variant. The tradeoff was fewer signals — but better quality and lower drawdown.

Conclusion — sentiment amplifies but rarely replaces

Sentiment analysis is a powerful amplifier when combined with price and fundamental data: it helps filter low-probability signals, detect crowd extremes, and gauge event impact. But it’s an input, not a silver bullet. Robust pipelines, careful backtesting, latency modelling and continuous monitoring are essential. Start small, test in realistic demo conditions, and treat sentiment as one pillar of a multi-faceted signal generation system.

Want our sentiment starter pack?

Download sample sentiment features, demo notebooks and a timestamped feed template to accelerate your testing.

Further reading (authoritative outbound links)

For NLP and financial text analysis background, reputable resources include arXiv, Investopedia, and practical tutorials from libraries like Hugging Face and Stanford NLP.

RTech RFX Signals
RTech RFX Signals

We build practical FX signals, backtesting tools and datasets to help traders make data-driven decisions.