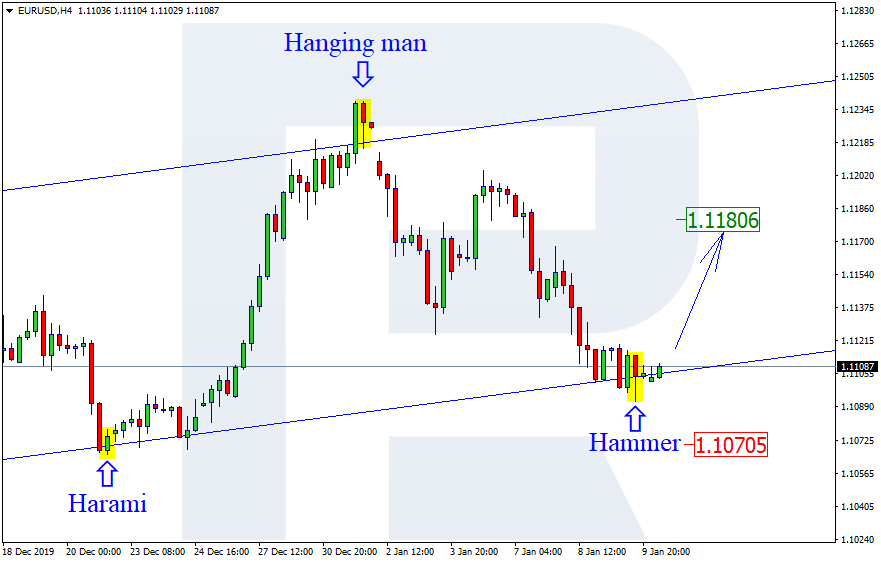
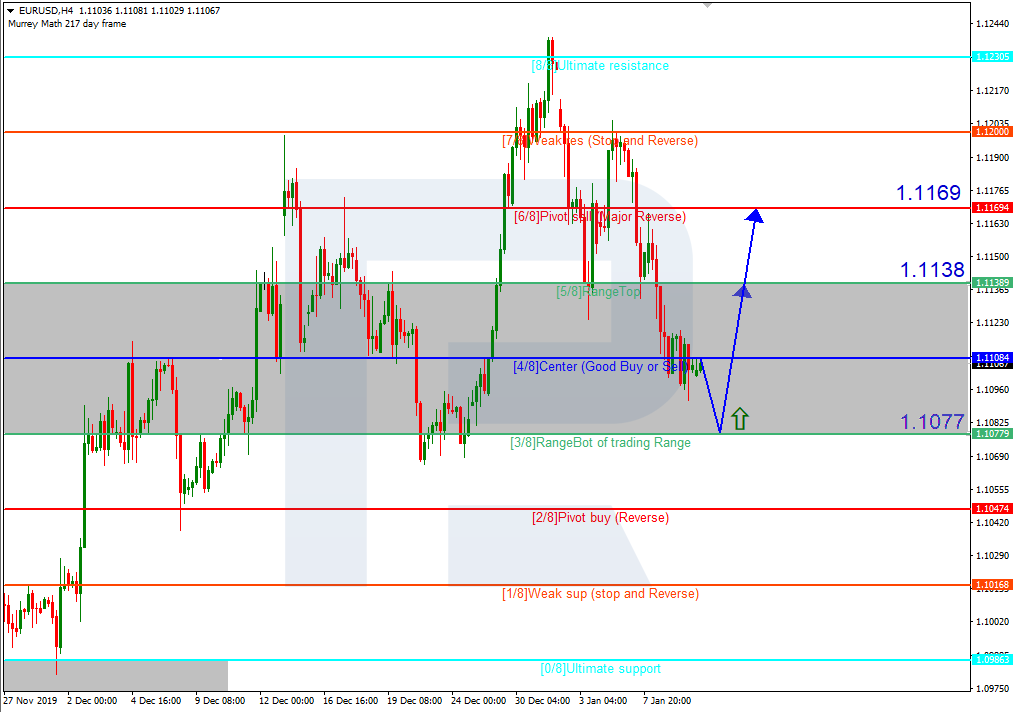
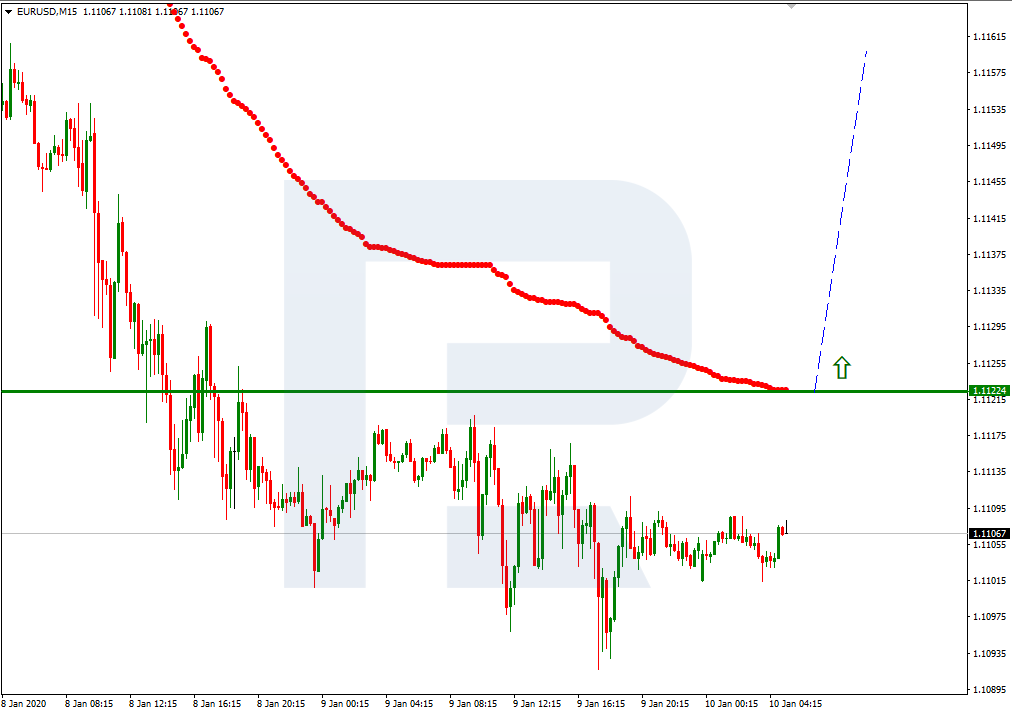
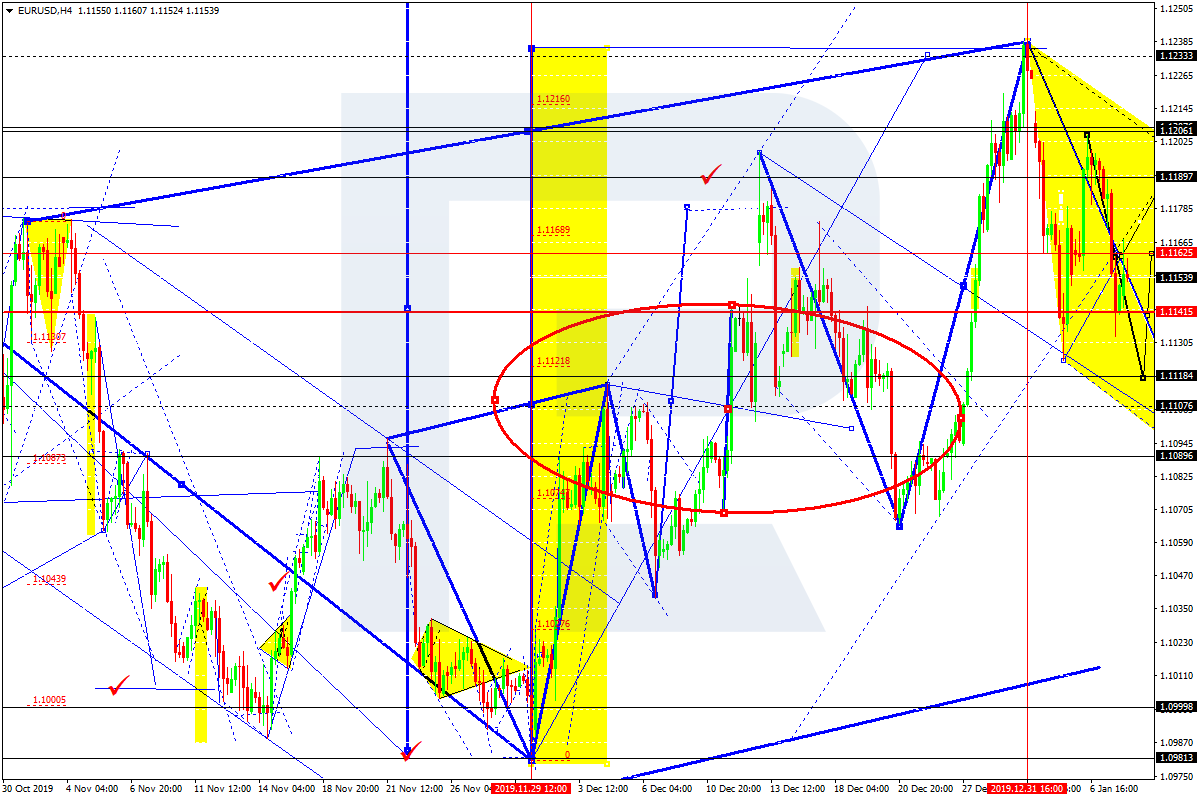
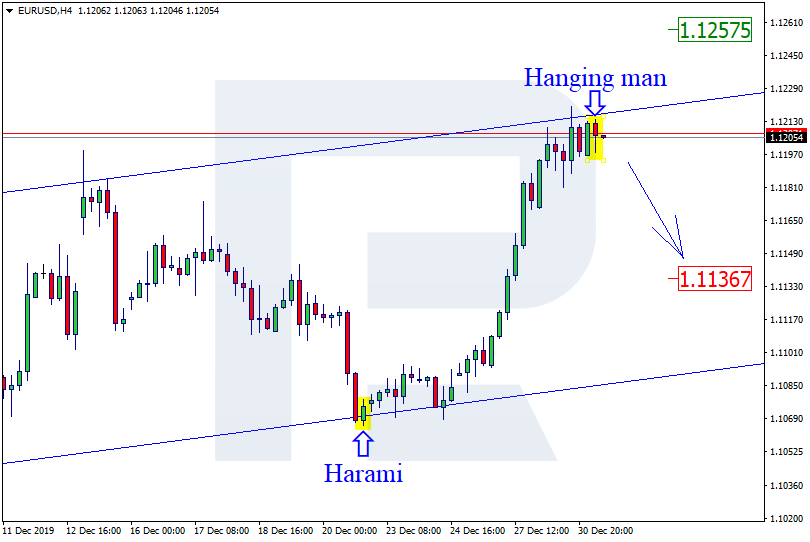
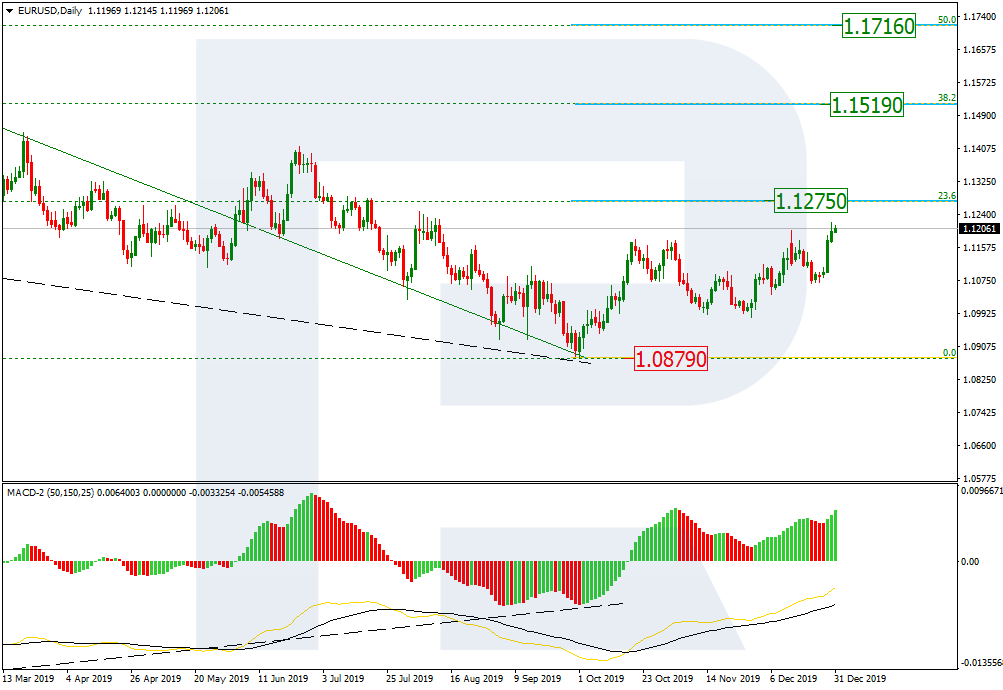
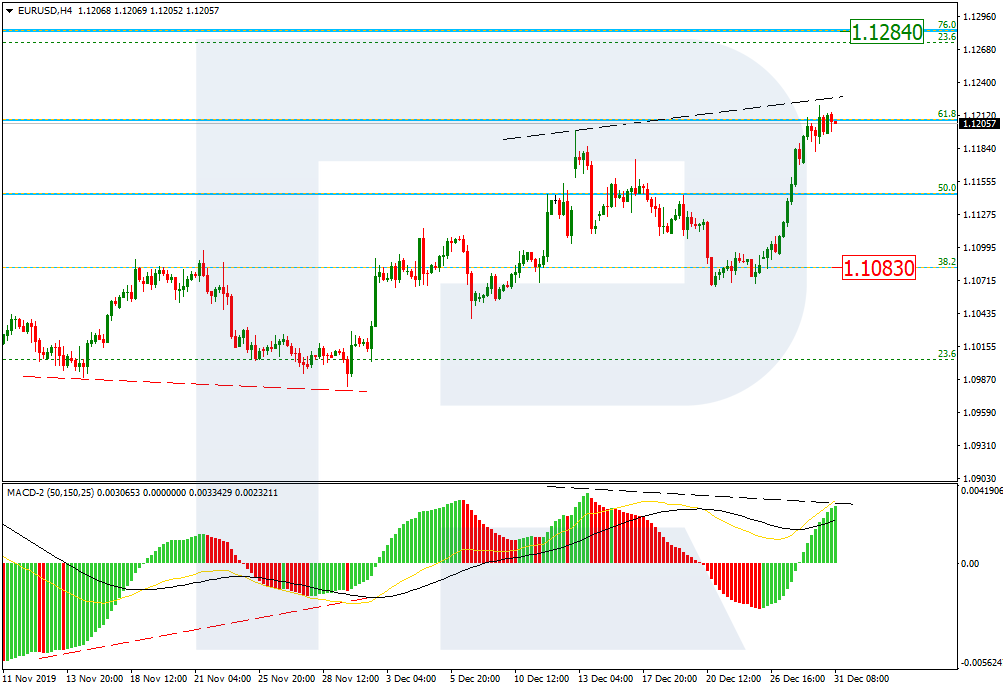
EURUSD, “Euro vs US Dollar”
EURUSD is correcting towards 1.1090. Possibly, today the pair may fall with the short-term target at 1.1120 and then form one more ascending structure towards 1.1163, at least. Later, the market may start another decline to reach 1.1090.


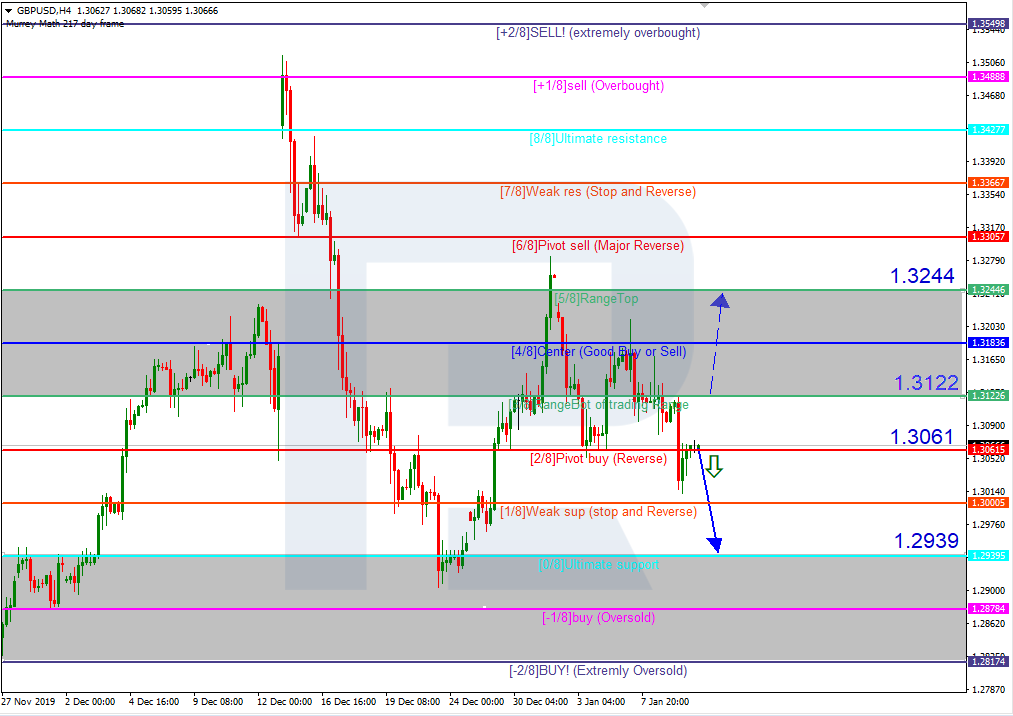
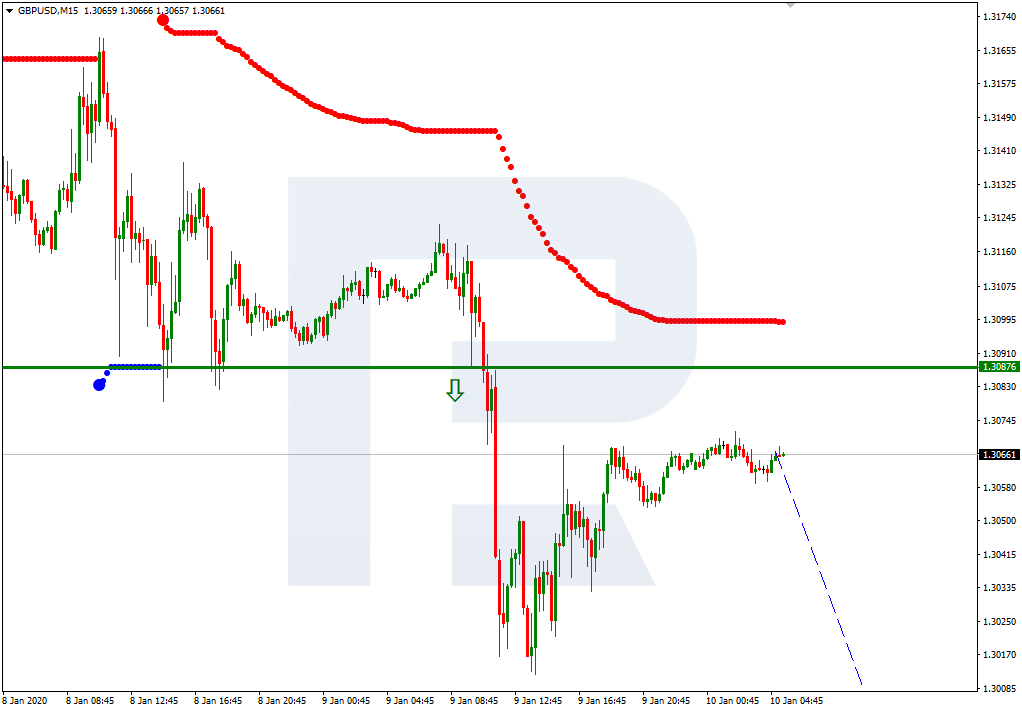
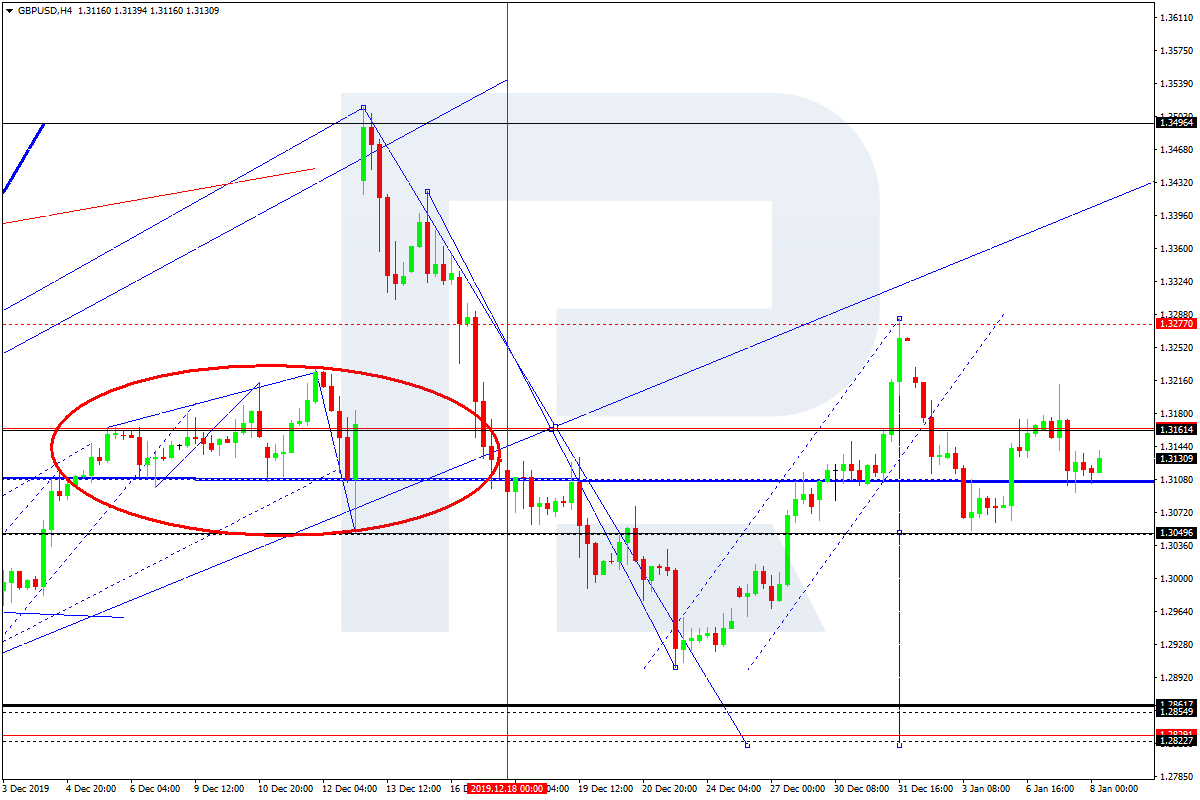
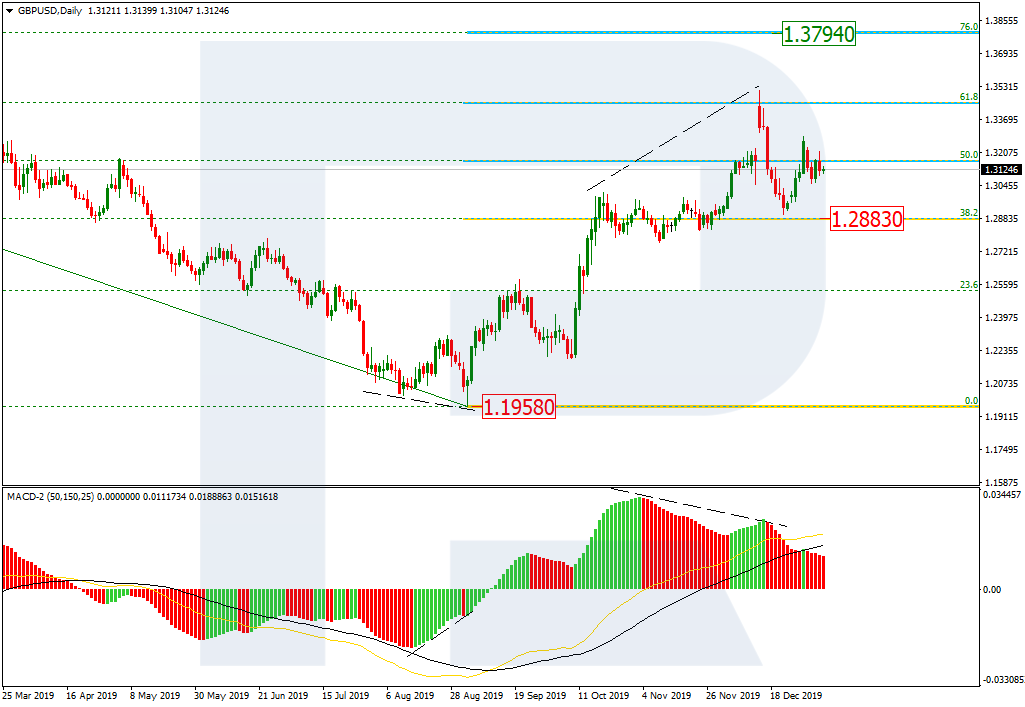
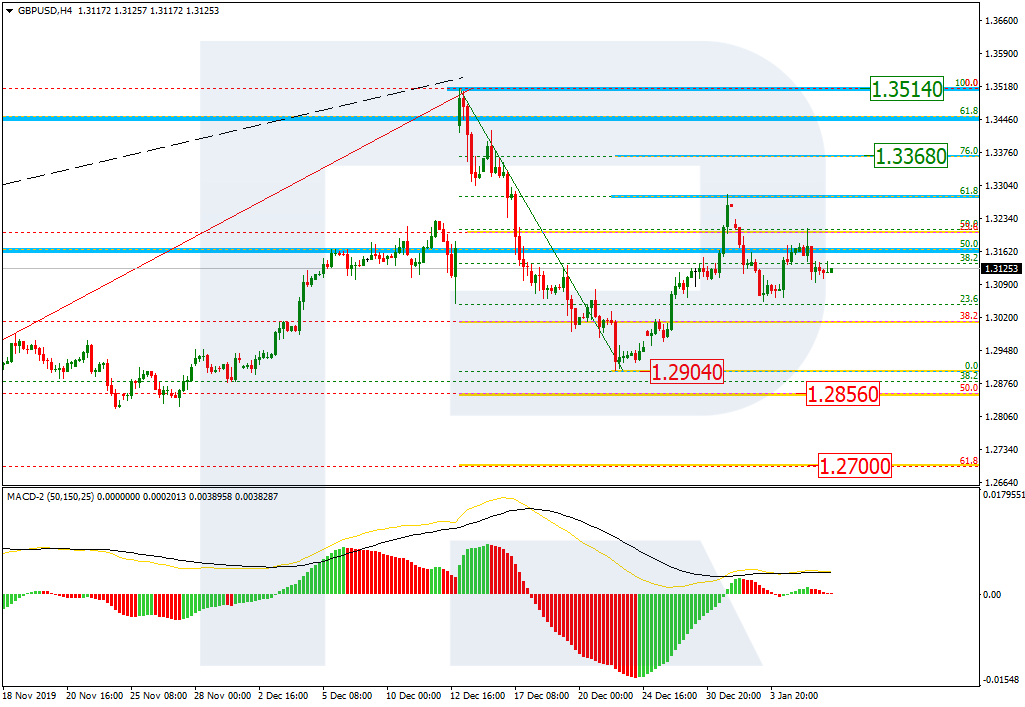
GBPUSD, “Great Britain Pound vs US Dollar”
GBPUSD is forming the fifth correctional wave with the target at 1.2822. Today, the pair may reach 1.2888 and then start a new growth towards 1.3050. After that, the instrument may form a new descending structure to reach the above-mentioned target.
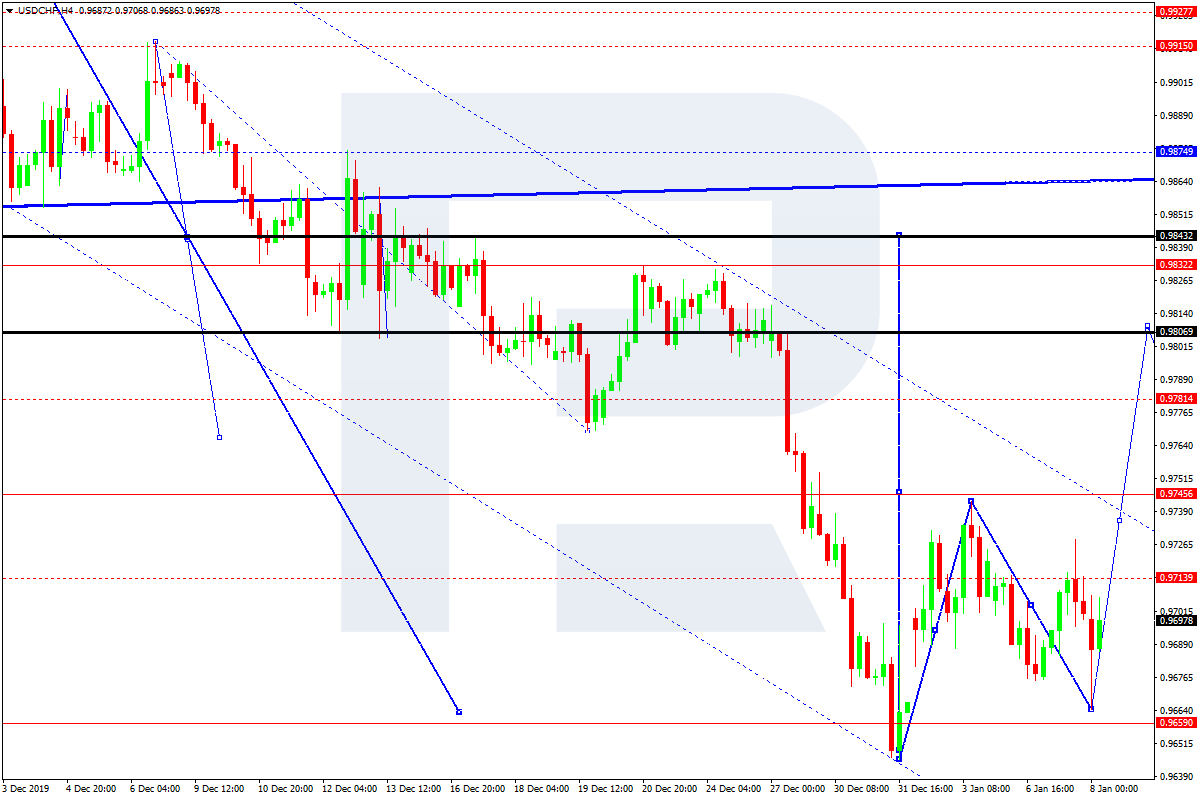
USDCHF, “US Dollar vs Swiss Franc”
After completing the ascending impulse towards 0.9744, USDCHF has finished the correction at 0.9666. Possibly, today the pair may break this range to the upside to reach the short-term target at 0.9807. After that, the instrument may start a new decline to reach 0.9740 and then resume trading upwards with the target at 0.9844.
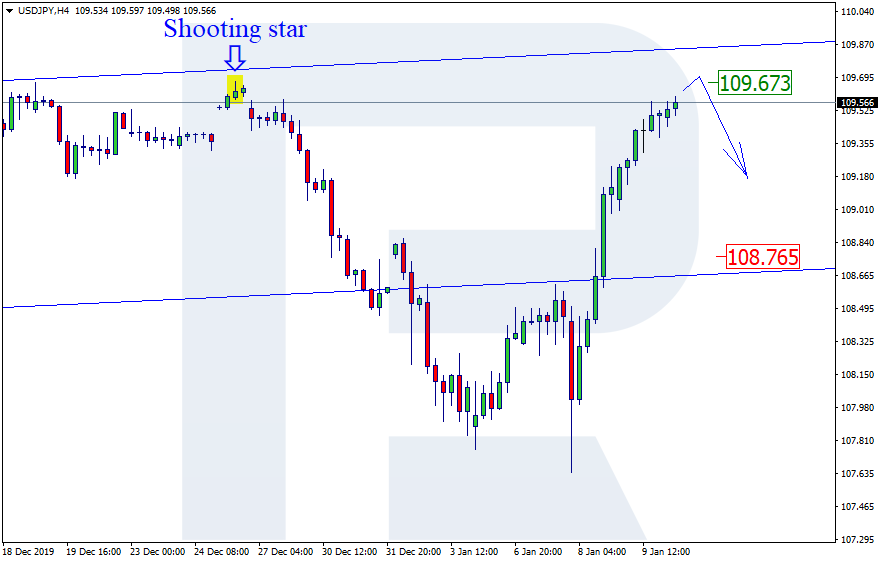
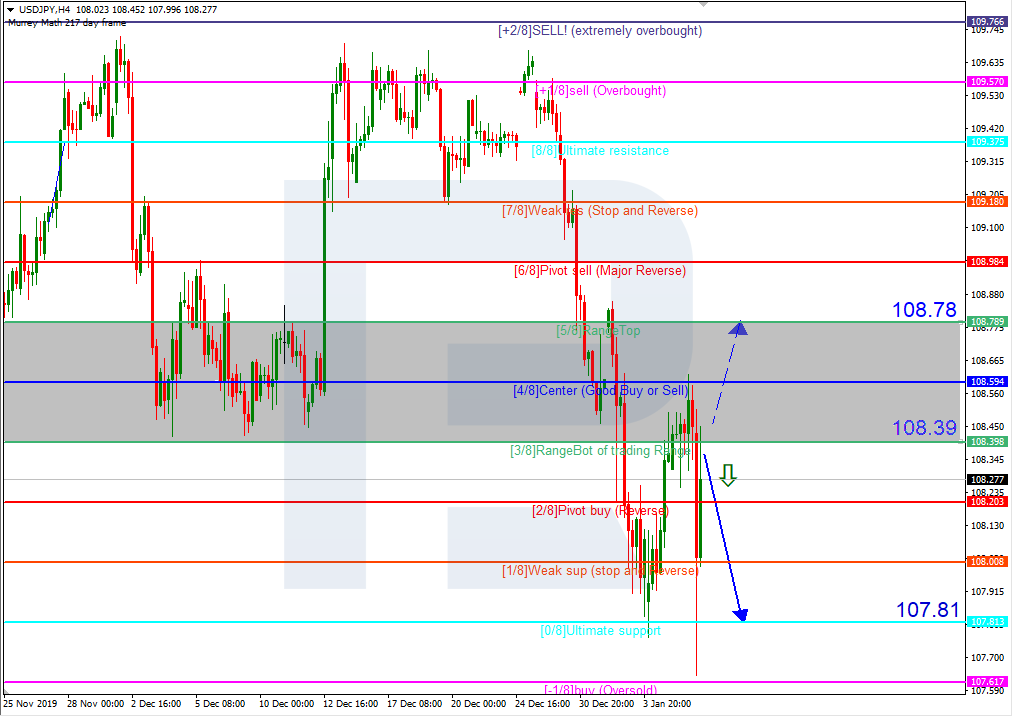
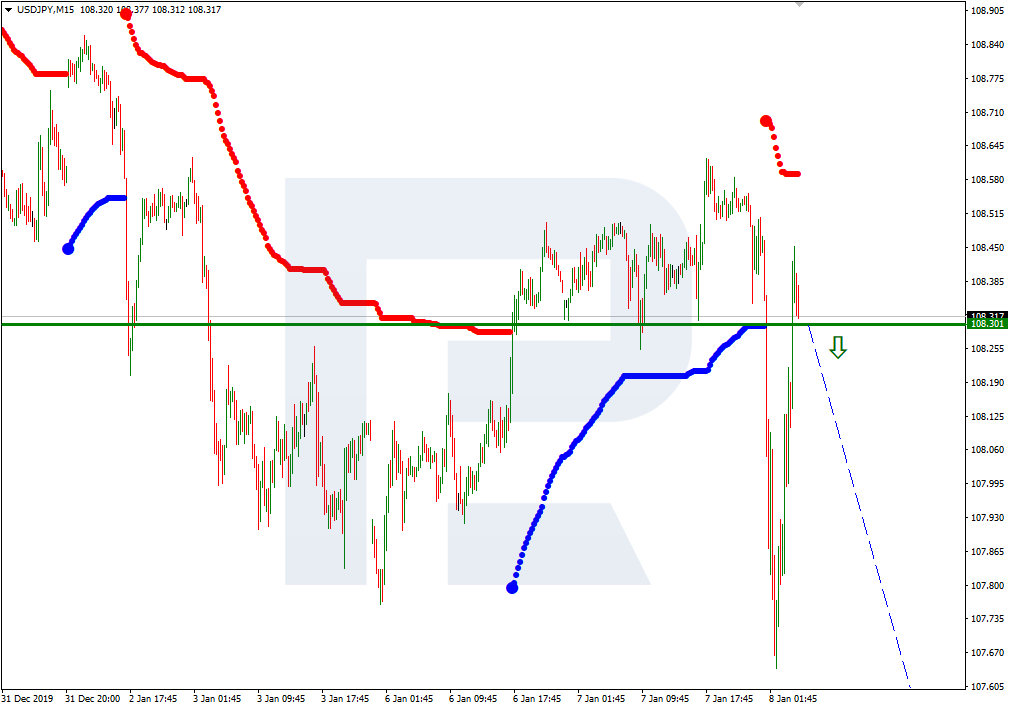
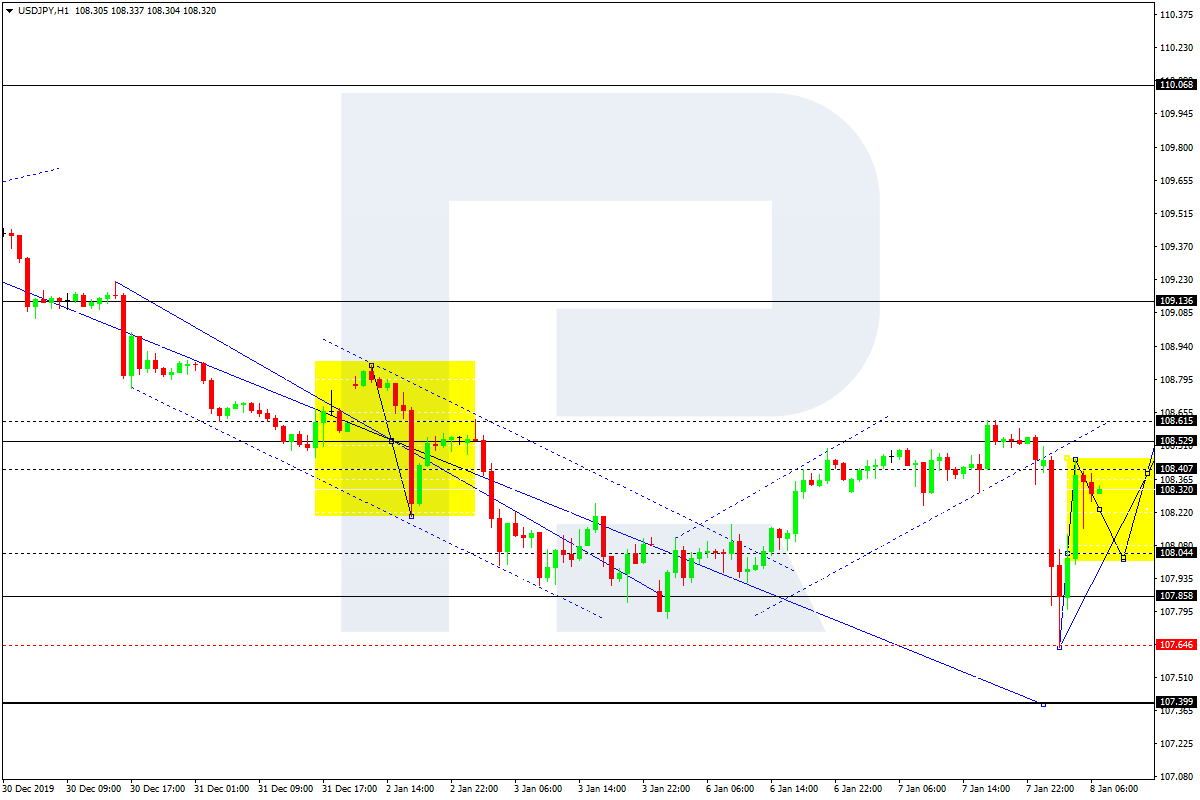
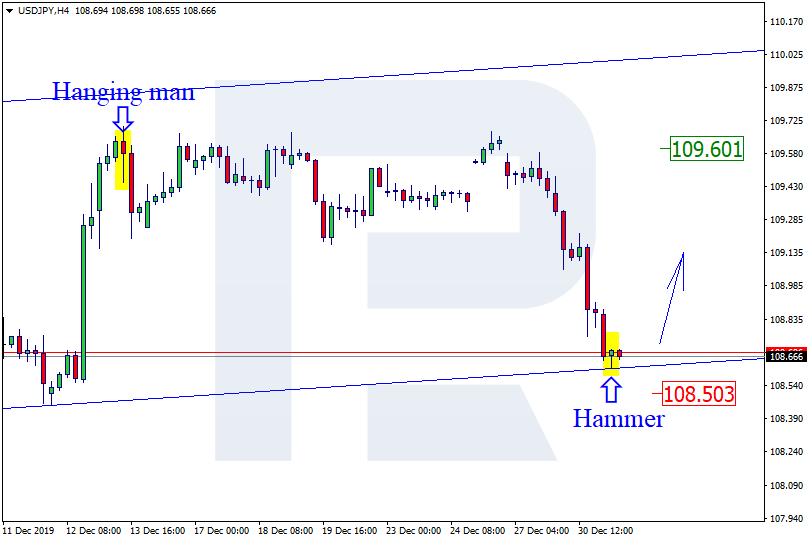
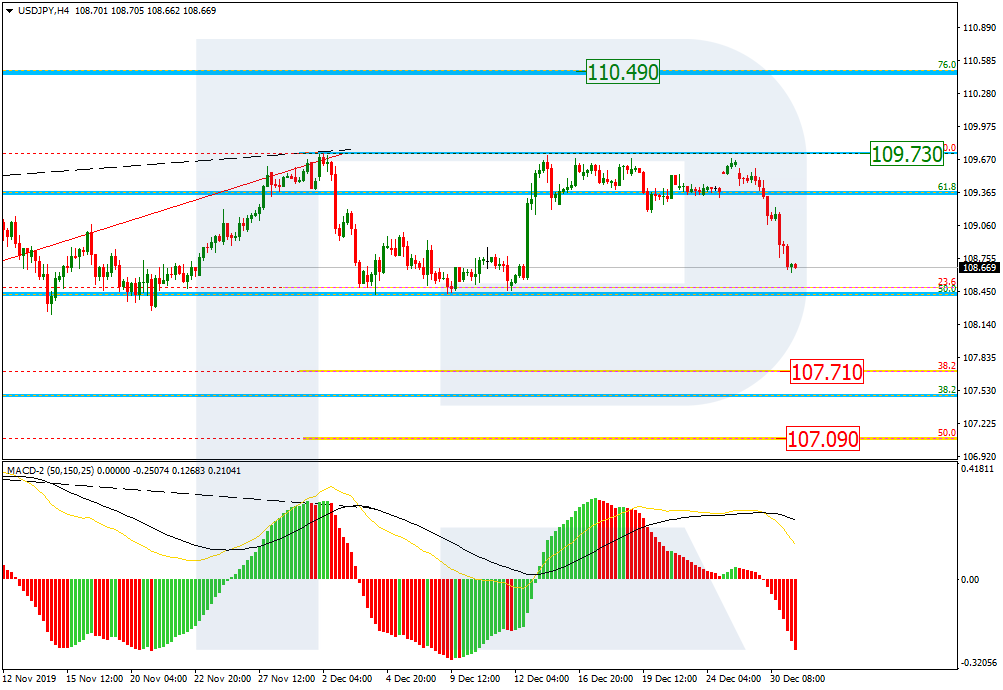
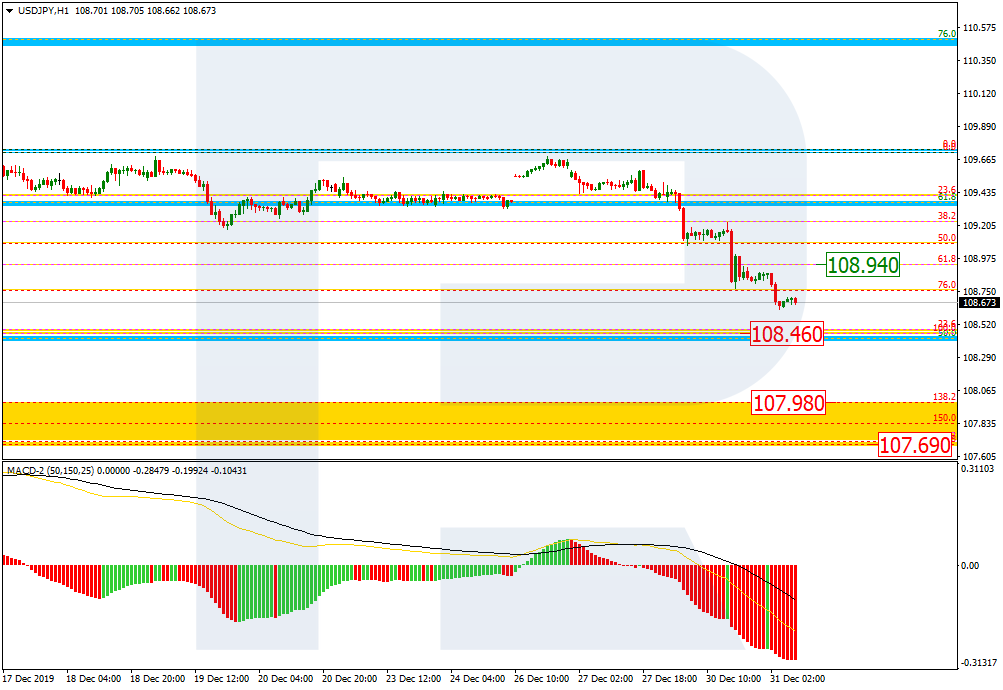
USDJPY, “US Dollar vs Japanese Yen”
USDJPY has finished the ascending impulse towards 108.40. Today, the pair may correct to reach 108.05 and then start another growth with the target at 108.76.
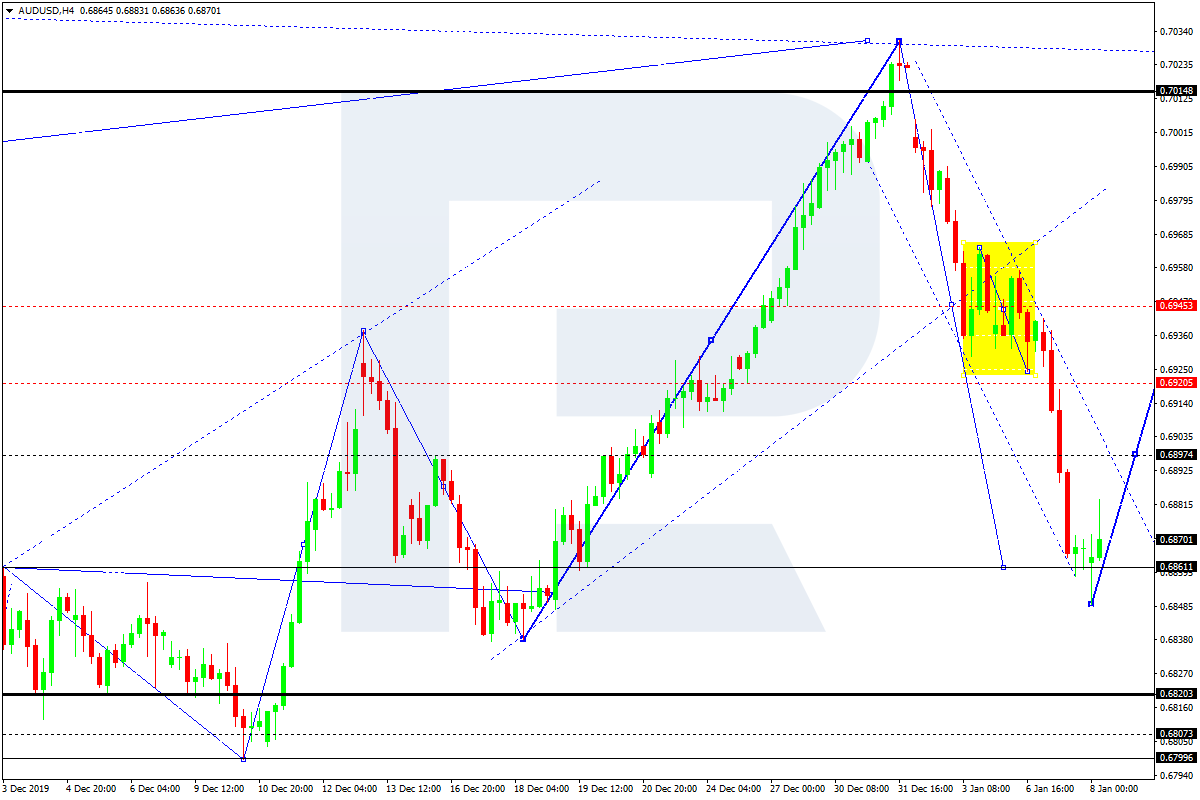
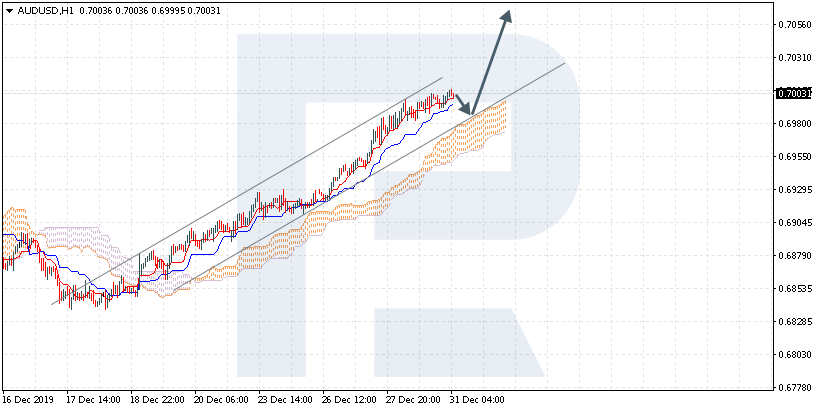
AUDUSD, “Australian Dollar vs US Dollar”
AUDUSD has reached 0.6860; right now, it is consolidating near the lows. Possibly, the pair may form one more ascending structure with the target at 0.6945.
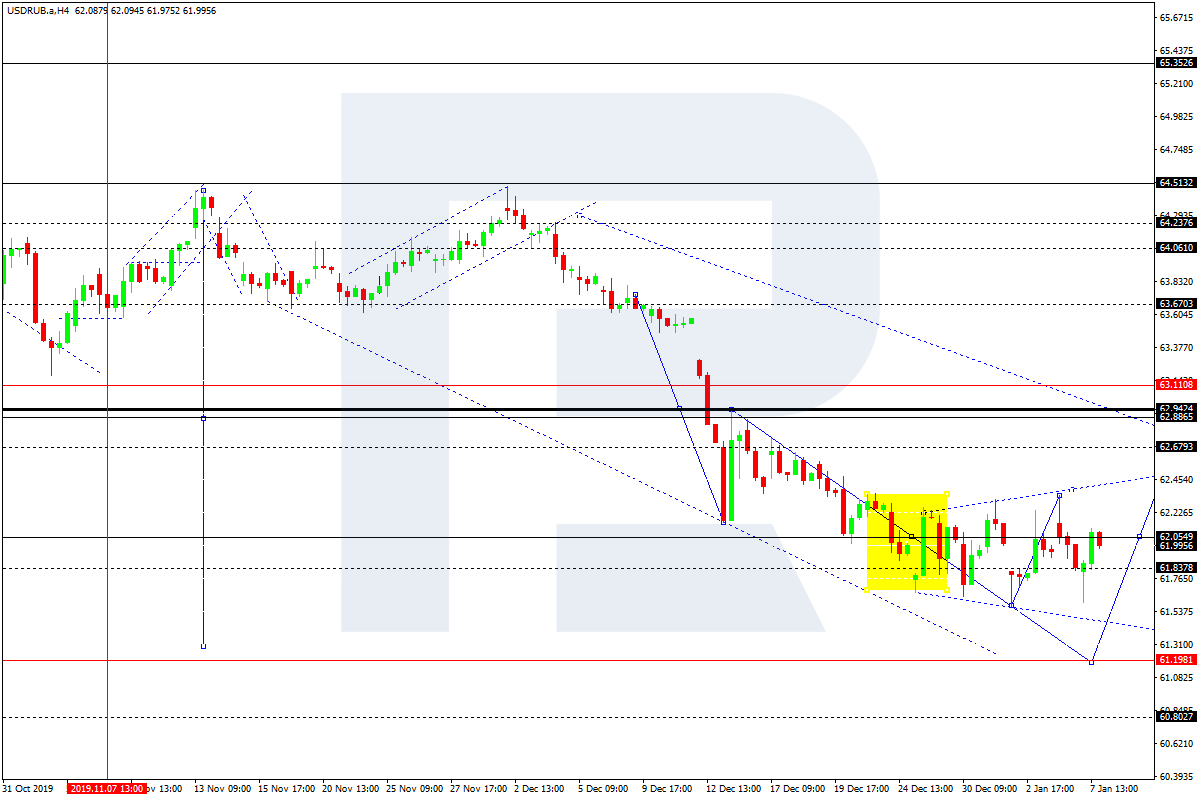
USDRUB, “US Dollar vs Russian Ruble”
USDRUB is consolidating around 62.00. The main scenario implies that the price may continue trading inside the downtrend towards 61.20. Later, the market may correct towards 63.00 and then resume moving downwards to reach 60.90.
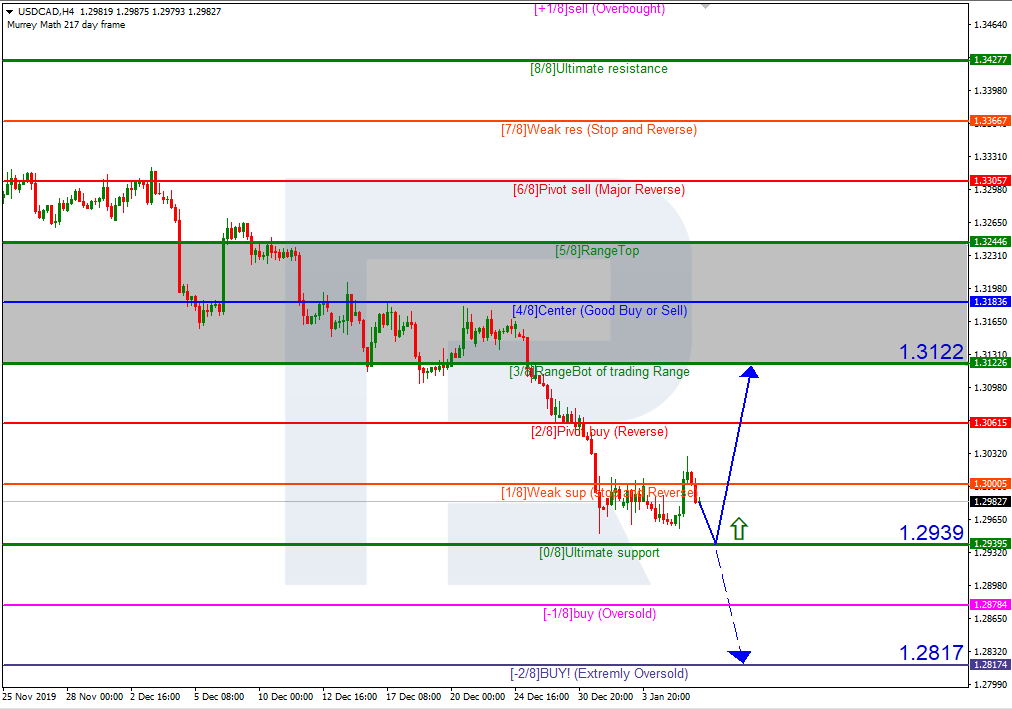
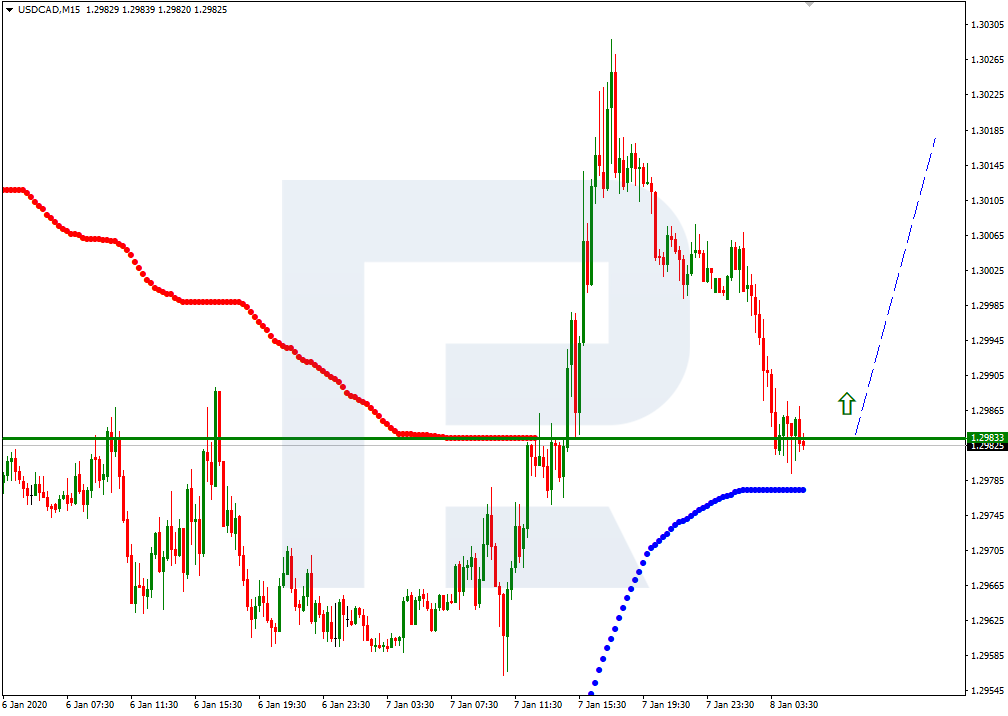
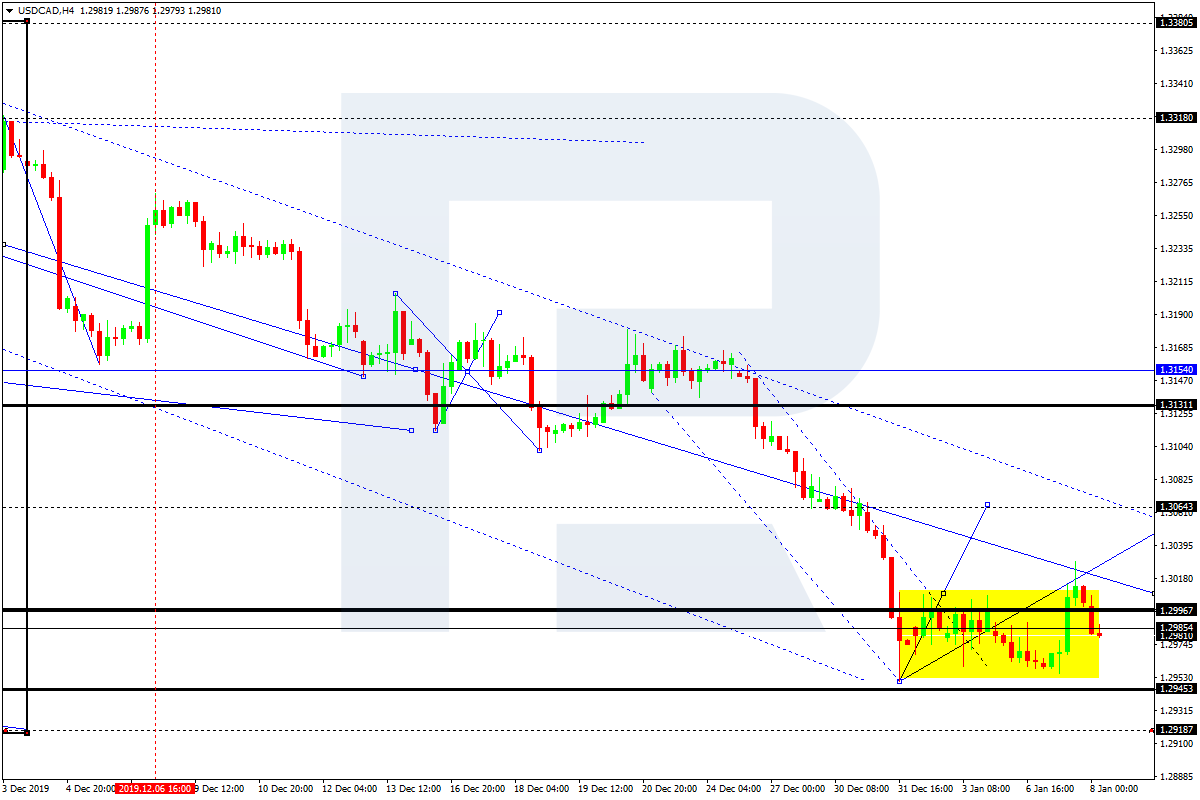
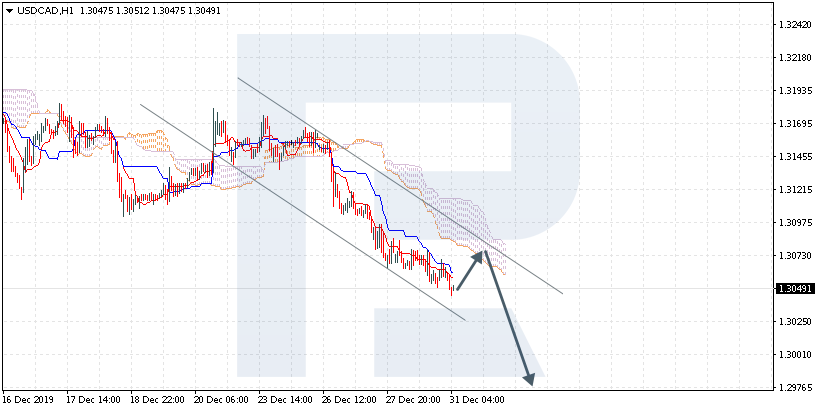
USDCAD, “US Dollar vs Canadian Dollar”
After reaching the short-term target at 1.2970, USDCAD continues moving downwards to reach 1.2950; right now, it is consolidating around 1.2985. Later, the market may break this range to the upside and start another correction towards 1.3060 and then form a new descending structure with the target at 1.2950.
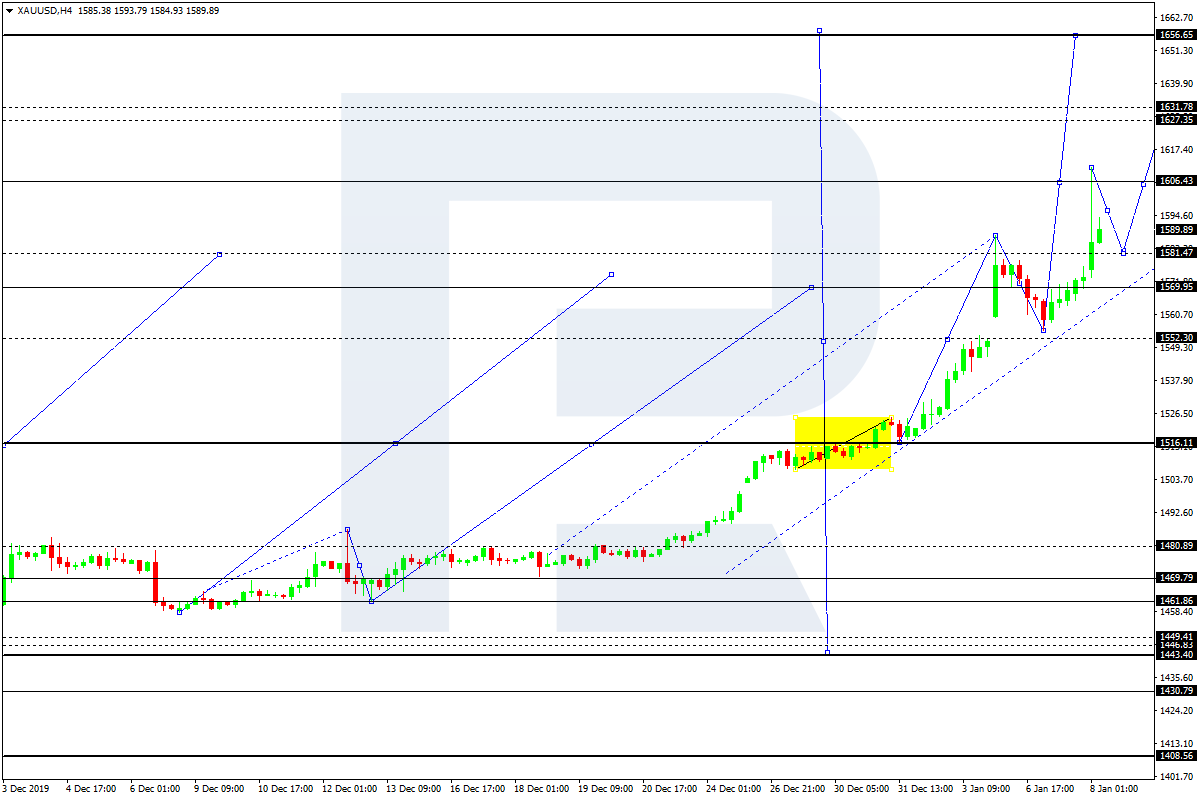
XAUUSD, “Gold vs US Dollar”
Gold continues moving upwards. Possibly, today the pair may test 1581.50 from above and then resume trading inside the uptrend towards with the target at 1627.38. After that, the instrument may start a new decline to reach 1606.50 and then form one more ascending structure towards 1656.65.
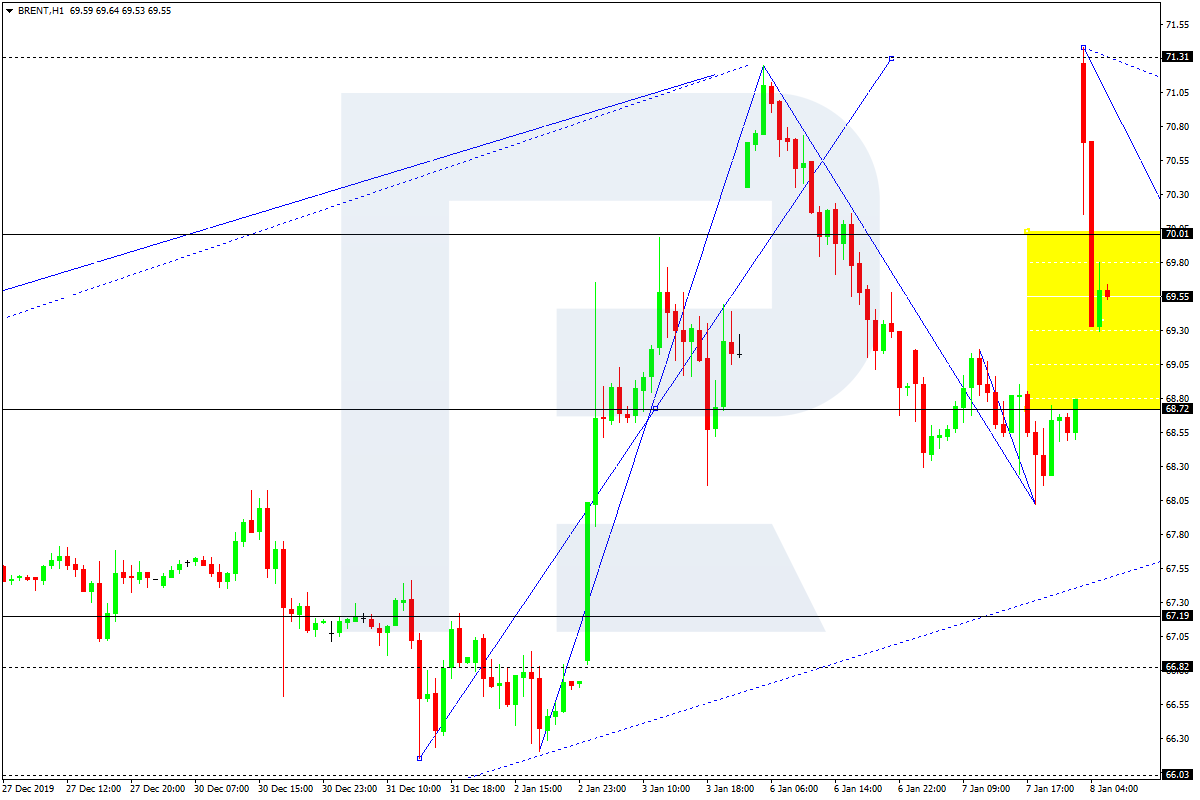
BRENT
Brent has reached the short-term target at 71.31; right now, it is correcting towards 69.72. After that, the instrument may resume trading upwards with the target is at 73.50.
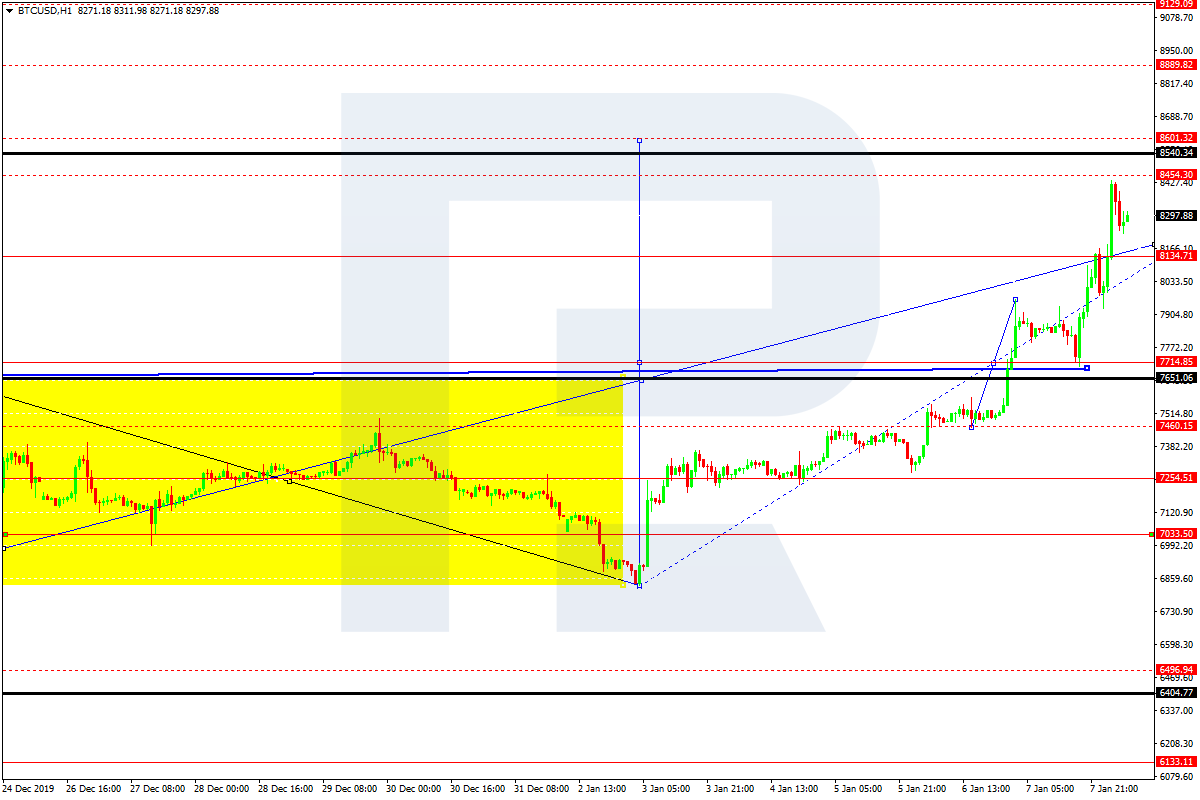
BTCUSD, “Bitcoin vs US Dollar”
After breaking 7700.00 to the upside, BTCUSD continues forming the third ascending wave towards 8600.00. Possibly, today the pair may reach this level and then start a new correction with the target at 7700.00.