rfxsignals October 9, 2025 No Comments

How to Use Bollinger Bands in MT4

How to Use Bollinger Bands in MT4
How to Use Bollinger Bands in MT4 | YOUR_DOMAIN

How to Use Bollinger Bands in MT4

By Approx. 9–12 min read
Master price volatility and trend with Bollinger Bands. This guide covers MT4 setup, settings, practical entries, exits, filters, and common mistakes — optimized for beginners and intermediate traders.

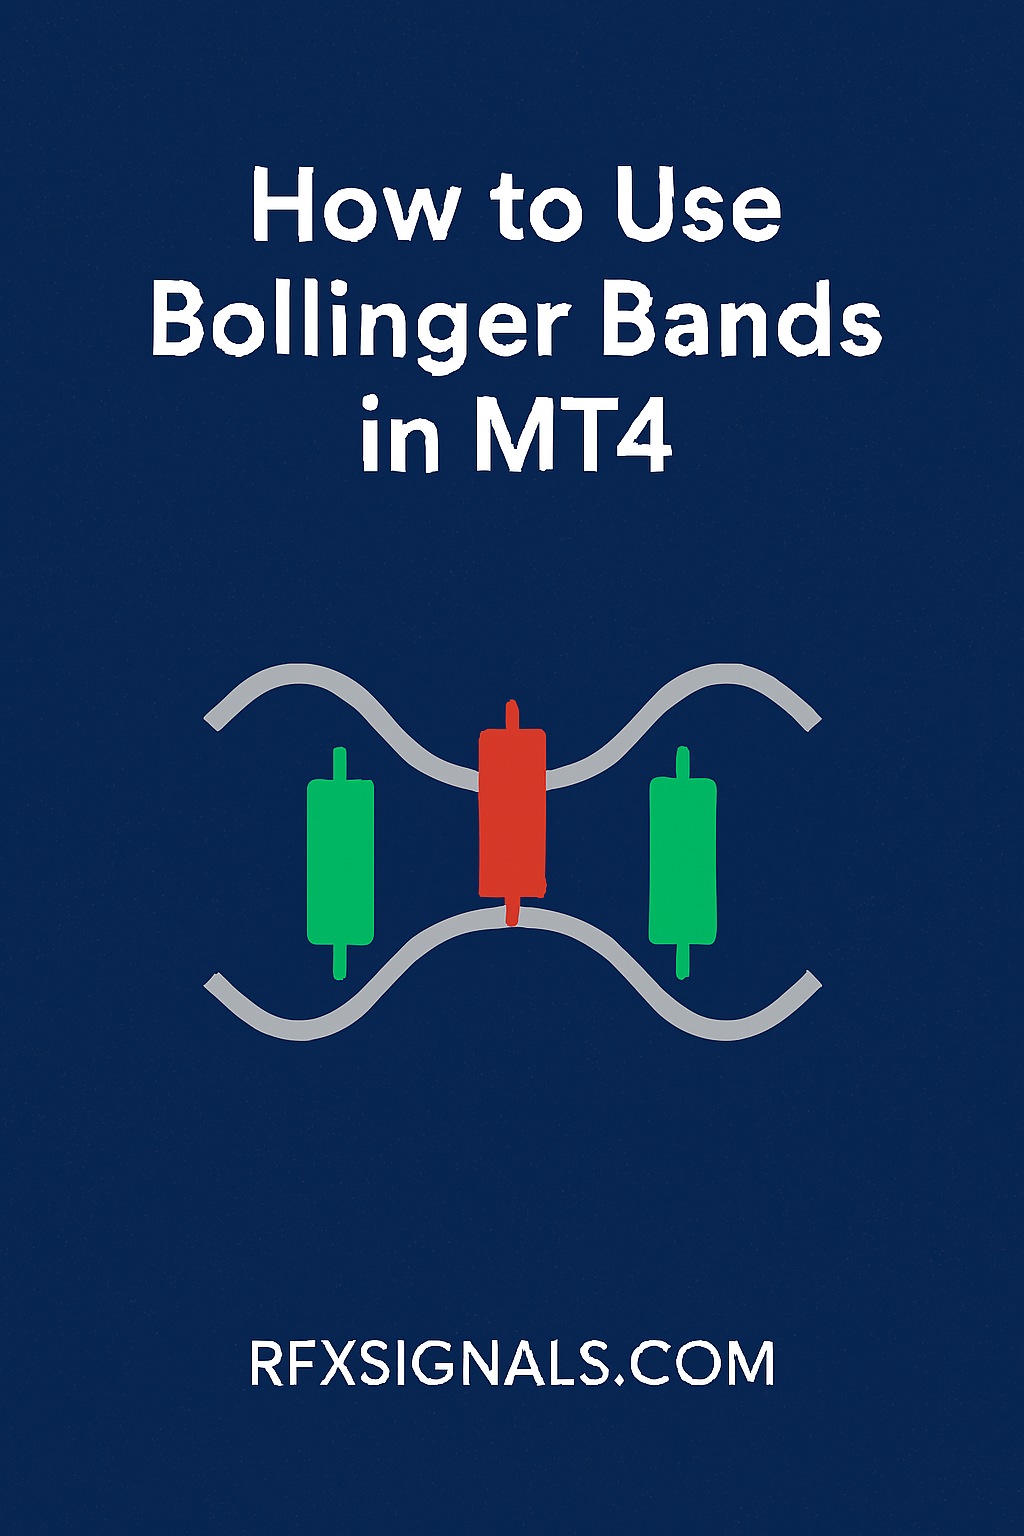
Bollinger Bands are one of the most popular volatility indicators used by forex traders. Invented by John Bollinger in the 1980s, they consist of a simple moving average (middle band) and two standard deviation bands (upper and lower). On MetaTrader 4 (MT4), Bollinger Bands are built-in and easy to apply. This article explains practical ways to use them for entries, exits, and risk management.

Understanding the components

The Bollinger Bands indicator includes three lines:

  • Middle band — typically a 20-period simple moving average (SMA)
  • Upper band — middle band + (k * standard deviation)
  • Lower band — middle band - (k * standard deviation)
The default k value is 2, which means the bands usually contain about 95% of price action in a normal distribution.

How to add Bollinger Bands in MT4

Open MT4, go to Insert > Indicators > Trend > Bollinger Bands. Use the default period 20 and deviation 2 to start. You can customize colors and line widths for clarity. Save the setup as a template so you can reuse it across charts.

Common settings and variations

While the default (20,2) is standard, traders tweak settings depending on timeframe and strategy:

  • Shorter period (10–15) — more responsive bands, more signals, but higher noise
  • Longer period (30–50) — smoother bands, fewer signals, better for longer-term trades
  • Deviation (1.5–2.5) — lower deviation tightens bands (more breakouts), higher deviation widens (fewer false breakouts)
Test settings in a demo/account before applying live.

Mean reversion vs breakout strategies

Bollinger Bands support two main approaches:

  1. Mean reversion — price tends to revert to the mean (middle band). Traders look to buy near the lower band and sell near the upper band, often combined with oscillators (RSI, Stochastic) to confirm oversold/overbought conditions.
  2. Breakout — strong trends often 'ride' the upper or lower band. A squeeze (narrow bands) followed by expansion often signals upcoming volatility. Traders enter on a breakout and use the middle band as a trailing stop or filter.

Practical entry rules (mean reversion)

Example rules for a mean reversion trade on H1/Daily:

  • Wait for price to touch or slightly pierce the lower band.
  • Confirm with RSI below 30 (or Stochastic in oversold region).
  • Enter a long when a bullish candle closes inside/beyond the band and momentum turns positive.
  • Place stop-loss a few pips below the recent low and target the middle band or upper band depending on reward-to-risk.

Practical entry rules (breakout)

Example breakout rules:

  • Identify a 'squeeze' — bands compressing for several periods.
  • Wait for price to close outside the band with increased volume or momentum confirmation.
  • Enter on the breakout candle close or on a retest to the band.
  • Use the middle band as initial trailing stop; target measured moves or ATR-based targets.

Using Bollinger Bands with other indicators

Bollinger Bands are stronger when combined with complementary indicators:

  • RSI/Stochastic — confirm overbought/oversold conditions for mean reversion.
  • ADX — gauge trend strength; avoid mean reversion when ADX shows a strong trend.
  • Volume — breakout with rising volume is more reliable (volume indicators in MT4 or tick volume).
  • ATR — use ATR to set stops and targets aligned with volatility.

Stops, position sizing & risk management

Never trade without defined stops. For mean reversion, stops should be tight (below swing low/high) because trades are countertrend. For breakouts, use wider stops since volatility may spike. Position size should be calculated using risk % per trade (e.g., 0.5–1% of account equity) and distance to stop-loss — use an MT4 position size calculator or spreadsheet.

Templates, alerts and automating on MT4

Save your Bollinger Bands setup as a chart template (Charts > Template > Save Template). Use MT4 alerts to notify when price crosses band levels (Alerts tab in Terminal) or add an indicator that pops up alerts. If you prefer automation, you can code a simple Expert Advisor (EA) that executes your confirmed Bollinger strategy — but always backtest thoroughly.

Common mistakes and how to avoid them

Avoid these pitfalls:

  • Using bands alone: Bollinger Bands are not a magic indicator. Combine with momentum and volume filters.
  • Forcing trades: Just because price touches a band doesn’t guarantee reversal — wait for confirmation.
  • Ignoring timeframe alignment: Use higher timeframe bias to filter lower timeframe entries.
  • Overfitting settings: Don’t optimize parameters to past data without forward-testing.

Backtesting and journaling

Backtest your Bollinger approach on historical data and log each trade in your journal. Track entry reason, stop, target, outcome, and notes. Measure win rate, average R, and expectancy. This objective approach separates lucky runs from a robust edge.

Example trade — step-by-step

Suppose EUR/USD H4 with BB(20,2): price squeezes for 8 bars, ATR falls, then a bullish candle closes above upper band with rising tick volume. Confirmation RSI crosses above 50. Entry: next candle open; stop: below breakout candle; target: 1.5–2x risk or middle band retest. Trail stop under middle band as price advances.

Quick tips

  • Default BB(20,2) is a good starting point.
  • Squeezes often precede volatility — be ready but patient.
  • Use higher timeframe bias to avoid false breakouts.

Related reading

Conclusion

Bollinger Bands are versatile — useful for both mean reversion and breakout strategies. On MT4 they’re easy to set up and customize. The key to success is clear rules, confirmation from complementary indicators, disciplined risk management, and thorough backtesting.


Disclaimer: Trading involves risk. This article is educational and not financial advice.

rfxsignals October 7, 2025 No Comments

What Is Leverage in Forex? Explained Simply

What Is Leverage in Forex? Explained Simply

What Is Leverage in Forex? — Explained Simply

Reading time: ~9–11 mins • Updated:

Leverage is a core feature of forex trading: it lets you control a large position with a relatively small amount of capital. That sounds great — and it can be — but leverage also magnifies losses. This guide explains what leverage and margin are, gives clear examples, and gives practical, safe rules that Indian traders can use to manage leverage responsibly.

Chat on WhatsApp Join our Telegram
Need a leverage checklist?
Downloads

What is leverage? The simple definition

Leverage lets you open positions larger than your account balance by borrowing a portion from the broker. It's expressed as a ratio — for example, 50:1 means you can control $50,000 of currency with $1,000 of your own money. Another way to say it: leverage = Position Size / Margin.

What is margin? How margin and leverage relate

Margin is the amount of money the broker requires you to deposit to open and maintain a leveraged position. Using 50:1 leverage, a $100,000 position requires $2,000 margin (100,000 / 50 = 2,000). If the market moves against you, margin requirements may increase and you could face a margin call or automatic closeout.

Clear examples — see how leverage works

Example 1 — low leverage

Account balance: ₹100,000. Leverage 10:1. You open a position worth ₹500,000 (0.5 lot equivalent). Margin required = 500,000 / 10 = ₹50,000. If the market moves 1% against you, loss = ₹5,000 (1% of ₹500,000) which is 5% of account.

Example 2 — high leverage

Same account: ₹100,000. Leverage 100:1. You open a position worth ₹1,000,000. Margin required = 1,000,000 / 100 = ₹10,000. A 1% adverse move causes a ₹10,000 loss — 10% of the account. Higher leverage magnifies both gains and losses.

Benefits of leverage (why traders use it)

  • Amplified returns: small capital can produce meaningful profits when the market moves in your favor.
  • Capital efficiency: allows diversification — you can allocate capital across multiple ideas without fully funding large positions.
  • Smaller initial capital needed: traders can access global FX markets with modest investment.

Risks of leverage (why it can be dangerous)

  • Magnified losses: losses scale with position size — a small adverse move can quickly wipe capital.
  • Margin calls & stop-outs: if equity falls below maintenance margin, the broker may close positions automatically.
  • Emotional stress & overtrading: higher leverage often leads to larger position sizes and poor risk decisions.

How brokers set maximum leverage

Brokers set maximum leverage based on regulation, internal risk policy, and instrument. In many regulated markets leverage limits have been reduced (for retail clients) to protect traders. In India, many brokers offer different leverage for INR pairs vs majors — always check contract specs.

How to choose the right leverage for you — practical rules

There’s no one-size-fits-all, but these rules keep you safe:

  • Rule 1 — Risk per trade: decide a fixed % of account to risk per trade (e.g., 0.25–1%). Use leverage to size positions so dollar risk equals that percentage.
  • Rule 2 — Use lower leverage for intraday/high-frequency trading: even intraday traders benefit from moderate leverage because frequent small losses add up.
  • Rule 3 — Stress test scenarios: simulate large moves (1–3%) to see if your account survives multiple adverse moves.
  • Rule 4 — Avoid using maximum available leverage: just because a broker offers 500:1 doesn’t mean you should use it.

Position sizing — the practical bridge between leverage & risk

Position sizing translates risk into lot size. Steps:

  1. Choose risk % of account (e.g., 0.5%).
  2. Decide stop-loss distance in pips and calculate pip value for your lot size.
  3. Compute lot size so that stop-loss × pip value × lots = chosen risk amount.

This method ensures you control absolute money risk regardless of leverage ratio.

Margin calls and stop-outs — what to expect

Brokers publish maintenance margin and stop-out levels. If your equity falls to the maintenance margin, you get a margin call or automatic position closures. To avoid this, keep sensible leverage, maintain spare margin, and do not risk excessive % of account on a single trade.

Leverage & overnight funding (swaps) — an extra cost

Leveraged positions often incur overnight financing (swap) if held across rollover. Higher leverage increases position size and therefore financing costs. Consider swap rates when holding leveraged positions overnight or longer.

Practical checklist — safe leverage use

  1. Decide your maximum account leverage (e.g., 10:1 or 25:1) based on your risk tolerance.
  2. Use % risk per trade (0.25–1%) and compute position size from stop-loss, not from leverage.
  3. Keep margin cushion — avoid trading to the full available margin.
  4. Account for swap costs and possible slippage during volatile events.
  5. Backtest and demo trade your strategy with the chosen leverage setting.

Leverage examples specific to INR traders

Indian traders should check whether their broker offers onshore INR pairs or offshore CFDs — leverage, margin, and tax/treatment can differ. For USD/INR pairs, brokers sometimes set different margin rules; always confirm with contract specs and support.

Common leverage mistakes & how to avoid them

  • Using max leverage for every trade: scale leverage to trade objective and volatility.
  • Poor stop placement: too tight stops with high leverage lead to frequent blow-ups — use ATR-based stops.
  • No contingency capital: maintain emergency margin to survive adverse runs.

SEO-friendly internal & external links to add

Add internal links to build topical authority and link out to reputable resources:

Final takeaway — leverage is a tool, not a shortcut

Leverage enables efficient capital use but greatly increases risk. The right approach is to decide risk first (fixed %), calculate position size using stop-loss, and only then let leverage be the mechanical enabler. Use demo testing, maintain margin cushions, and avoid the temptation to chase bigger profits by simply dialing up leverage.

#Forex#Leverage#RiskManagement#Trading
rfxsignals September 30, 2025 No Comments

The Role of Sentiment Analysis in Signal Generation

The Role of Sentiment Analysis in Signal Generation

The Role of Sentiment Analysis in Signal Generation

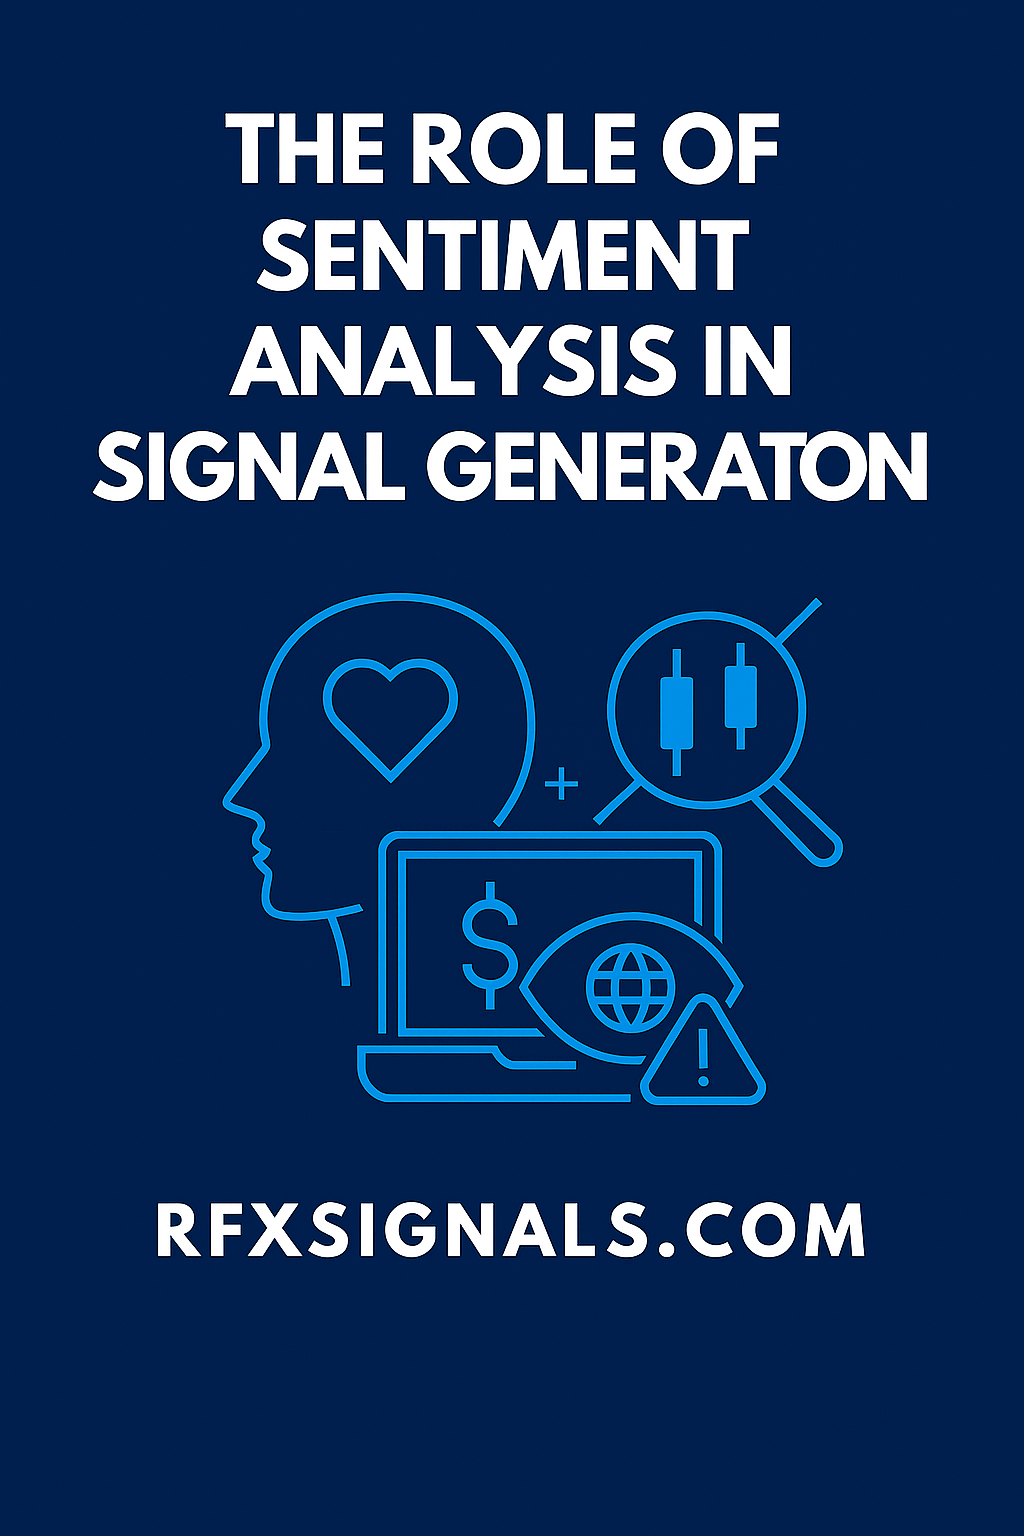
Sentiment — from news, social media, positioning and options markets — is a powerful input for trading signals when engineered properly. This guide explains what to use, how to convert it into features, how to backtest and how to avoid common pitfalls.

Why sentiment matters

Price reflects information and expectations — and sentiment is the market’s aggregated expectations, fear and greed. Quantifying sentiment gives you a view of crowd behaviour that complements price-based technical indicators and fundamental macro data. When used carefully, sentiment features can provide early warnings of momentum shifts, overextended positioning, or regime changes.

Sources of sentiment

Sentiment is not a single thing — it comes from multiple channels. The most useful sources for FX signal generation are:

  • News sentiment: headlines, article tone and event coverage intensity (NFP, CPI, central bank minutes).
  • Social sentiment: Twitter/X, Reddit, Telegram channel chatter and other public forums (volume, polarity, velocity).
  • Positioning: Commitments of Traders (COT), broker aggregated positions and proprietary flow indicators.
  • Options & derivatives: skew, implied volatility shifts, put/call ratios — these reveal hedging demand and tail risk pricing.
  • Search & consumer signals: Google Trends spikes or search volume for terms like “buy EURUSD” can be supporting evidence.

Feature design — convert raw sentiment into trading inputs

Raw text or large tables are not directly useful for backtests. Convert them into normalized, time-aligned features:

1. Sentiment polarity and intensity

Use NLP (lexicon + transformer-based classifiers) to assign polarity scores (−1 to +1) and an intensity/confidence metric. Aggregate at chosen timeframes (e.g., 5-minute, hourly, daily).

2. Volume & velocity

A sudden spike in mentions (velocity) often matters more than the average polarity. Create features for mention volume, rolling z-score of volume, and cross-source corroboration (news + social spike).

3. Event flags and surprise scores

For macro events, derive surprise scores: actual − consensus (e.g., CPI surprise). Use both signed surprise and absolute surprise as features — the former suggests direction, the latter suggests volatility.

4. Positioning imbalance

Convert COT or broker flows into net positioning ratios and percentile ranks (where does current net long/short sit relative to the last N years?). Extremes often precede mean reversion.

5. Options-derived signals

Track changes in implied volatility, skew, and large block implied moves. Rapid increases in IV before scheduled events can indicate elevated tail-risk pricing.

Signal construction patterns

There are several robust ways to combine sentiment with price data:

Filter signals

Use sentiment as a filter: only take a technical breakout if sentiment polarity and volume confirm the move. This reduces false breakouts triggered by noise.

Contrarian signals

Extreme bullish social sentiment combined with crowded long positioning can be a contrarian sell signal — especially when sentiment is unanimous and lacks nuance.

Momentum augmenters

Use positive sentiment velocity to increase sizing on momentum trades; reduce size when sentiment turns flat or negative.

Event-driven overlays

Around macro events, use sentiment + surprise to determine trade posture: if a rate decision surprises together with positive news and positive social sentiment, bias long in the short-window trade.

Backtesting sentiment-based signals — special care

Sentiment backtests require careful engineering to avoid look-ahead bias and survivorship pitfalls:

  • Time alignment: ensure your sentiment timestamps reflect when information would be available (publish time, not crawl time).
  • Data persistence: keep historical snapshots — social platforms allow edits and deletions; news articles can be updated.
  • Latency modelling: include ingestion latency. If you only receive social feeds with a 30s delay, simulate this delay in backtests.
  • Out-of-sample testing: use rolling walk-forward validation because sentiment regimes change (e.g., pre- and post-a regulatory event).
  • Pre-commitment: document your feature pipeline and refrain from heavy post-hoc feature engineering on the whole dataset.

Evaluation metrics that matter

Standard ML metrics are useful, but in trading focus on money metrics:

  • Net P&L after transaction costs and slippage
  • Sharpe / Sortino ratio
  • Max drawdown and time-to-recover
  • Signal latency impact on fill price (simulate slippage)
  • Consistency of performance across regimes (stress tests)

Common pitfalls & how to avoid them

Many developers trip on the same traps:

  • Echo-chamber bias: relying on a single social platform that reflects retail chatter only; always corroborate across sources.
  • Overfitting lexicons: building a tone classifier tailored to historical jargon that doesn’t generalize.
  • Positioning data gaps: treating incomplete COT data as complete — always check coverage and reporting lag.
  • Ignoring non-stationarity: sentiment meaning can change (e.g., memes vs. serious news); monitor feature drift.

Practical workflow example

A practical pipeline might look like this:

  1. Collect feeds: news wires, curated Twitter stream, COT reports, options chain snapshots.
  2. Preprocess: deduplicate, timestamp normalize, filter by language and region.
  3. Score: NLP polarity + confidence, volume z-scores, surprise calculations, positioning percentiles.
  4. Fuse: combine sentiment scores with technical indicators into a composite signal with weights or a trained model.
  5. Backtest: time-aware validation with latency and cost models.
  6. Deploy: run in demo mode first, monitor feature drift and live fills, and set retraining cadence based on performance decay.

Case study (illustrative)

In backtests, a EURUSD strategy that required both a 1-hour RSI confirmation and a positive news polarity spike within the prior 60 minutes reduced false breakouts by ~30% and improved net P&L after costs versus the technical-only variant. The tradeoff was fewer signals — but better quality and lower drawdown.

Conclusion — sentiment amplifies but rarely replaces

Sentiment analysis is a powerful amplifier when combined with price and fundamental data: it helps filter low-probability signals, detect crowd extremes, and gauge event impact. But it’s an input, not a silver bullet. Robust pipelines, careful backtesting, latency modelling and continuous monitoring are essential. Start small, test in realistic demo conditions, and treat sentiment as one pillar of a multi-faceted signal generation system.

Want our sentiment starter pack?

Download sample sentiment features, demo notebooks and a timestamped feed template to accelerate your testing.

Further reading (authoritative outbound links)

For NLP and financial text analysis background, reputable resources include arXiv, Investopedia, and practical tutorials from libraries like Hugging Face and Stanford NLP.

RTech RFX Signals
RTech RFX Signals

We build practical FX signals, backtesting tools and datasets to help traders make data-driven decisions.

rfxsignals September 29, 2025 No Comments

Top 5 Signal Providers Compared: Accuracy, Speed & ROI

Top 5 Signal Providers Compared: Accuracy, Speed & ROI
Top 5 Signal Providers Compared: Accuracy, Speed & ROI | RFXSIGNALS

Top 5 Signal Providers Compared: Accuracy, Speed & ROI

Choosing a signal provider isn’t just about claimed returns. Accuracy, execution speed, transparency, and realistic ROI assumptions matter most. This guide compares five leading provider types, the metrics to inspect, and a practical checklist so you can pick the right service for your goals.

Why comparing signal providers properly matters

Many providers advertise high returns, but those numbers are often cleaned, backtested, or cherry-picked. A meaningful comparison focuses on repeatable metrics: accuracy (how often signals are correct relative to expectation), speed (how fast the trade can be executed at advertised price), and ROI adjusted for risk, spread and slippage. The goal is to identify providers that deliver consistent edge under realistic conditions.

How we compare providers — the framework

We use five dimensions to compare providers:

  1. Accuracy: percent of winning trades vs total trades and expectancy.
  2. Speed & latency: time from signal to execution and slippage statistics.
  3. Realized ROI: net of spreads, commissions and typical slippage.
  4. Transparency & track record: live verified results, sample size, and reporting method.
  5. Risk management: position sizing rules, stop discipline, and max exposure limits.

The top 5 provider types (what you’ll usually find)

Providers cluster into types — each has strengths and trade-offs:

1. Human-curated signal services (experienced traders)

Pros: context-aware, adaptive to macro events, often conservative. Cons: limited capacity, human bias, slower execution. Best for: discretionary traders who want explanation & trade context.

2. Algorithmic/AI signal providers

Pros: scans many markets, runs 24/7, fast. Cons: risk of overfitting, opacity, needs monitoring. Best for: high-frequency or systematic traders comfortable with automation.

3. Copy-trading platforms (social/copy services)

Pros: easy to follow proven traders, good for passive users. Cons: crowd impact, leader survivorship bias, and platform risk. Best for: beginners who prefer hands-off execution—test with small capital first.

4. Hybrid services (signals + execution API)

Pros: combines algorithmic signal generation with human oversight or execution automation. Cons: higher cost, complexity. Best for: traders who want the speed of automation and safety of human checks.

5. Broker-provided signals & in-platform indicators

Pros: seamless execution, integrated. Cons: potential conflict of interest, limited transparency. Best for: traders wanting simplicity but verify fills carefully.

Quick comparison table (what to look for)

Provider TypeAccuracySpeedRealistic ROIBest For
Human-curatedModerate (50–65%)Slow-ModerateMediumDiscretionary traders
Algorithmic/AIVariable (45–70%)FastHigh (if robust)Systematic traders
Copy-tradingDepends on leaderVariesVariableBeginners
HybridHigher (if well-managed)FastHighSerious traders
Broker signalsModerateFastLow-MediumConvenience seekers

Deep dive: accuracy vs expectancy

Accuracy alone is misleading. A strategy with 70% wins but very small winners and large, rare losers can be disastrous. Expectancy — average P&L per trade — is the better single-number summary: Expectancy = (Win% × AvgWin) − (Loss% × AvgLoss). When comparing providers, request both win-rate and average win/loss size, not only percent winners.

Execution speed & slippage — the hidden ROI killer

A provider might publish fast signals, but your fills determine real ROI. If signals are delivered by chat or email, execution may be delayed, increasing slippage. Providers that offer direct API execution or broker integration generally minimize this problem. Always test on a demo account to measure real slippage against the provider’s claims.

Transparency & statistical validity

Beware of short track records and tiny sample sizes. A provider with 20 trades and 80% wins is far less convincing than one with 2,000 trades and 55% wins. Ask for: live verified statements (e.g., Myfxbook, broker statements), raw signal logs, and clear definitions of how they calculate returns.

Questions to ask any signal provider

  • Do you publish live results or only backtests?
  • How do you handle spread, slippage and commissions in reported ROI?
  • Can I get raw signal logs to independently backtest?
  • What’s your typical time-to-fill and recommended execution method?
  • How many concurrent clients use the same signal (crowd impact)?
  • What are the maximum drawdown and worst monthly loss historically?

A practical selection checklist (use before subscribing)

  1. Verify > 300 live trades or multi-year live track record.
  2. Confirm provider reports ROI net of realistic spreads and commissions.
  3. Forward-test on demo for 30–90 days and record slippage.
  4. Prefer providers that offer API/broker integration for fast fills.
  5. Check risk controls: max exposure, size caps, stop enforcement.

Case study (how small slippage reduces ROI)

Imagine a provider with 100 trades/month average return 1% per trade gross. If average slippage+spread eats 0.3% per trade, monthly net drops 30%. Over time, that gap compounds — so execution matters as much as signal accuracy.

How RFXSIGNALS approaches provider evaluation

We combine automated backtesting, live forward-samples, and independent verification. Our priority: realistic reporting, clear risk rules, and API execution where possible. If you want, we publish a sample signal log and a demo-forward test so subscribers can independently verify performance.

Pro tip: Always align signal risk with your personal risk budget. A high-ROI provider with extreme drawdowns may be unsuitable if you can’t stomach the volatility.

Related posts (internal & outbound link opportunities)

Final checklist & next steps

When choosing a signal provider, prioritize transparency, realistic ROI calculations, and execution quality. Start small, forward-test, and only scale after verifying fills, slippage, and risk controls in your broker. If you want a personalized shortlist based on your capital, pair preferences and risk tolerance, reply with "Shortlist me" and we’ll prepare a tailored comparison.

Published: Reading time: ~9–11 min Tags: signal-providers, forex-signals, ROI, execution
rfxsignals September 29, 2025 No Comments

The Psychology Behind Signal-Based Forex Trading Decisions

. The Psychology Behind Signal-Based Forex Trading Decisions
The Psychology Behind Signal-Based Forex Trading Decisions | RFXSIGNALS

The Psychology Behind Signal-Based Forex Trading Decisions

Signal providers deliver opportunities — but how traders interpret, trust, and act on those signals is a psychological process. This guide explores biases, emotion, discipline, decision frameworks, and practical steps to make signal-based trading more consistent and profitable.

Why psychology matters in signal-driven systems

Signals offer a mechanical set of triggers — but the human who receives that signal must decide whether to act, modify, or ignore it. Psychological factors determine consistency, risk-taking, and how traders react during drawdowns or streaks. Even the best signal can underperform if traders fail to follow discipline or misinterpret confidence levels.

Common cognitive biases that affect signal-based trading

Confirmation bias

Traders tend to look for information that confirms their beliefs. If a trader expects a signal to be profitable, they may overemphasize supporting indicators and ignore evidence to the contrary. This leads to holding losing trades too long or reporting skewed feedback to signal providers.

Recency bias

Recent wins or losses dominate perception. A string of winning signals can make a trader overconfident; a run of losses may cause panic or abandonment of a viable system. Effective systems counter recency bias by relying on long-term metrics, not short-term streaks.

Loss aversion & risk framing

People feel losses more intensely than equivalent gains. This can cause under-sizing winners, moving stops, or exiting early. Proper position-sizing rules and pre-defined stop-loss behavior are key to preventing emotion-driven changes.

Action bias

Traders prefer doing something over doing nothing. When a signal conflicts with noise or when performance stalls, action bias can lead to overtrading, shifting strategies frequently, and destroying edge. A strong execution plan reduces the urge to act impulsively.

Signal interpretation: confidence, probability, and context

Not all signals are equal. Good providers include a confidence score or probability estimate. Traders should interpret signals probabilistically — e.g., a signal with 60% probability should be treated differently than a 90% confidence signal. Context matters: the same signal near a high-impact economic release or low liquidity hour carries different execution risks.

Tip: use signal buckets

Classify signals into buckets (high/medium/low confidence) and map different position-sizing rules to each bucket. This aligns risk with expected edge and reduces emotional reactions when low-confidence signals fail.

Discipline, routines, and decision frameworks

Consistent behavior beats intuition. Create a pre-trade checklist that includes: signal ID, confidence bucket, pair/timeframe, planned entry/SL/TP, and maximum capital at risk. After each trading day or week, run a short review to track adherence and outcomes. Routines automate good behavior and expose deviations quickly.

Daily checklist example

  • Review active signals and confidence levels.
  • Check macro calendar and liquidity windows.
  • Confirm order execution method (manual/auto) and expected fills.
  • Log any deviations from the plan with a reason.

Managing emotions during drawdowns and streaks

Drawdowns are inevitable. The goal is to survive them with capital and sanity intact. Implement hard risk caps (max drawdown limit), step-down rules (reduce size after X losing trades), and forced cooling periods if drawdown thresholds hit. These rules prevent emotionally-driven ruinous recovery attempts.

Trust but verify — backtesting, forward-testing, and live sampling

Trust in signals should be earned. Require backtested metrics, but more importantly, forward-test on a demo or micro account to observe live slippage and execution behavior. Keep a live-sample log for at least 30–90 days before scaling. Seeing real results builds rational trust and reduces the temptation to alter rules prematurely.

Social proof, group behavior & herd mentality

Signal channels and group chats can amplify herd behavior. When dozens of traders act on the same signal simultaneously, execution quality and slippage can worsen. Use staggered entries, limit orders, or size caps to mitigate crowd impact. Be cautious about copying large crowd trades without understanding execution mechanics.

Designing a psychologically-resilient signal process

  1. Clear rules: unambiguous entry, stop, and exit rules remove interpretation variance.
  2. Graded risk: size trades to confidence buckets — smaller size for lower confidence.
  3. Pre-commitment devices: use limit orders, automation, or two-step confirmations to avoid emotional changes.
  4. Logging: maintain a simple trading journal that records the signal id, your action, and post-trade notes.
  5. Review cadence: weekly metric check and monthly strategy review to spot psychological leaks.
Mental model: Treat signals like probabilistic bets. The goal is to optimize a sequence of bets, not any individual trade. Measured, repeatable behavior compounds edge over time.

Role of automation to reduce human error

Automation reduces action bias and emotional interference. Simple automation — auto-entry at next bar open, fixed stops, and scheduled daily checks — preserves discipline. However, full automation must include safety nets: circuit breakers, max concurrent trades, and human override for abnormal market events.

Practical checklist for traders using signals

  1. Confirm signal confidence and bucket; size accordingly.
  2. Use a pre-trade checklist (entry, SL, TP, size, context).
  3. Implement hard risk limits and cooling rules for losing streaks.
  4. Forward-test live for 30–90 days before scaling capital.
  5. Keep a concise trade log and monthly performance review.

Related posts (internal & outbound link opportunities)

Final thoughts — trade signals, not emotions

Signals provide opportunities; psychology decides outcomes. By building clear rules, aligning risk with signal confidence, automating execution where sensible, and maintaining disciplined review habits, traders can reduce psychological leaks and let signal edge compound over time. If you’d like a downloadable pre-trade checklist and a sample trade-log CSV to start tracking, reply "Send checklist" and I’ll generate them for you.

Published: Reading time: ~9–11 min Tags: trading-psychology, signals, forex, RFXSIGNALS
rfxsignals September 25, 2025 No Comments

How to Create Your Own Forex Strategy and Test It

How to Create Your Own Forex Strategy and Test It
How to Create Your Own Forex Strategy and Test It | RFXSignals
Free Signals • Community: Telegram

How to Create Your Own Forex Strategy and Test It

Overview: Building a forex strategy that fits your capital, schedule and temperament is the single most important step toward consistent trading. This practical guide walks you through idea generation, defining rules, backtesting, forward-testing, measuring performance, and iterating — plus how to use RFXSignals resources and community channels for templates, trade examples, and checklist downloads.

Want ready-made templates & sample journals?

Join our Telegram & WhatsApp communities to get strategy templates, Excel backtest sheets, and example trade logs shared weekly.

Step 1 — Start with a clear objective

Define what you want the strategy to achieve. Be specific:

  • Timeframe — scalping (M1–M5), intraday (M15–H1), swing (H4–Daily).
  • Target return & risk — e.g., 10% annual growth with max drawdown 8%.
  • Max trade frequency — how many trades per day/week you can realistically manage.

Having a clear objective helps you choose indicators, timeframes and rules that match your life and capital.

Step 2 — Define your edge (idea)

Your edge can be a simple price-action setup, a technical filter, or a hybrid. Examples of edges:

  • Breakout of consolidation confirmed by ATR expansion.
  • Pullback to EMA(50) in the direction of daily trend with RSI confirmation.
  • SMC order block retest on H4 leading to continuation.

Write the idea in one sentence. Example: “Buy EUR/USD on H1 when price pulls back to the 50 EMA and forms a bullish rejection candle while Daily trend is up.”

Step 3 — Turn the idea into unambiguous rules

Rules must be testable. Convert fuzzy language into precise conditions:

  • Entry: EMA(50) slope > 0 on Daily; H1 price closes above EMA(50) after a wick rejection of at least 0.5 × ATR(14).
  • Stop: place stop 1.2 × ATR(14) below entry or below the structure low.
  • Target: 2× risk or trailing using ATR-based stop.
  • Position sizing: risk 0.5% per trade.

Document every parameter so a backtest can apply them exactly.

Step 4 — Collect & prepare data for backtesting

Good data is essential. Use reliable historical price with spreads and commission where possible:

  • Get at least 2–5 years of tick or minute data for intraday systems; daily OHLC is fine for swing strategies.
  • Include realistic spread and slippage assumptions (e.g., 0.5 pip for EUR/USD + 1 pip slippage for market entries).
  • Correct for missing data and time-zone mismatches.

Step 5 — Backtest systematically

Start with simple tools—Excel for manual rules, or a platform like TradingView (Pine), MetaTrader (EA), or Python for automated testing. Key steps:

  1. Implement exact entry/exit logic.
  2. Run the test across your dataset and record trades.
  3. Simulate commissions, spread and realistic fills.

Important metrics to record:

  • Profit factor, expectancy, win rate, average win/loss.
  • Maximum drawdown and run-up behavior.
  • Average trade length and number of trades per period.
Tip: Don’t obsess over win rate. A low win rate system can be profitable if the winners are big enough (positive expectancy). Focus on expectancy and drawdown control.

Step 6 — Walk-forward & out-of-sample testing

To reduce curve-fitting risk, apply these practices:

  • Split data: use 70% in-sample for development and 30% out-of-sample for testing.
  • Walk-forward: re-optimize on a rolling window (e.g., optimize on 1 year, test on next 6 months) to validate stability.
  • Parameter sensitivity: test a range of parameters (e.g., EMA 45–55) to ensure small changes don’t destroy results.

Step 7 — Forward-test on demo (paper-trade)

Run the system on a live demo account for a minimum of 4–12 weeks, using the exact money management and execution rules. Forward testing verifies real-world behavior (slippage, partial fills, human reaction) that backtests may not capture.

Step 8 — Measure & monitor portfolio metrics

Track both per-trade and portfolio-level metrics:

  • Monthly P/L and drawdown curves.
  • Expectancy (average R × win rate).
  • Sharpe or Sortino ratios, and trade frequency consistency.

Step 9 — Iterate: improve, not overfit

Use insights from backtest and forward-test to improve the strategy. Typical improvements:

  • Add a filter to avoid low-probability regimes (e.g., ADX < 18 blocks trend trades).
  • Adjust position sizing or incorporate volatility scaling (risk per trade proportional to ATR).
  • Introduce execution rules (delay entries at news time, avoid thin liquidity periods).

Every change should be retested out-of-sample to ensure robustness.

Step 10 — Deployment & risk controls

When you go live with real capital:

  • Start small (10–25% of demo sizing) and scale up as you confirm live performance.
  • Implement portfolio-level risk caps: daily loss limit, max open risk, and monthly drawdown stop.
  • Keep automated alerts and a manual override to pause trading on anomalies.

Practical templates & journal

Maintain a trade journal with these fields: date, pair, timeframe, strategy tag, entry, stop, target, risk (%), outcome, emotion, and lesson learned. RFXSignals members can request sample Excel templates and backtest spreadsheets in our Telegram/WhatsApp channels.

Link Building & Funnel — How to use this article to grow traffic

Checklist before you call a strategy 'ready'

  • Backtested with 2+ years of realistic data (spreads & slippage included).
  • Out-of-sample tests show consistent edge.
  • Forward-tested on demo for 4–12 weeks with positive expectancy.
  • Defined position sizing and portfolio risk limits.
  • Trade journal and routine in place for ongoing improvement.

Need strategy templates or a walkthrough?

Join RFXSignals to download backtest spreadsheets, demo templates and example trade logs — or ask in Telegram for a free review of your strategy draft.

Conclusion & next steps

Creating your own forex strategy is iterative work: idea → rules → backtest → forward-test → live with controls. Keep changes measured, avoid overfitting, and rely on data-driven decisions rather than hope. Use the RFXSignals community for templates, peer reviews, and real-world examples to accelerate your learning curve.

Disclaimer: This article is educational and not financial advice. Forex trading carries risk — always test thoroughly on demo accounts and trade only with capital you can afford to lose.

rfxsignals September 25, 2025 No Comments

Secret Forex Strategies Banks Don’t Want You to Know

Secret Forex Strategies Banks Don’t Want You to Know
Secret Forex Strategies Banks Don’t Want You to Know | RFXSignals

Secret Forex Strategies Banks Don’t Want You to Know

It’s no secret that big banks and institutional traders control a large portion of the forex market. They move billions of dollars daily, often pushing prices in ways that retail traders struggle to understand. But here’s the truth: the strategies banks use are not impossible to learn. With the right knowledge and daily practice, you can begin to align your trades with the smart money flow instead of trading against it.

🚀 Get Access to Smart Money Trading Signals

Stay ahead of the banks by joining our trading groups with daily forex signals, charts, and strategies explained in detail.

Join Telegram Join WhatsApp

How Banks Trade Differently from Retail Traders

Banks trade based on liquidity, not retail indicators. While many retail traders chase RSI overbought signals or MACD crosses, banks focus on:

  • Liquidity zones: Areas where retail stop-losses are clustered.
  • Order blocks: Large institutional buy/sell zones left on charts.
  • Market cycles: Accumulation, manipulation, expansion, distribution.
  • News catalysts: Using events to trigger liquidity hunts.

The Secret Strategies Banks Use

1. Stop Hunt Strategy

Banks intentionally push the price to trigger stop losses set by retail traders. Once liquidity is captured, price often reverses in the opposite direction. This is why many traders experience “perfect stop-outs.”

2. Smart Money Concept (SMC)

This strategy revolves around identifying institutional order blocks, fair value gaps, and market structure shifts. Banks use this to build positions before major moves. You can read our full SMC Forex Strategy Guide for deeper insights.

3. Market Manipulation & Fake Breakouts

Often, breakouts in the forex market are traps. Banks create false breakouts to trigger retail entries, only to reverse the market. Learning to identify these traps gives you an advantage.

4. High-Frequency Scalping

Banks also utilize algorithms to scalp tiny profits across hundreds of trades per day. Retail traders can mimic a simplified version with strict scalping strategies.

5. Daily Bias Control

Institutions often set the daily direction early in the London session. Knowing how to identify the daily bias gives retail traders a chance to trade alongside the trend instead of against it.

Why Retail Traders Lose

Banks know that retail traders:

  • Over-leverage accounts chasing quick profits.
  • Trade against the trend due to emotions.
  • Ignore liquidity and institutional footprints.
  • Lack consistent risk management.

By adopting institutional trading concepts, you can stop being on the losing side of the trade.

📈 Trade with the Institutions

Don’t fight the banks—trade with them. Get real-time forex signals that follow institutional strategies.

Visit RFXSignals Join Telegram Join WhatsApp

How You Can Apply These Strategies

Retail traders don’t need billions in capital to apply institutional methods. Here’s how:

  1. Learn to spot liquidity pools: Look for areas with obvious stop clusters.
  2. Understand market structure: Identify shifts that indicate accumulation or distribution.
  3. Use order blocks: Trade from the zones where institutions leave footprints.
  4. Control risk: Never risk more than 1–2% of capital per trade.
  5. Join professional signal providers: Platforms like RFXSignals help retail traders align with smart money flows.

Practical Example of a Bank Strategy in Action

Imagine EUR/USD consolidates in a tight range before a major news release. Retail traders place stops above resistance and below support. Banks trigger a breakout above resistance, stop out shorts, then reverse price sharply downward, aligning with the true institutional direction. Traders aware of liquidity hunts would avoid the trap and capitalize on the reversal.

Final Thoughts

Banks don’t want you to know these strategies because the forex market thrives on liquidity provided by retail traders. But now that you understand how institutional players operate, you can trade smarter, avoid traps, and grow consistently.

👉 Ready to trade like the banks? Join our Telegram channel or WhatsApp group today to get access to premium signals and insights.

rfxsignals September 25, 2025 No Comments

Daily Forex Strategy: Simple Rules for Long-Term Growth

Daily Forex Strategy: Simple Rules for Long-Term Growth
Daily Forex Strategy: Simple Rules for Long-Term Growth | RFXSignals

Daily Forex Strategy: Simple Rules for Long-Term Growth

Quick summary: Building a reliable daily forex routine based on a few repeatable rules dramatically improves the odds of long-term success. This guide gives you a practical, day-by-day blueprint — market selection, entry filters, position sizing, journaling and how to use RFXSignals for live trade ideas and community support.

Get Daily Trade Ideas & Grow Consistently

Join our community to receive daily market scans, clear trade setups, and risk parameters — ideal for traders seeking steady long-term growth.

Why a daily strategy beats random trading

Random entries and emotional reactions are the fastest way to deplete an account. A daily strategy replaces emotion with routine. It forces you to: 1) prepare before the session, 2) select only the best setups, and 3) execute with strict risk rules. Over months and years, consistent small edges compound far better than occasional big wins.

Core principles of this daily strategy

  • Simplicity: Keep the rules repeatable and time-efficient — you should be able to run your daily routine in 20–40 minutes.
  • Edge focus: Only take setups that provide clear risk/reward and confluence (structure + indicator + session bias).
  • Risk control: Never risk more than a fixed percent per trade and cap total daily risk.
  • Journal everything: Track why you entered, the outcome, and adjustments — learning accelerates when recorded.

Daily routine — a practical 6-step workflow

1. Pre-market scan (10 minutes)

Open your watchlist of 6–8 currency pairs (majors + a preferred minor). Check the Daily chart for trend, key levels, and any upcoming economic releases. Mark pairs with clear bias (bullish or bearish) for the day.

2. Higher-timeframe context (5 minutes)

Look at H4 and Daily to confirm market structure: trending, ranging, or consolidating. Prefer trades that align with the higher-timeframe bias — e.g., only longs when Daily trend is bullish (price above SMA200) unless you’re explicitly trading reversals.

3. Identify 1–3 high-quality setups (5–10 minutes)

From your scan, select the top setups that meet your rules — pullback to structure, breakout with momentum, or a clean SMC order block retest. Limit yourself to 1–3 trades/day to maintain focus and manage risk.

4. Fine-tune entries on lower timeframes (5–10 minutes)

Use H1 and M15 for precise entries: wait for confirmation (rejection candle, micro structure break, or confluence with moving averages). Avoid chasing; patience improves odds.

5. Set stops, targets and position size (2–5 minutes)

Calculate position size so your risk per trade is fixed (e.g., 0.5% of account). Place stop-loss based on technical structure (below swing low, below order block, or 1.5× ATR), and define a target or trailing rule. Consider scaling out (e.g., 50% at first target, trail remaining).

6. Post-session review (5–10 minutes)

Record trade details in your journal: charts, rationale, emotions, and outcome. Update a simple monthly KPI sheet: win rate, average R, expectancy, and drawdown. Use this to refine rules monthly.

Entry filters & trade types included

This daily strategy focuses on three clean trade types — choose the one that fits your personality and time availability:

  • Trend pullbacks: Enter on pullbacks to moving averages or support within a confirmed trend.
  • Breakout with confirmation: Wait for a retest after the breakout or for a momentum candle to confirm continuation.
  • Structure-based reversals (SMC style): Use order blocks, liquidity pools and higher-timeframe structure shifts for measured reversal entries.

Position sizing & risk rules

Consistent sizing beats big bets. Follow these rules:

  • Risk per trade: 0.25%–1% depending on account size and experience (beginners: 0.25–0.5%).
  • Daily risk cap: If you lose a set percent (e.g., 2–3% of equity) stop trading for the day and review.
  • Max concurrent risk: Limit the sum of open trade risks (e.g., no more than 3% at any time).
Example: On a $5,000 account with 0.5% risk per trade, risk = $25. If your stop distance is 25 pips, your lot size should reflect $1 per pip to keep risk aligned.

Psychology & discipline — the unseen edge

Most traders fail because of poor psychology, not lack of a system. The daily routine enforces discipline by limiting impulsive trades and focusing on high-quality setups. Use these behavioral rules:

  • Only trade setups that meet your checklist — no exceptions.
  • Accept losses quickly; winners will come if your edge is real.
  • Avoid revenge trading after a loss — pause and journal instead.

Journaling template (simple)

  1. Date / Time / Pair
  2. Strategy type (pullback, breakout, reversal)
  3. Higher-timeframe bias
  4. Entry price, stop, target, position size
  5. Rationale (2–3 bullet points)
  6. Outcome & notes (emotion, execution, slippage)

Monthly review metrics

Track these KPIs each month to ensure your approach is improving:

  • Number of trades
  • Win rate
  • Average R (reward-to-risk)
  • Expectancy (average R × win rate)
  • Max drawdown and return on equity

Link Building & Funnel: How to channel readers to RFXSignals

Practical example — a daily trade walkthrough

1) Pre-market: EUR/USD shows Daily uptrend and H4 pullback to the 50 EMA. 2) Scan selects EUR/USD as top trade. 3) On H1, price forms a bullish rejection candle at 50 EMA with volume spike. 4) Entry placed on confirmation candle close; stop below swing low; target at recent swing high (1.8R). 5) Trade management: take 50% at first target, trail the rest using 1×ATR trailing stop. 6) Journal entry logged with outcome and notes.


Want Daily Scan & Trade Ideas Delivered?

Join RFXSignals for pre-market scans, annotated charts and clear risk parameters — perfect to follow this daily plan with confidence.

Conclusion & next steps

Long-term growth in forex is less about finding a perfect indicator and more about building a daily process you can repeat without emotion. Use the routine above, limit yourself to the best setups, enforce risk controls, and keep a disciplined journal. Over time, small consistent edges compound into meaningful returns.

If you’d like, we provide a downloadable daily checklist and a monthly KPI spreadsheet to help you implement this system — join our Telegram or WhatsApp channels to get instant access and sample templates.

Disclaimer: This article is educational and not financial advice. Forex trading involves significant risk and may not be suitable for everyone. Always test strategies on demo accounts and trade only with capital you can afford to lose.

rfxsignals September 25, 2025 No Comments

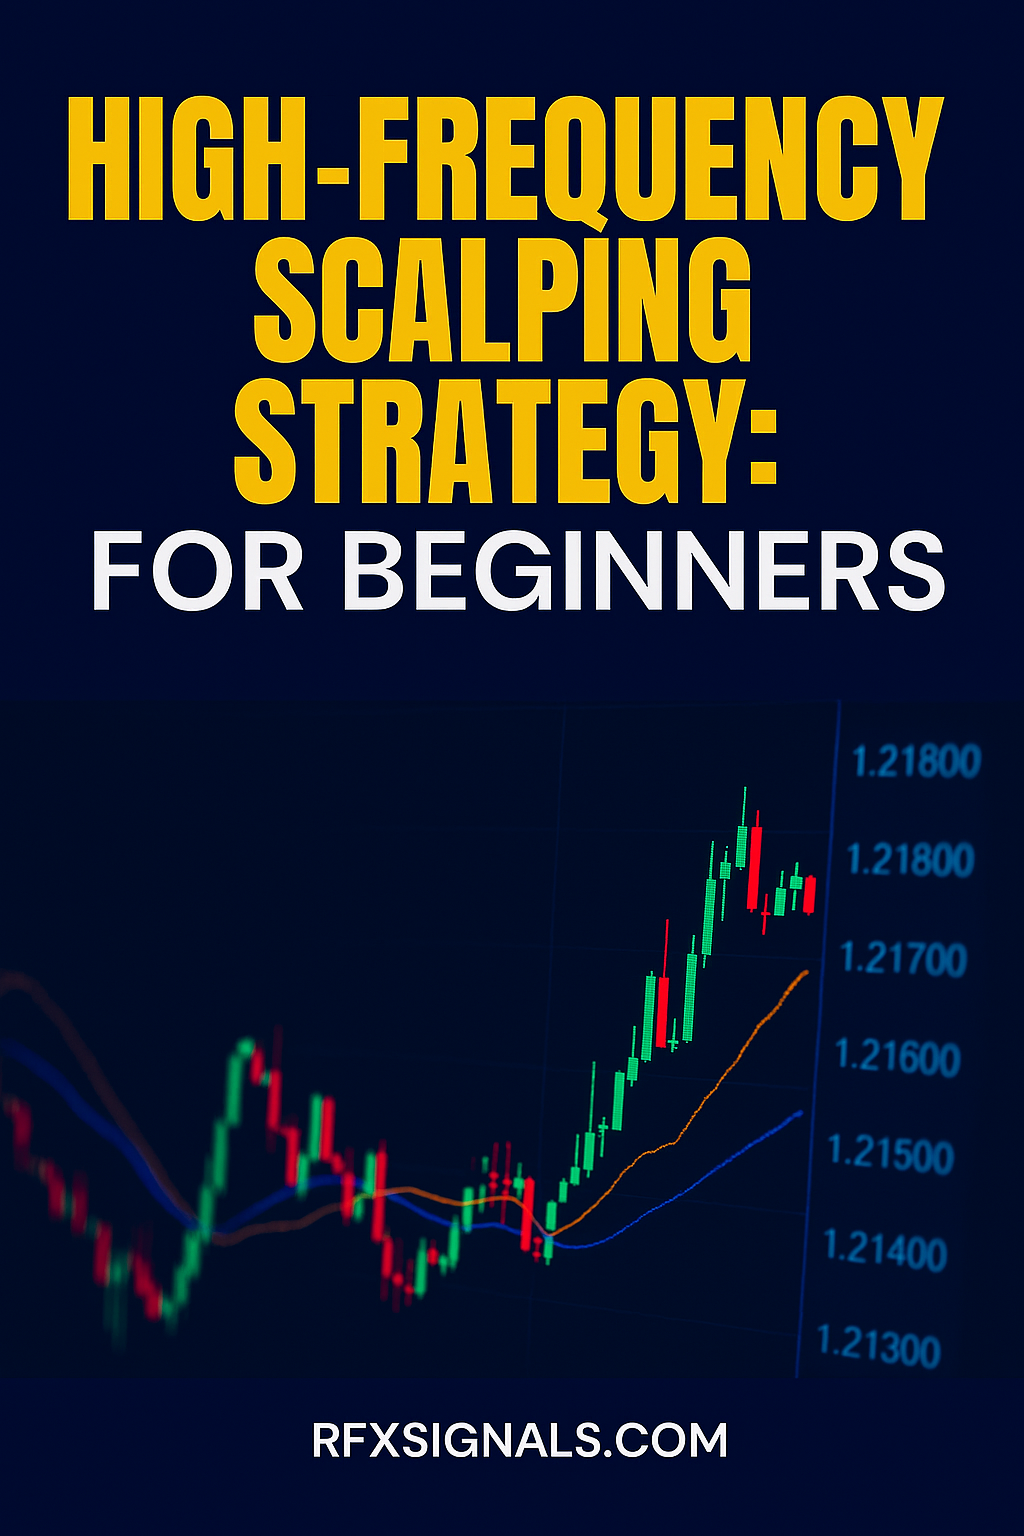
High-Frequency Scalping Strategy for Beginners

High-Frequency Scalping Strategy for Beginners
High-Frequency Scalping Strategy for Beginners | RFXSignals

High-Frequency Scalping Strategy for Beginners

Scalping is one of the fastest-paced approaches in forex trading, designed to capture small but frequent price movements. With high-frequency scalping, traders execute multiple trades within minutes, sometimes seconds. For beginners, this strategy offers quick profits but also carries unique risks. In this comprehensive 2025 guide, we will explore how scalping works, the tools required, advantages and disadvantages, and a step-by-step approach to get started safely.

Want Real-Time Scalping Trade Alerts?

Join the RFXSignals community for high-frequency scalping setups, intraday market insights, and free signals.

What is High-Frequency Scalping?

Scalping is about taking advantage of very short-term market movements. Unlike swing or position traders who hold trades for days or weeks, scalpers may open and close multiple trades within a few minutes. High-frequency scalping pushes this further, executing dozens — sometimes hundreds — of trades daily to accumulate small profits that compound over time.

Why Beginners Are Attracted to Scalping

  • Quick profits without waiting for long-term setups.
  • Constant action, reducing boredom during trading sessions.
  • Opportunities in both trending and ranging markets.
  • Clear, rule-based entries and exits using technical indicators.

Tools Needed for High-Frequency Scalping

Before diving into scalping, beginners must equip themselves with the right tools:

  • Low-spread broker: Small spreads are critical because scalpers target small profits.
  • Fast execution platform: MetaTrader, cTrader, or other platforms with low latency.
  • Indicators: Moving Averages, Bollinger Bands, RSI, and stochastic oscillators.
  • Economic calendar: Scalping during high-impact news events requires extra caution.

Step-by-Step Scalping Strategy

  1. Choose the right pair: Stick to major pairs (EUR/USD, GBP/USD, USD/JPY) with high liquidity and low spreads.
  2. Select timeframe: 1-minute and 5-minute charts are most common for scalping.
  3. Set indicators: Example: 50 EMA for trend direction, 14-period RSI for overbought/oversold conditions.
  4. Identify entry: Trade in the direction of the trend when RSI aligns with breakout or pullback.
  5. Exit quickly: Target 5–10 pips per trade, with a stop-loss of similar size.

Advantages of Scalping

  • Quick realization of profits.
  • High frequency provides multiple opportunities daily.
  • Works in most market conditions.

Disadvantages of Scalping

  • Mentally exhausting — requires high focus.
  • High transaction costs if broker spreads/commissions are large.
  • Not suitable for slow execution platforms.

Risk Management in High-Frequency Scalping

Because of its fast-paced nature, risk management is even more critical in scalping:

  • Risk only 0.5% per trade.
  • Always use stop-loss orders — no exceptions.
  • Do not overtrade; take breaks to avoid mistakes.
Note: A common mistake among beginners is revenge trading after a losing streak. Scalping requires emotional discipline more than any other strategy.

Best Times for Scalping

  • London Session: High liquidity and volatility.
  • New York Session: Overlaps with London for maximum volume.
  • Avoid late Asian session, where spreads widen and movement is slow.

Combining Scalping with Other Strategies

Scalping doesn’t need to stand alone. Many traders combine it with swing trading or position trades. For example, you could scalp during high volatility sessions but hold swing positions in longer-term trends. This diversification improves balance in your trading style.

Link Building & SEO Funnel

Beginner Checklist Before Scalping

  • Is my broker offering low spreads and fast execution?
  • Am I trading in a high-liquidity session?
  • Do I have a clear entry and exit rule?
  • Am I emotionally prepared to handle rapid trades?

Ready to Start Scalping Like a Pro?

Get daily high-frequency scalping setups and insights from RFXSignals. Join our free channels today!

Conclusion

High-frequency scalping is one of the most exciting yet challenging strategies for beginners. Its speed, opportunities, and high engagement make it attractive, but it requires strict discipline and risk management. With practice, patience, and the right mentorship, scalping can become a powerful addition to your forex toolkit in 2025.

Disclaimer: This article is for educational purposes only and does not constitute financial advice. Always test strategies in demo accounts before trading live.

rfxsignals September 25, 2025 No Comments

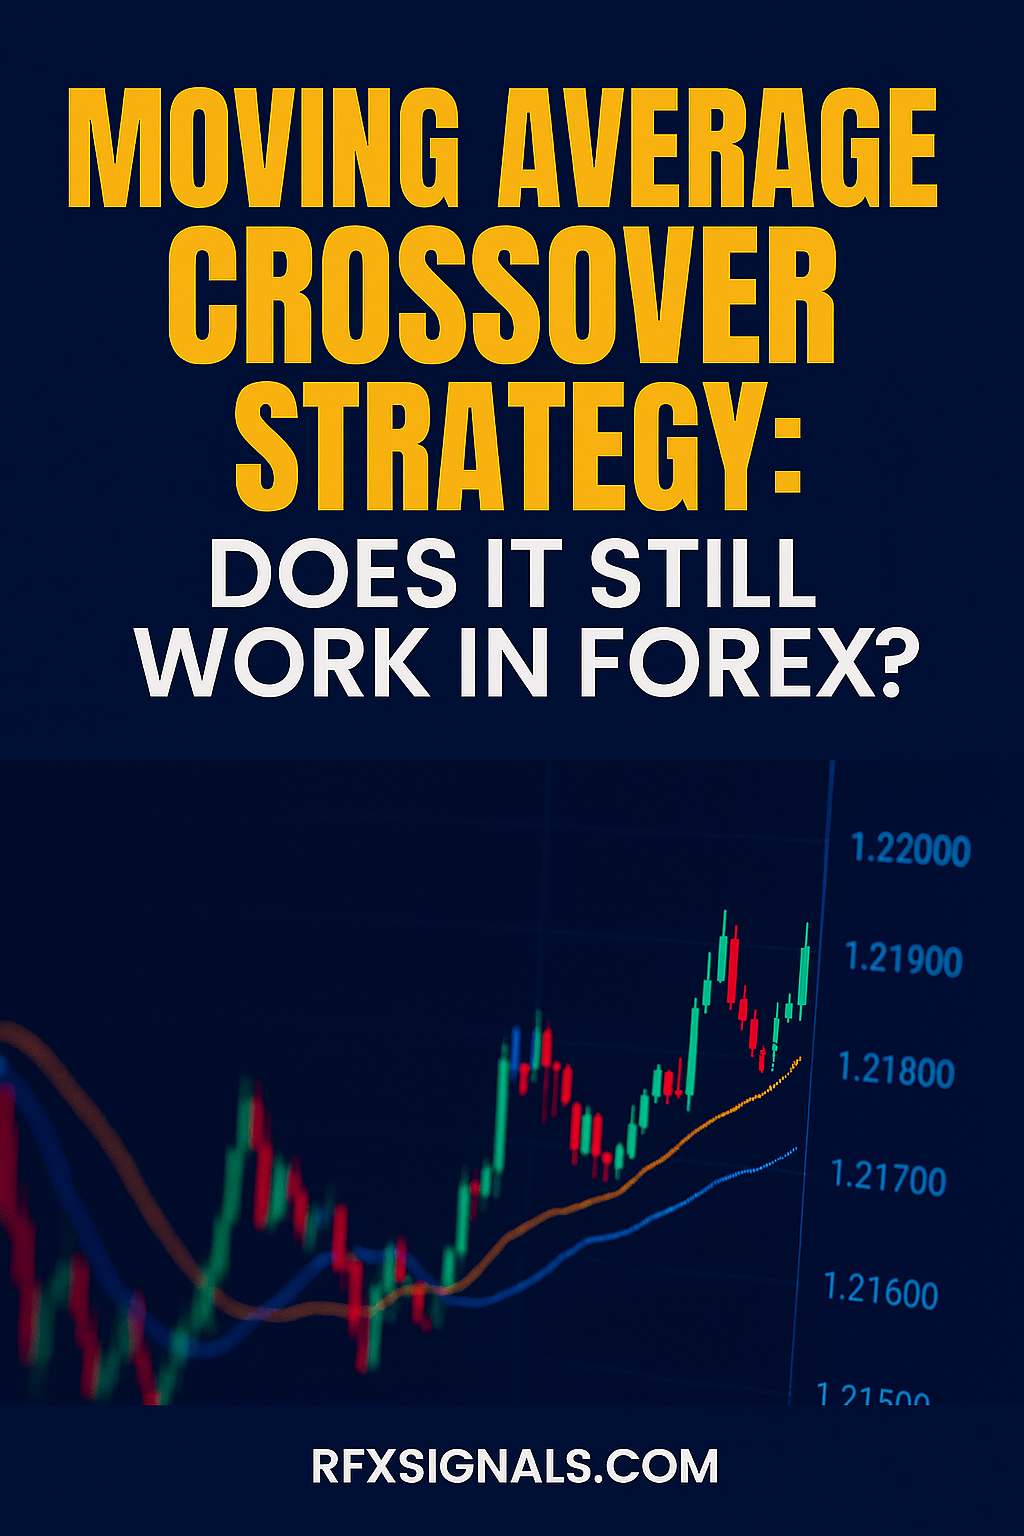
Moving Average Crossover Strategy: Does It Still Work in Forex?

Moving Average Crossover Strategy Does It Still Work in Forex
Moving Average Crossover Strategy: Does It Still Work in Forex? | RFXSignals

Moving Average Crossover Strategy: Does It Still Work in Forex?

Short answer: Yes — but not as a stand-alone "set-and-forget" system. Moving Average (MA) crossovers still form the backbone of many trend-following methods, but in 2025 they must be combined with filters, risk controls, and sensible execution to remain profitable.

Get Tested Forex Strategies & Live Signals

Join RFXSignals channels for real-time signals, MA-based setups, and trade management tips — perfect for traders who want practical implementation help.

What is an MA Crossover Strategy?

At its core, an MA crossover uses two (or more) moving averages of price — typically one “fast” (short period) and one “slow” (long period). A buy signal occurs when the fast MA crosses above the slow MA; a sell signal occurs when it crosses below. Common pairs include EMA(9)/EMA(21), SMA(50)/SMA(200) and EMA(20)/EMA(50).

Why MA Crossovers Worked Historically

MA crossovers are simple trend-following triggers. They worked because markets exhibit persistent trends and moving averages smooth price noise, allowing traders to ride directional moves while staying out of sideways markets. Simplicity also meant easy backtesting and clear rules for entries and exits.

Why a Raw MA Crossover Often Fails Today

  • Whipsaw in ranging markets: frequent false signals when price oscillates between support and resistance.
  • Delay: MAs are lagging indicators — entries often occur after a large part of the move.
  • Execution & costs: spreads, slippage and commissions can eat small MA profits, especially for shorter timeframes.
  • Market microstructure: algorithmic liquidity-taking and news-driven volatility produce spikes that trigger and then reverse crossover signals.

How to Make MA Crossovers Work in 2025 — Practical Upgrades

Don’t discard MA crossovers — upgrade them. Below are modern, practical enhancements that keep the simplicity but reduce the weaknesses.

1. Use Multi-Timeframe Confirmation

Require the MA crossover on a lower timeframe (e.g., H1) to agree with the trend on a higher timeframe (e.g., H4 or Daily). This reduces whipsaw and aligns entries with stronger trends.

2. Add a Trend Filter

Combine a long-term trend filter such as SMA(200) or the ADX. Example rule: only take long crossovers when price is above SMA(200) and ADX > 20. Filters block low-probability trades in choppy markets.

3. Use Price Structure & Support/Resistance

Prefer crossovers that occur near structure — pullbacks to trend support or resistance zones. A crossover that happens in the middle of a range is less reliable than one near confluence.

4. Improve Entries with Confirmation

Instead of market entering immediately on crossover, wait for a price candle close beyond the crossover or a micro pullback (retest) to improve risk-to-reward. Use lower timeframe rejection candles to fine-tune entry.

5. Smarter Stop and Target Placement

Use ATR(14) for dynamic stops or place stops beyond recent swing lows/highs. Avoid fixed pip stops that don't account for pair volatility. Targets can be fixed multiples (2–3R) or use trailing stops to capture extended trends.

Example Robust MA Crossover System (H1/H4)

  1. Trend filter: Daily SMA(200) — only trade in direction of Daily trend.
  2. Signal: EMA(20) crosses EMA(50) on H1.
  3. Confirmation: H4 EMA(20) > EMA(50) for longs (or vice versa for shorts).
  4. Entry: Wait for H1 candle close above crossover and a retest to EMA(20) or minor support.
  5. Stop: 1.5 × ATR(14) below entry or below last swing low.
  6. Take profit: initial target 1.5× risk, trail stop to capture larger move or scale out 40%/60% at partial targets.

Position Sizing & Risk Management

Good risk management turns an edge into a long-term profit stream. Use these rules:

  • Risk no more than 0.5%–1% of account per trade (lower for frequent strategies).
  • Cap aggregate portfolio risk: don’t allow more than 3–5% at risk across open positions.
  • Avoid running uncompensated high leverage; use leverage as a tool, not as a crutch.
  • Keep a trading journal tagging each trade as “MA crossover” with filter details — helps refine the setup over time.

Performance Expectations & Metrics

MA crossover systems are trend-followers — expect:

  • Low win rate but positive expectancy if winners are allowed to run.
  • Long periods of small losing trades interrupted by infrequent large winners (fat tails).
  • Key metrics to track: expectancy, profit factor, max drawdown, average trade length and percent of equity at risk.
Real-world tip: MA crossovers work best on pairs that trend well (EUR/USD, GBP/USD, AUD/USD) and on timeframes H1 and above where noise is lower and transaction costs are less impactful.

Common Pitfalls and How to Avoid Them

  • Chasing late entries: don’t enter impulsively after a big crossover candle — use a small retest or confirmation candle.
  • Ignoring spread & slippage: ensure expected reward covers transaction costs, especially for shorter-term MAs.
  • No rules for news: MA systems can be broken by high-impact data; apply news filters or reduce position size around scheduled events.
  • Over-optimization: avoid curve-fitting MA periods to historical data; prefer robust parameter ranges and walk-forward testing.

How to Combine MA Crossovers With Other Techniques

MA crossovers are a great timing tool — combine with:

  • SMC / Market Structure: use crossovers for entries when structure flips or OBs are retested.
  • Volume/Order Flow: confirm that crossovers align with increased participation.
  • Momentum Oscillators: confirm direction with RSI or Stochastic to filter low momentum crossovers.

Link Building & Funneling Traders to RFXSignals

Quick Implementation Checklist

  • Choose MA pair (e.g., EMA(20)/EMA(50) on H1 + SMA(200) Daily filter).
  • Backtest at least 2–5 years with commission & spread simulated.
  • Forward-test on demo for 6–8 weeks, logging each trade.
  • Define stops, targets, and portfolio risk caps.
  • Publish results to your community and iterate based on data.

Want MA Crossover Examples & Live Alerts?

We share MA-based setups, chart annotations and trade management tips inside our channels. Join to see live examples and downloadable spreadsheets that show entry/exit logic.

Conclusion & Disclaimer

Moving Average crossover strategies remain a valid foundation for trend-following forex systems in 2025 — but only when upgraded with filters, multi-timeframe confirmation, robust risk management, and modern execution practices. Treat MA crossovers as a decision-making component, not an all-in-one system. Backtest, forward-test, and keep a disciplined journal to refine your edge.

Disclosure: This article is educational and not financial advice. Forex trading involves significant risk. Test systems on demo accounts and trade only with capital you can afford to lose.