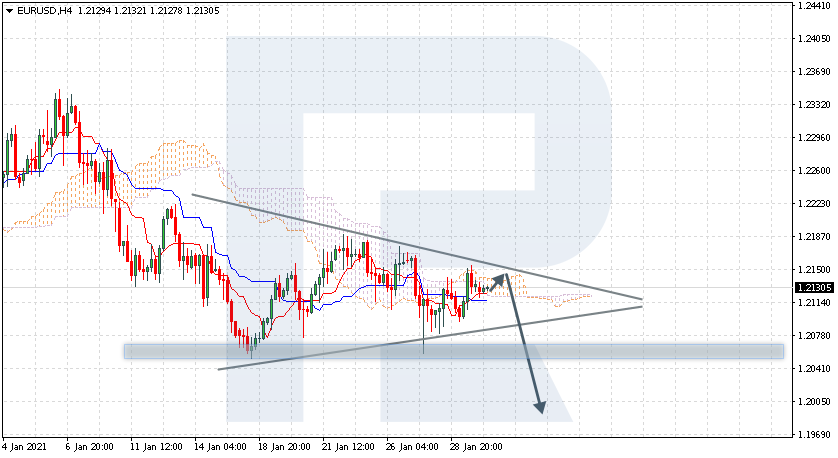
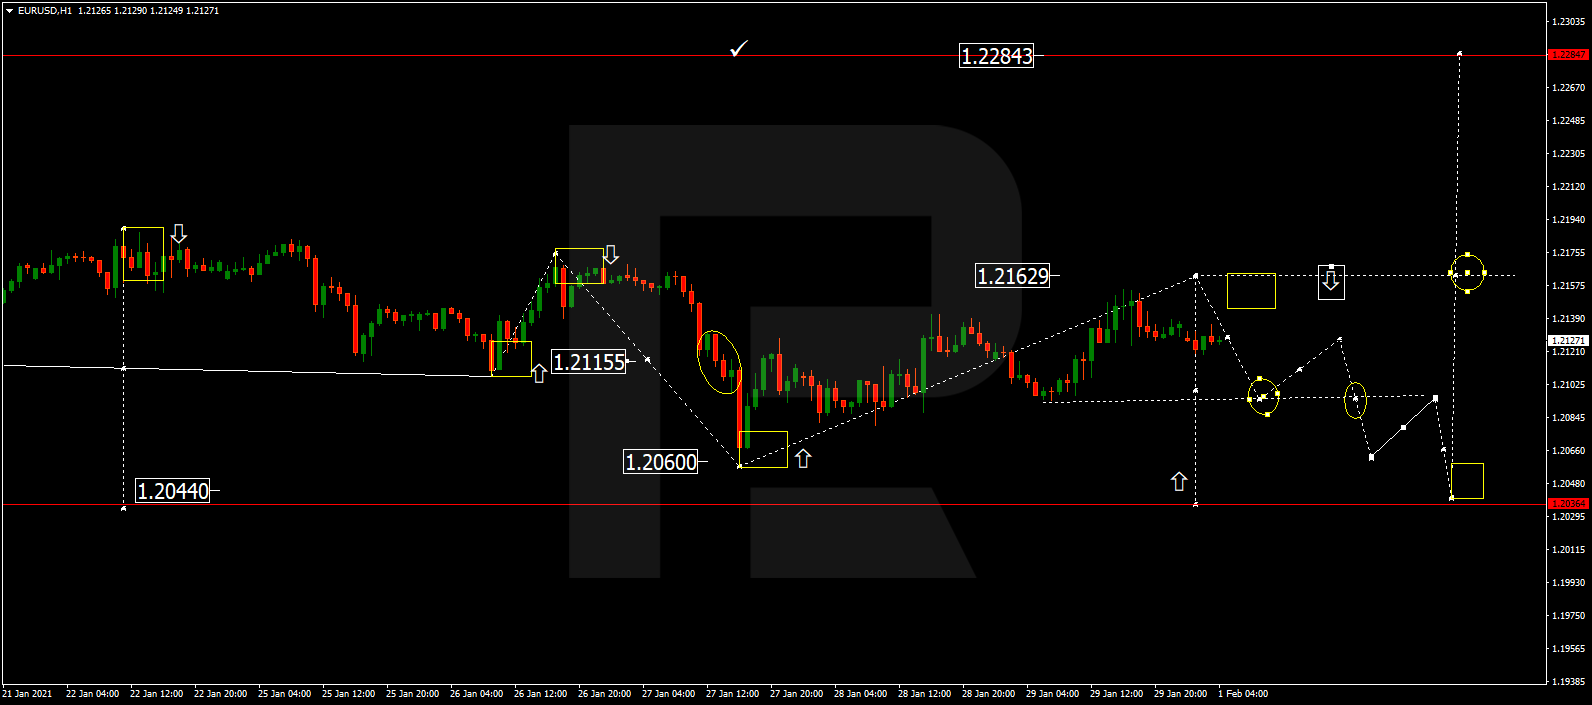
EURUSD, “Euro vs US Dollar”
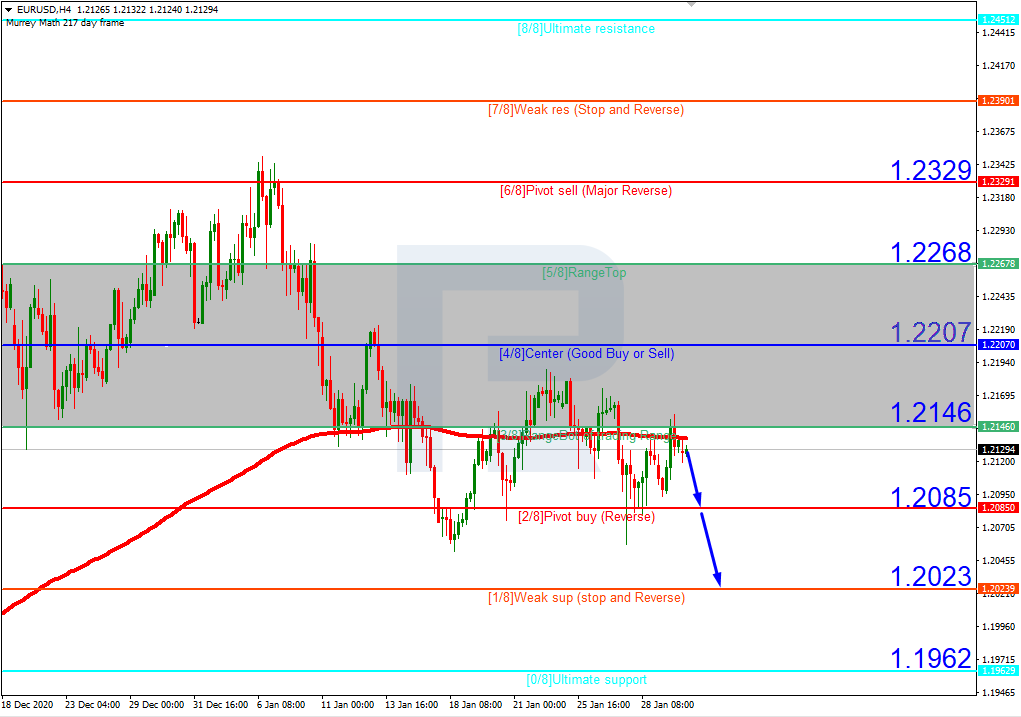
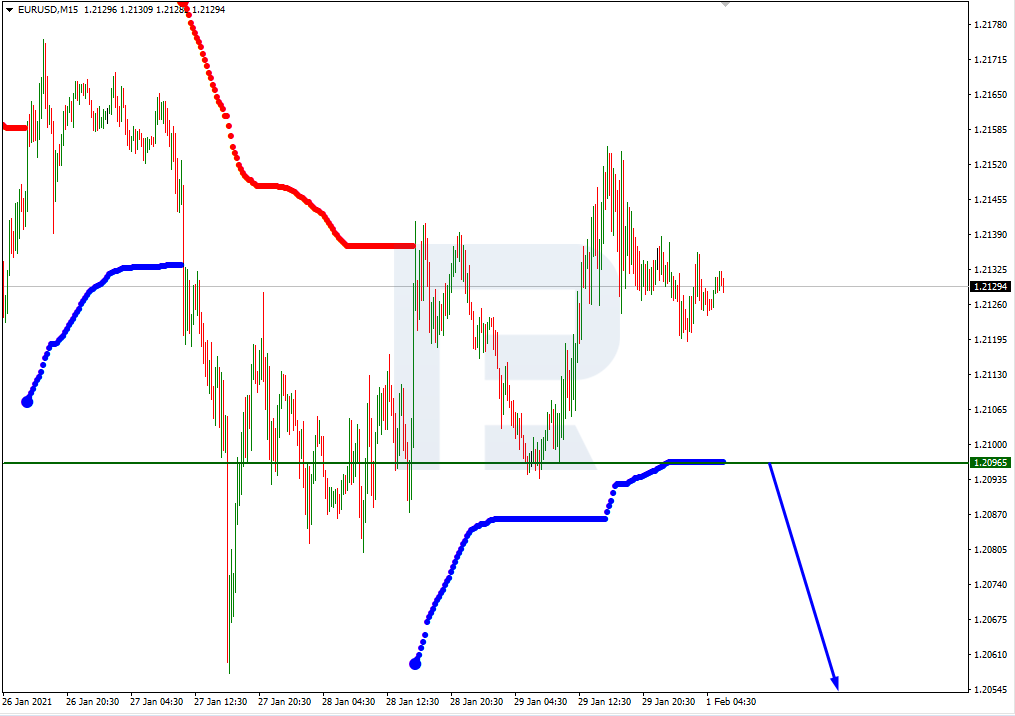
EURUSD is still consolidating around 1.2155. Possibly, today the pair may expand the range up to 1.2162 and then fall with the target at 1.2044. Later, the market may start a new growth to break 1.2160 and then continue trading upwards to reach 1.2284.

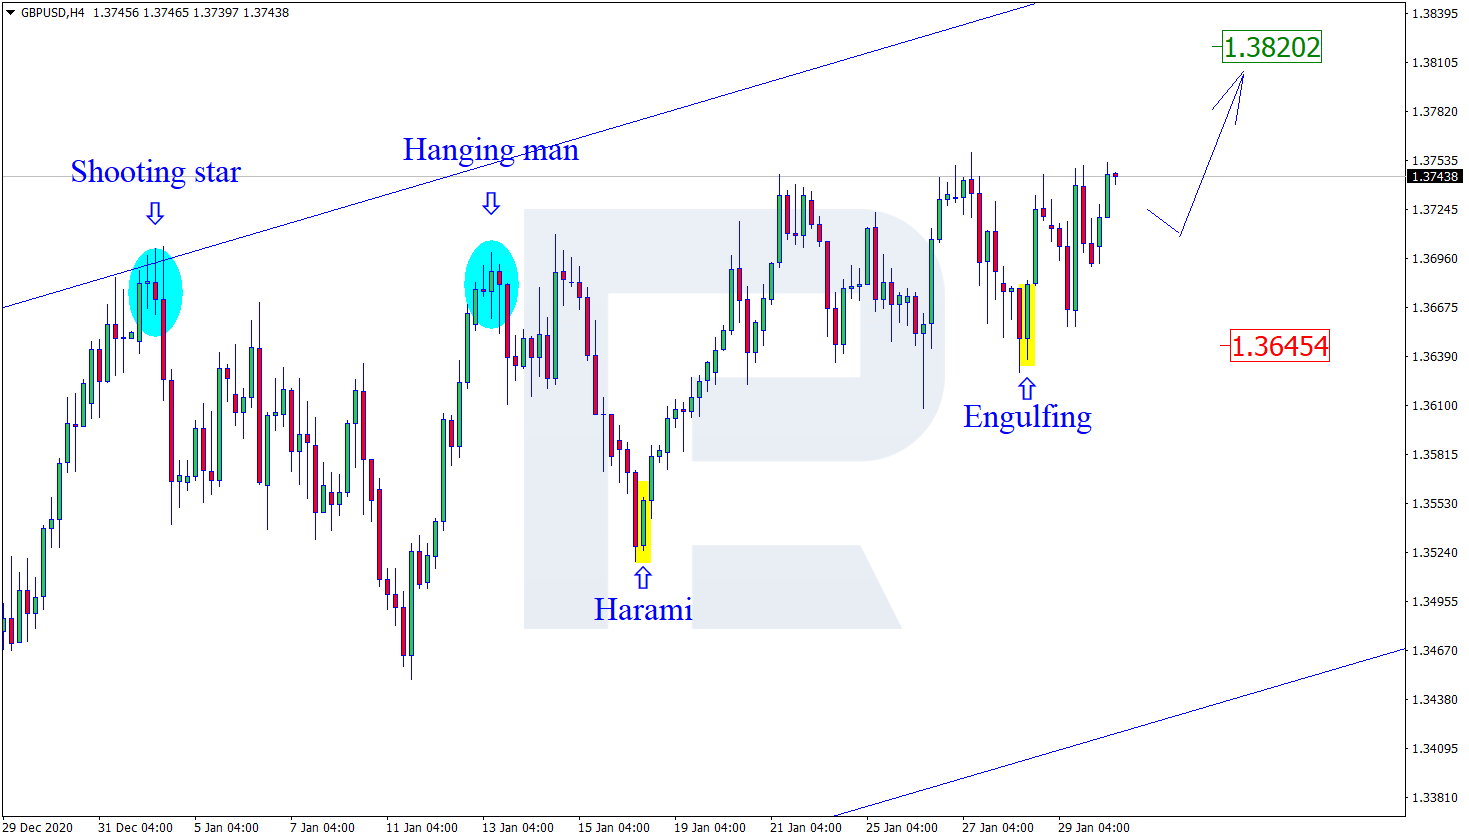
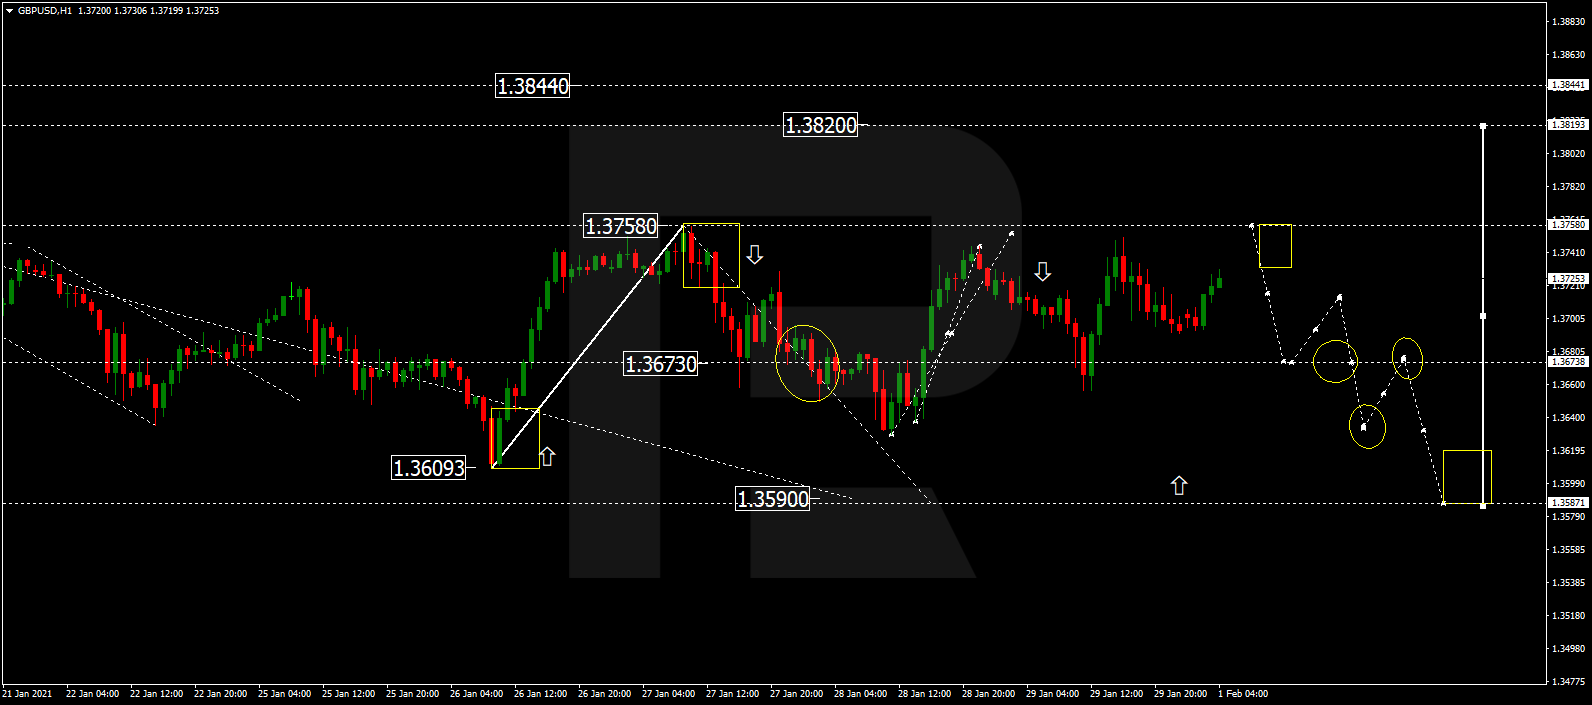
GBPUSD, “Great Britain Pound vs US Dollar”
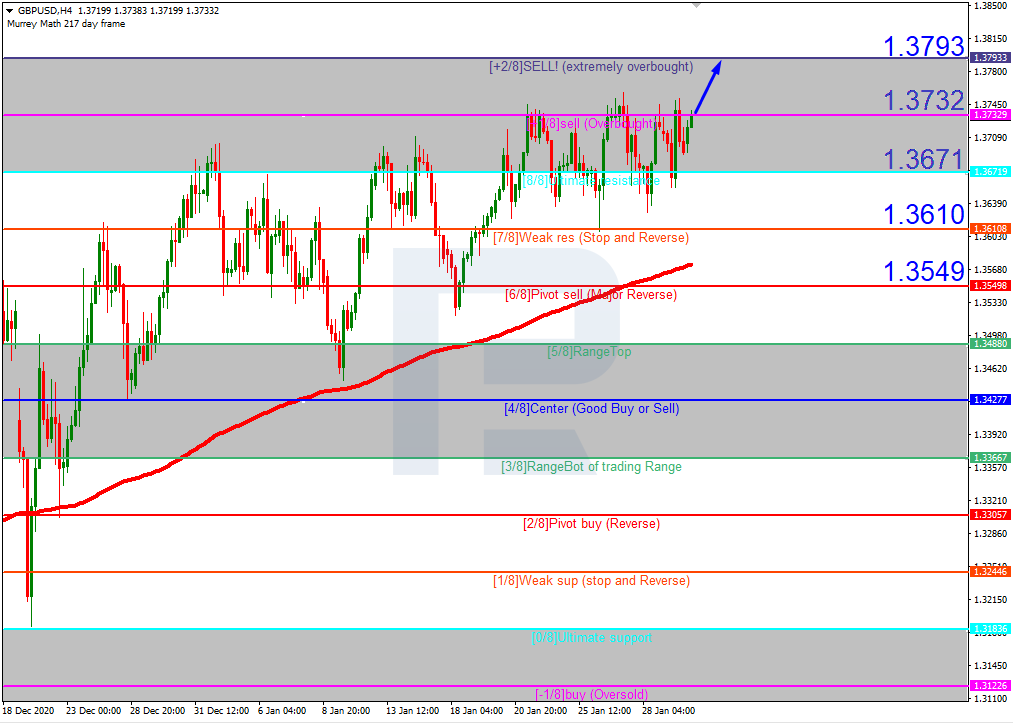
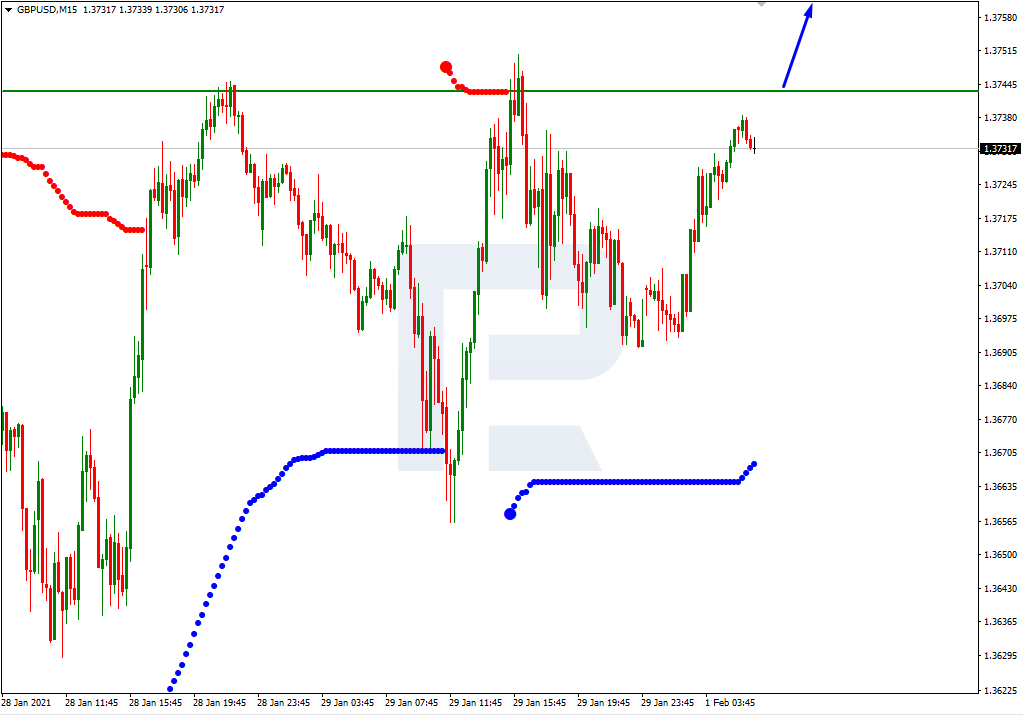
GBPUSD is forming the ascending wave towards 1.3750. Today, the pair may reach this level and then consolidate below it. If later the price breaks this range to the upside, the market may form one more ascending structure to reach 1.3820; if to the downside – resume trading downwards with the target at 1.3587.
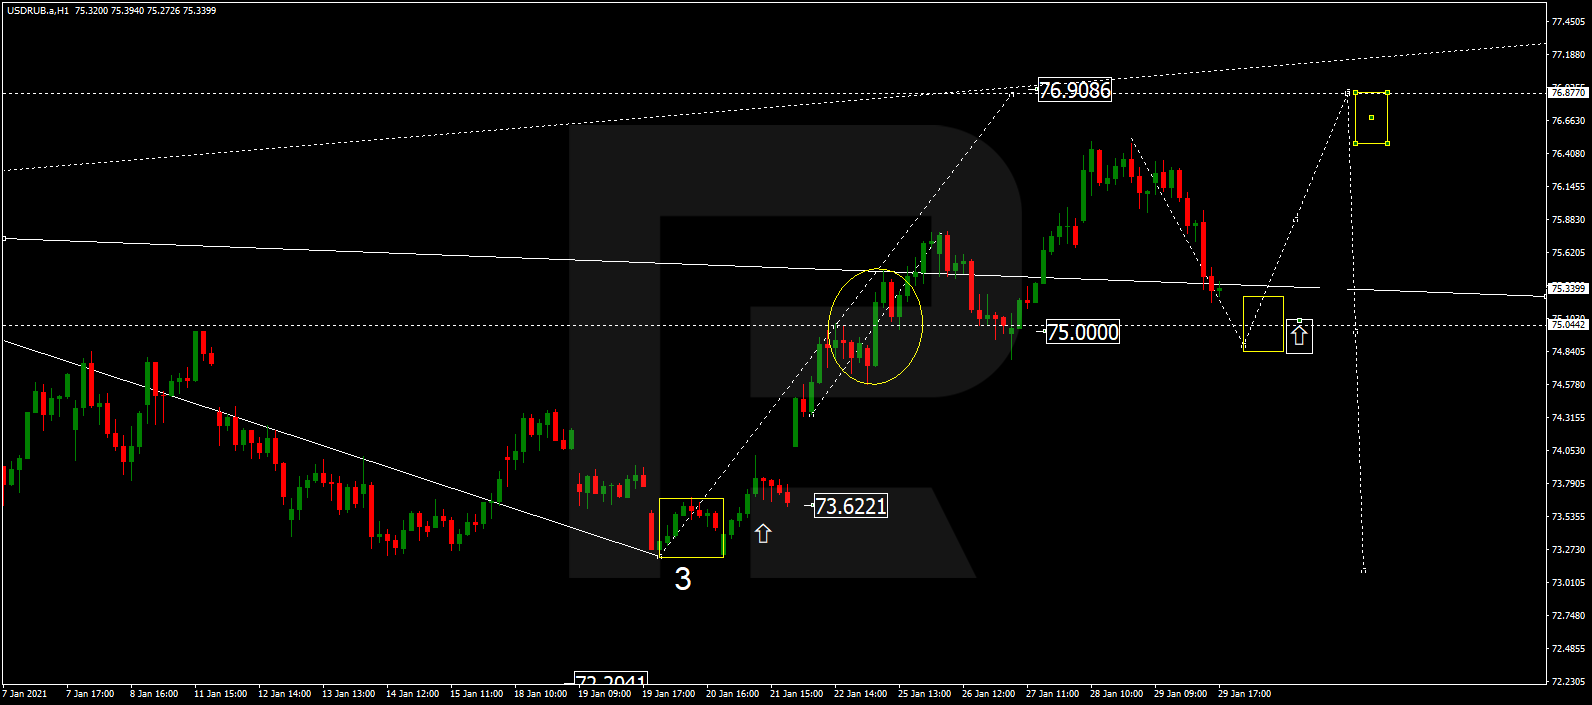
USDRUB, “US Dollar vs Russian Ruble”
After reaching the short-term upside target at 76.40 and then completing the correction at 75.00, USDRUB is expected to return to 75.90 and then consolidate around the latter level. If later the price breaks this range to the upside, the market may form one more ascending structure to reach 76.90; if to the downside – start a new decline to break 75.00 and then continue trading downwards with the target at 73.00.
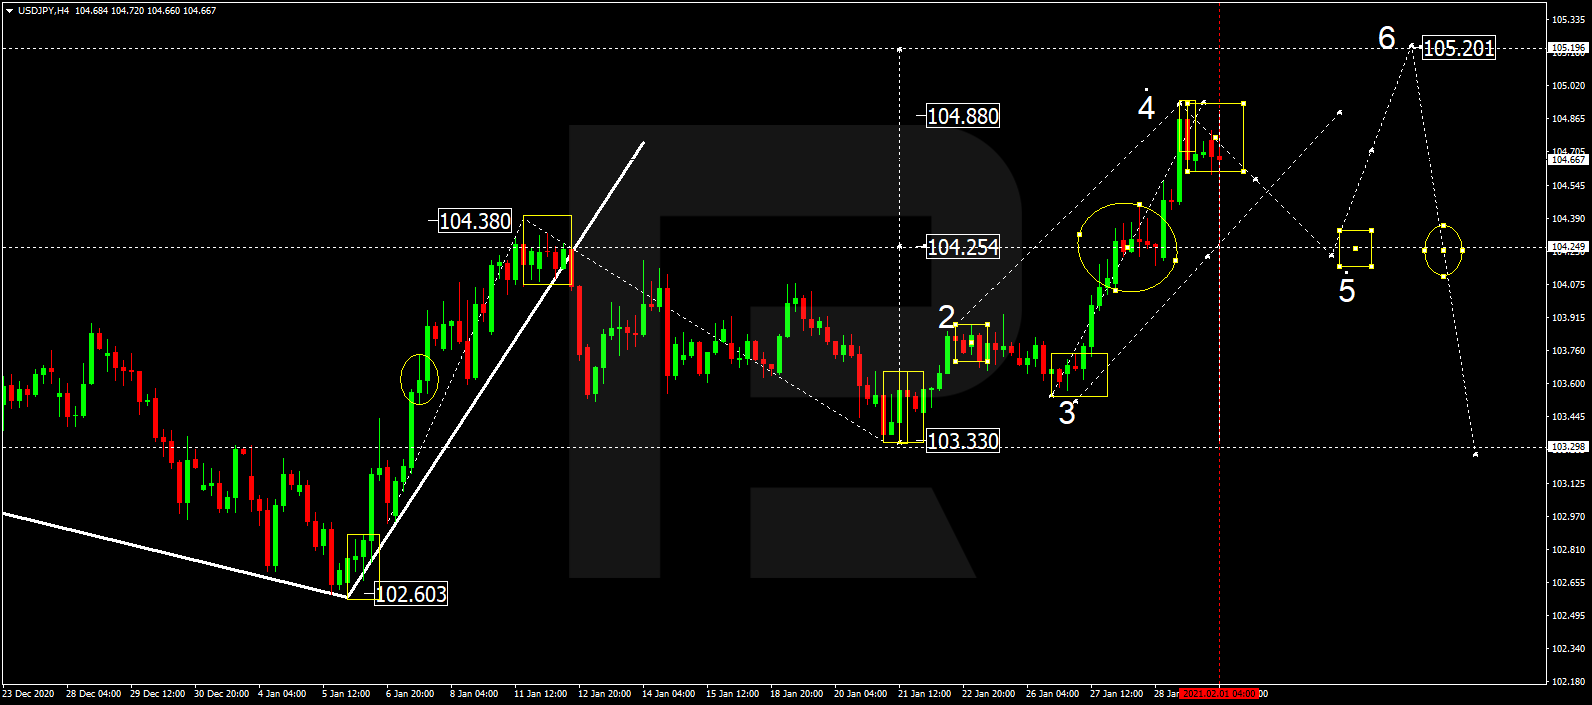
USDJPY, “US Dollar vs Japanese Yen”
USDJPY has reached the short-term upside target at 104.88; right now, it is consolidating below this level. Possibly, the pair may break the range to the downside to reach 104.25 and then start another growth towards 105.20. After that, the instrument may form a new descending structure with the target at 103.33.
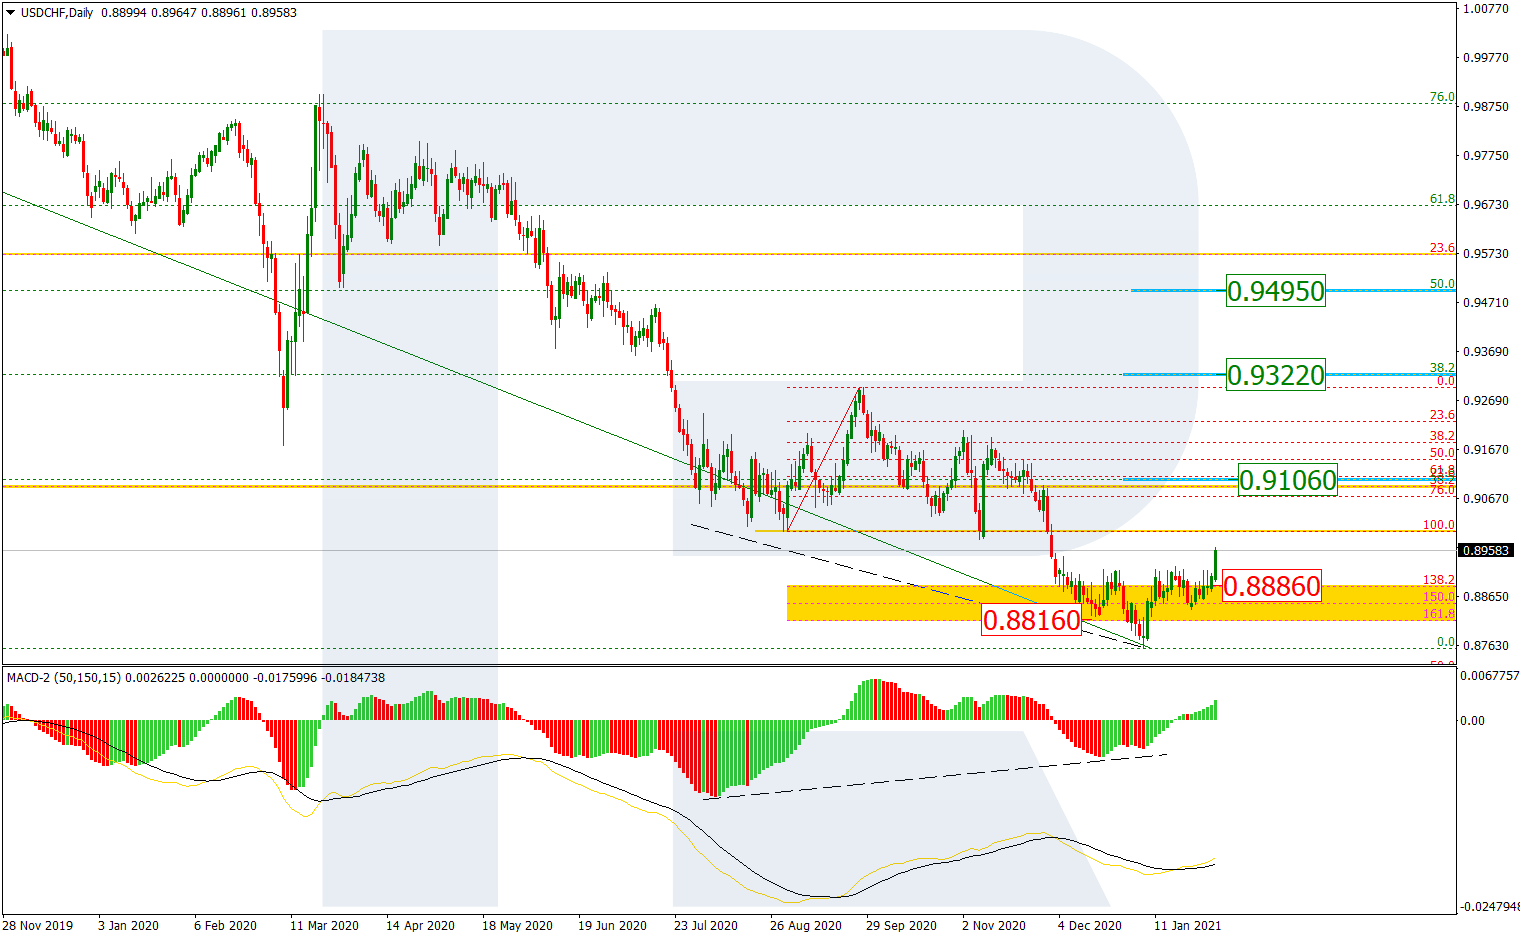
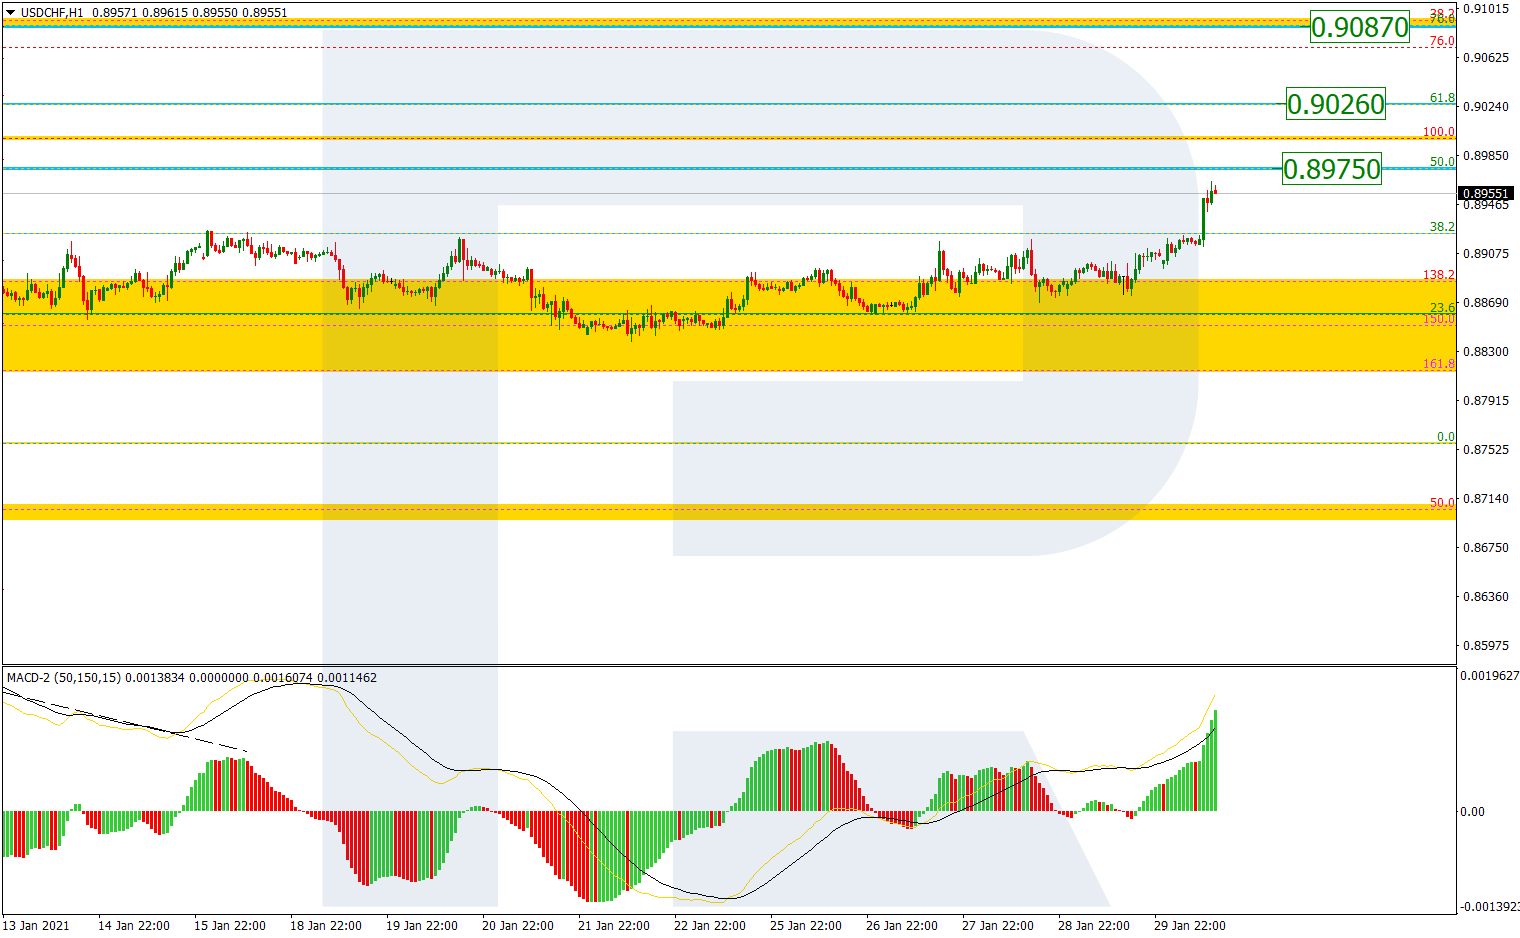
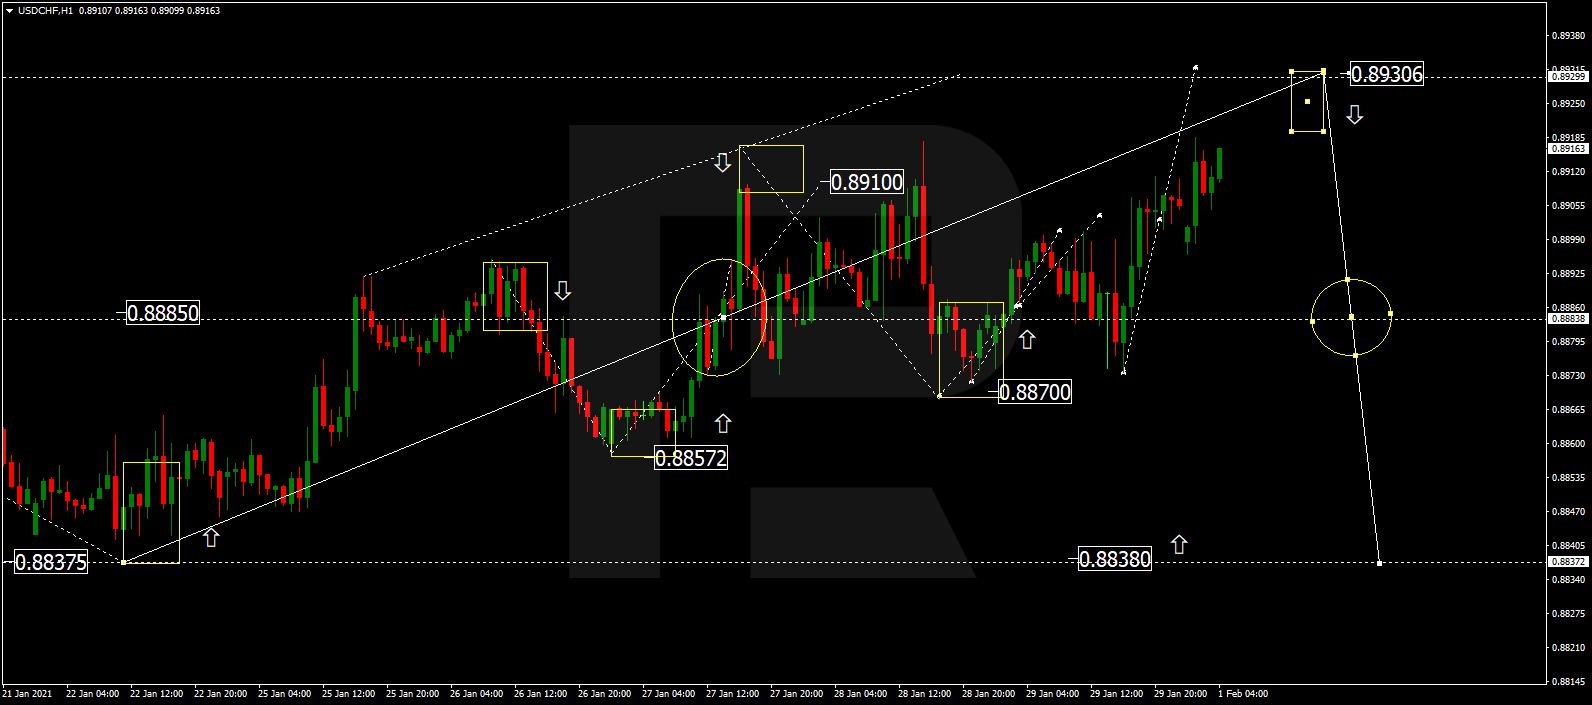
USDCHF, “US Dollar vs Swiss Franc”
After completing the ascending wave at 0.8900, USDCHF has formed a new consolidation range around this level. If later the price breaks this range to the upside, the market may form one more ascending structure to reach 0.8930; if to the downside – start a new decline to break 0.8880 and then continue trading downwards with the target at 0.8830.
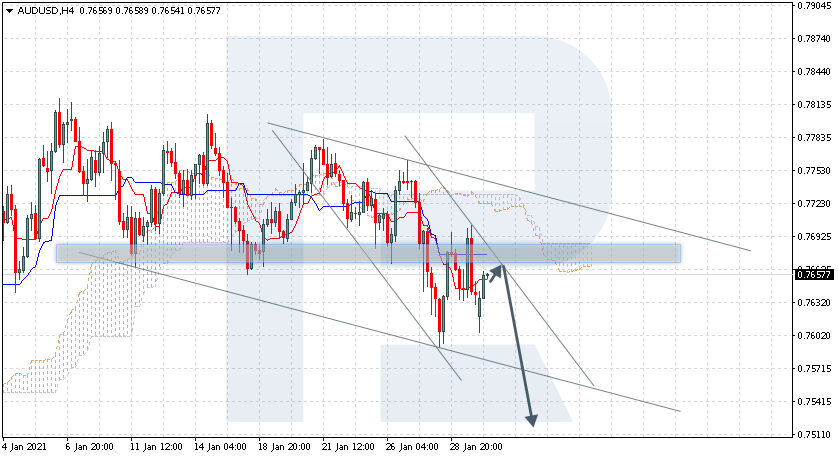
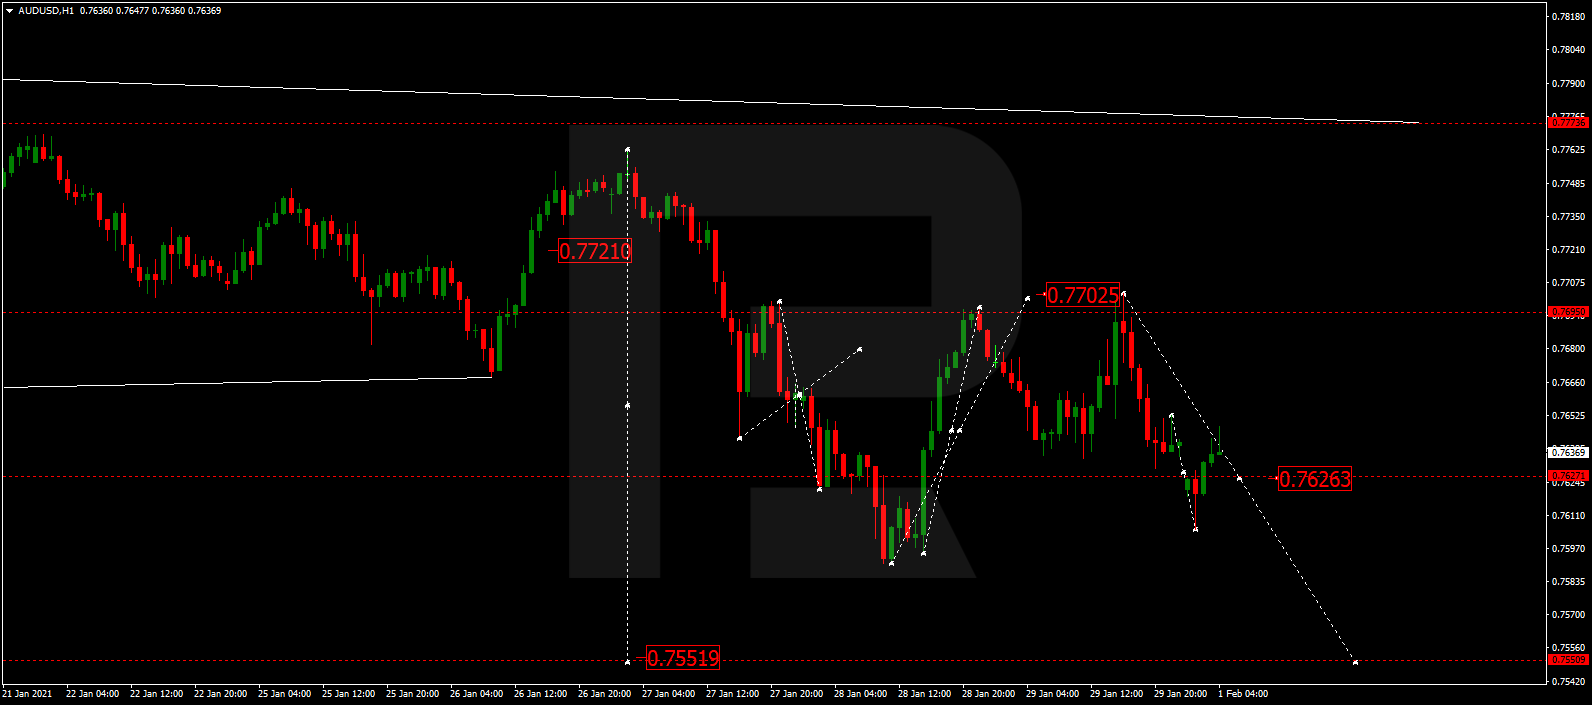
AUDUSD, “Australian Dollar vs US Dollar”
AUDUSD is still consolidating around 0.7650. Today, the pair may resume trading downwards to reach 0.7550 and then start another growth with the target at 0.7700.
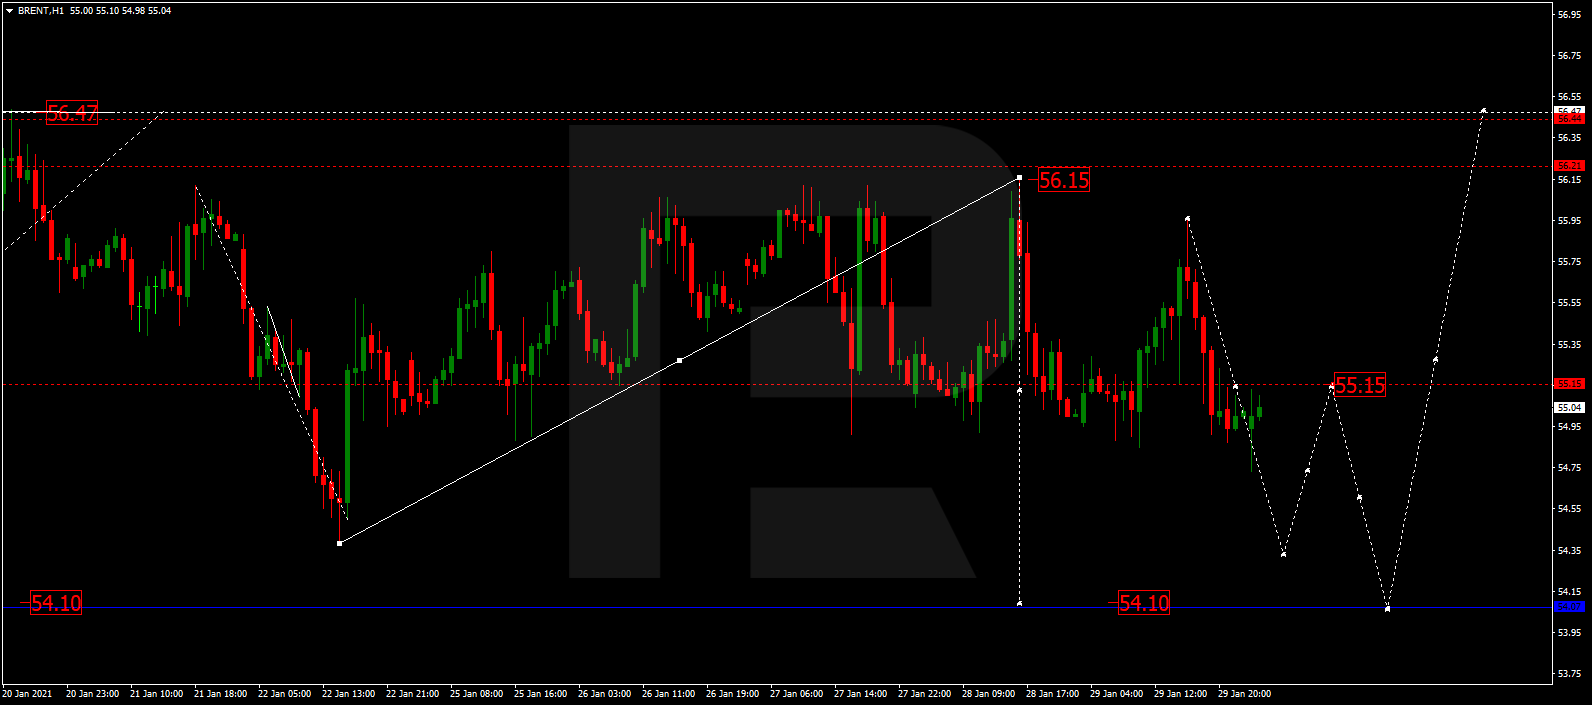
BRENT
Brent is still consolidating around 55.15 without any particular direction. Possibly, the asset may fall to complete the correction at 54.10 and then form one more ascending structure with the target at 56.50.
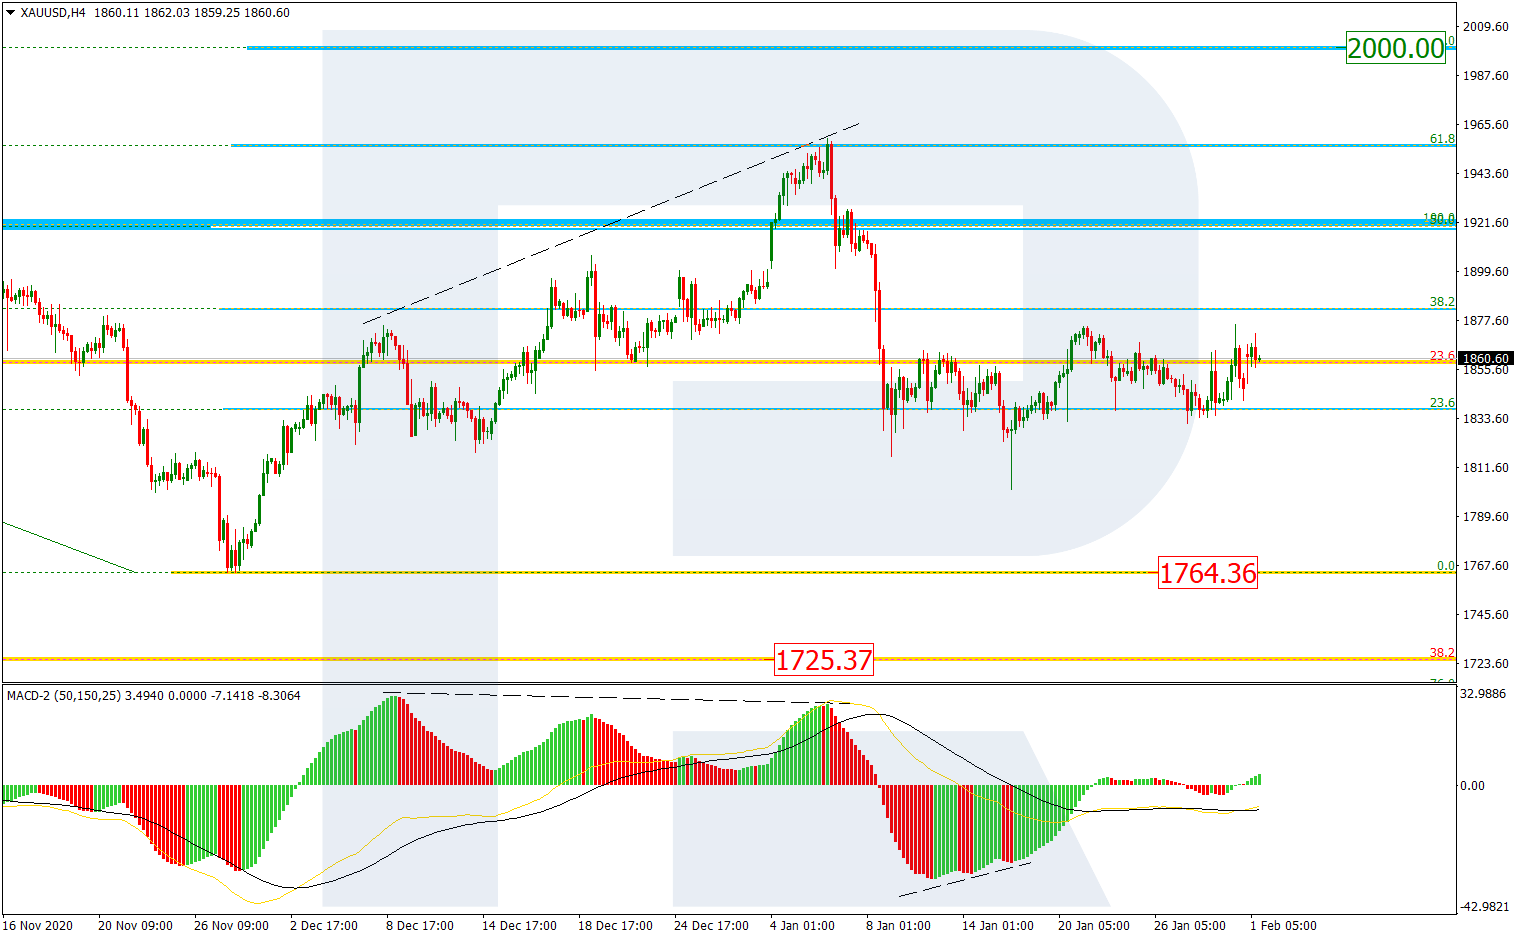
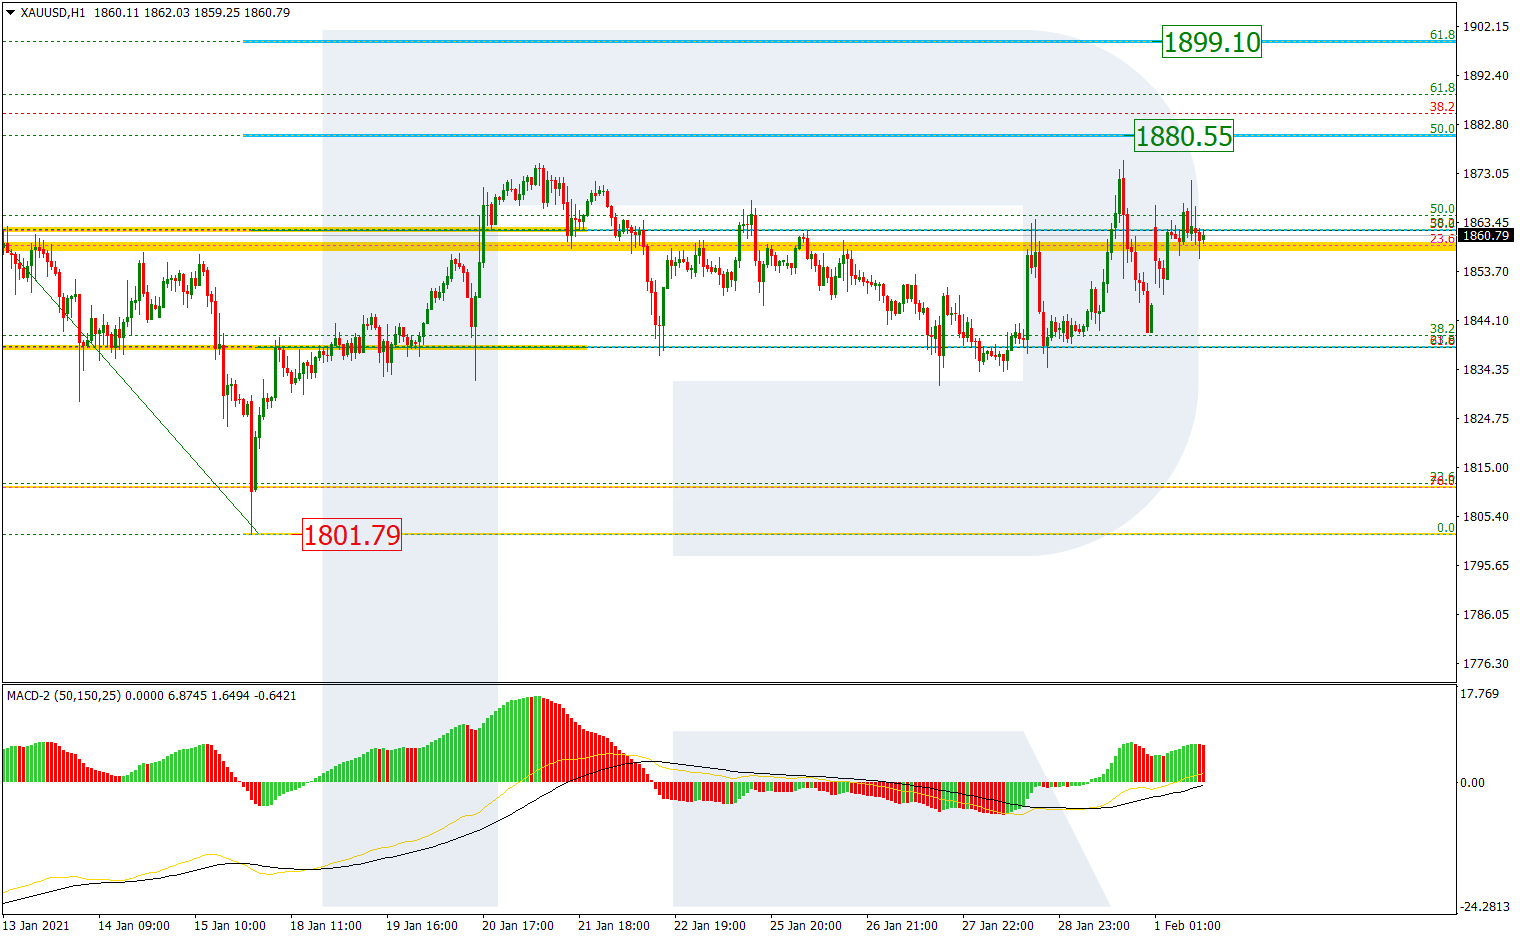
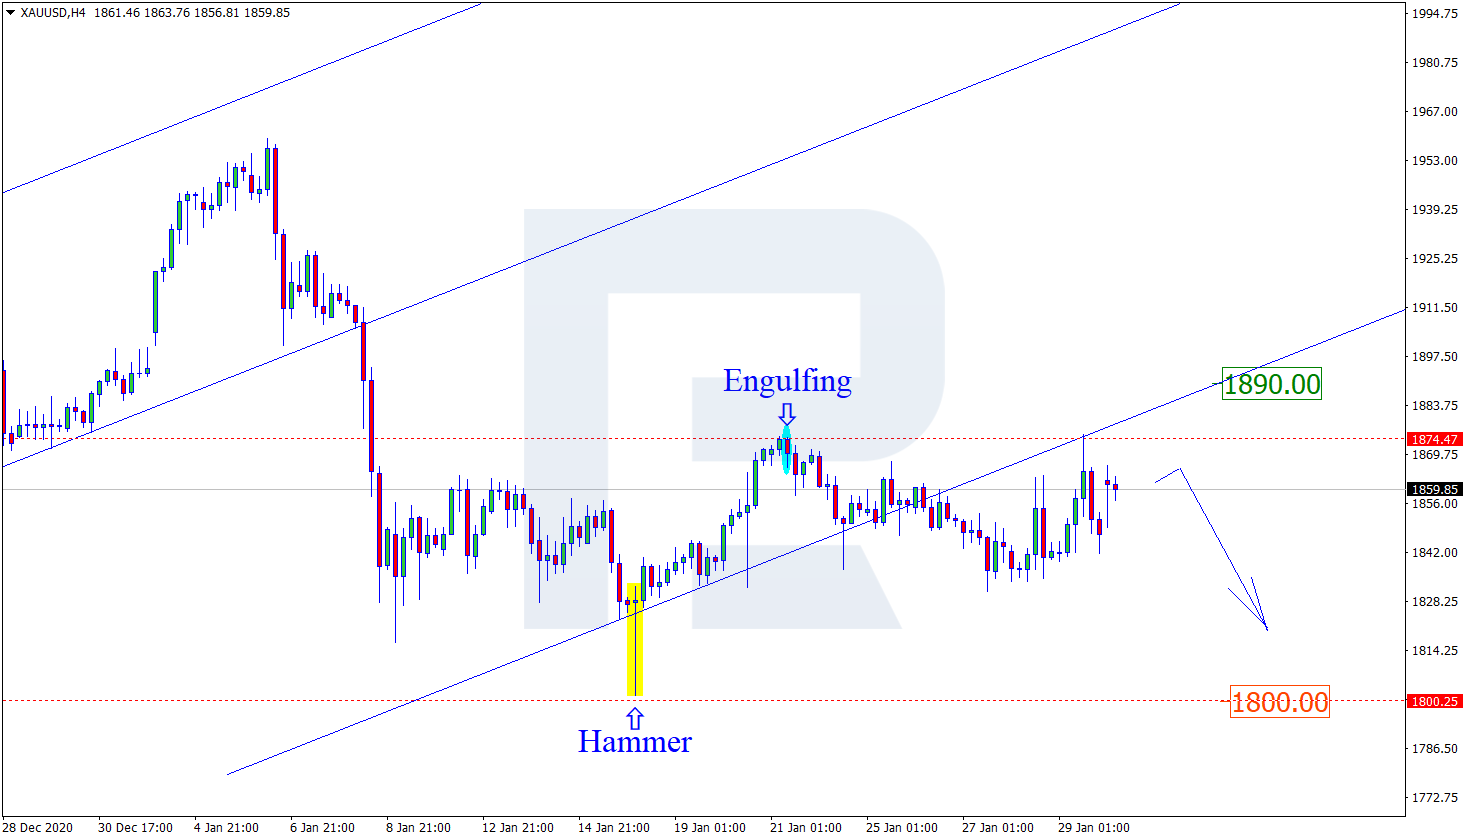
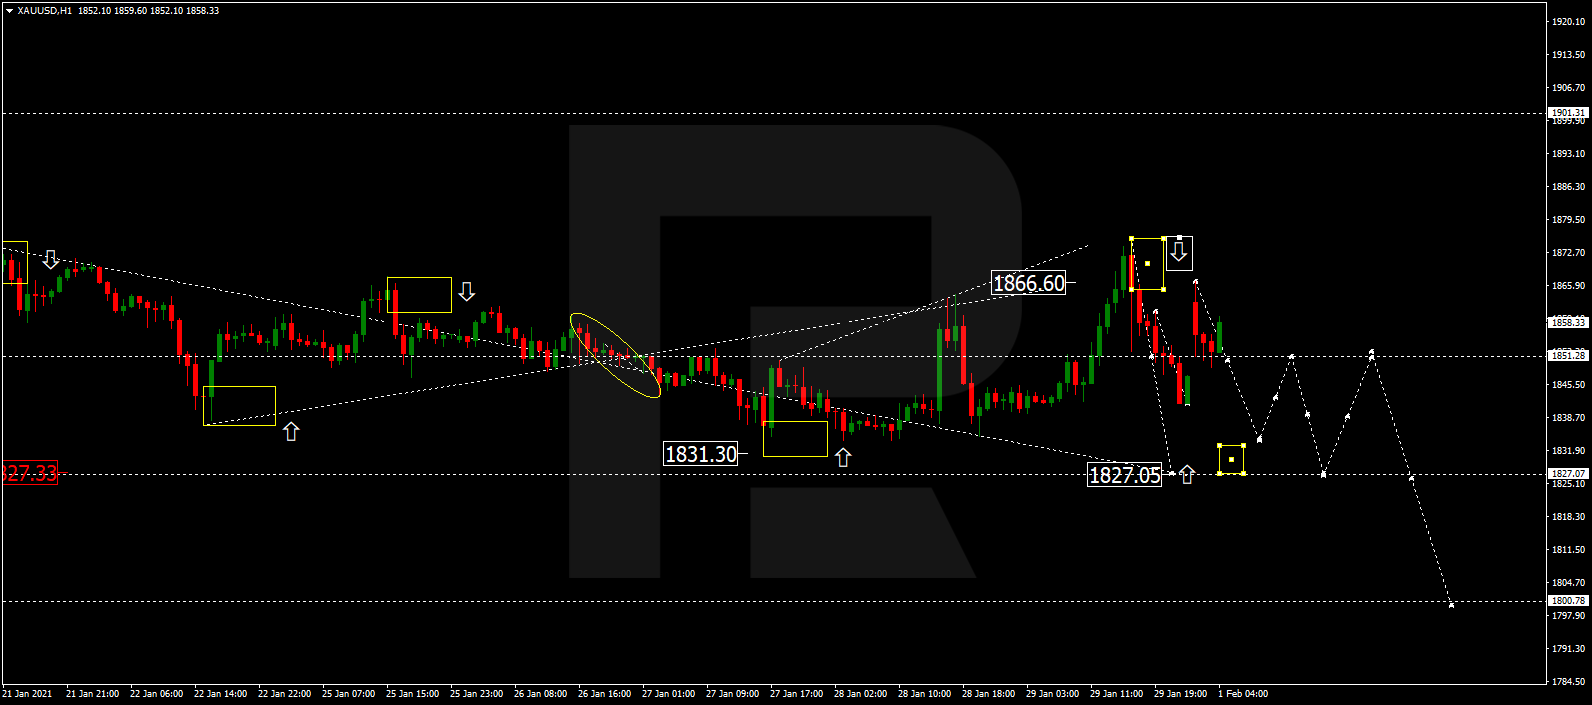
XAUUSD, “Gold vs US Dollar”
Gold is still consolidating around 1851.30. Possibly, the metal may break the range to the downside and resume trading downwards with the target at 1827.00. Later, the market may form one more ascending structure to reach 1851.40.
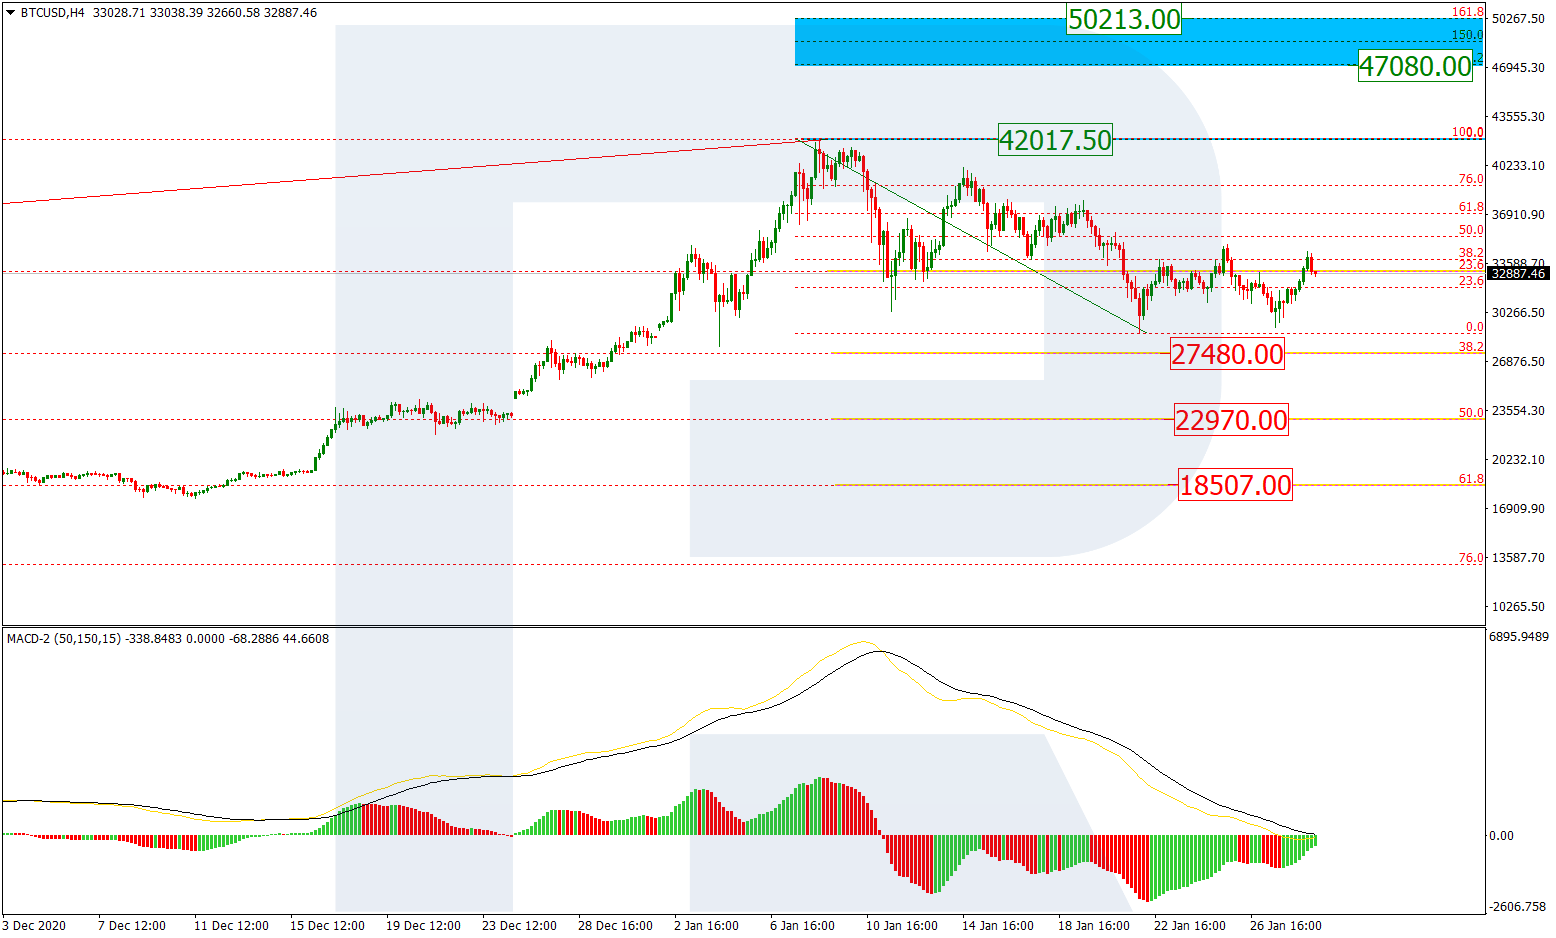
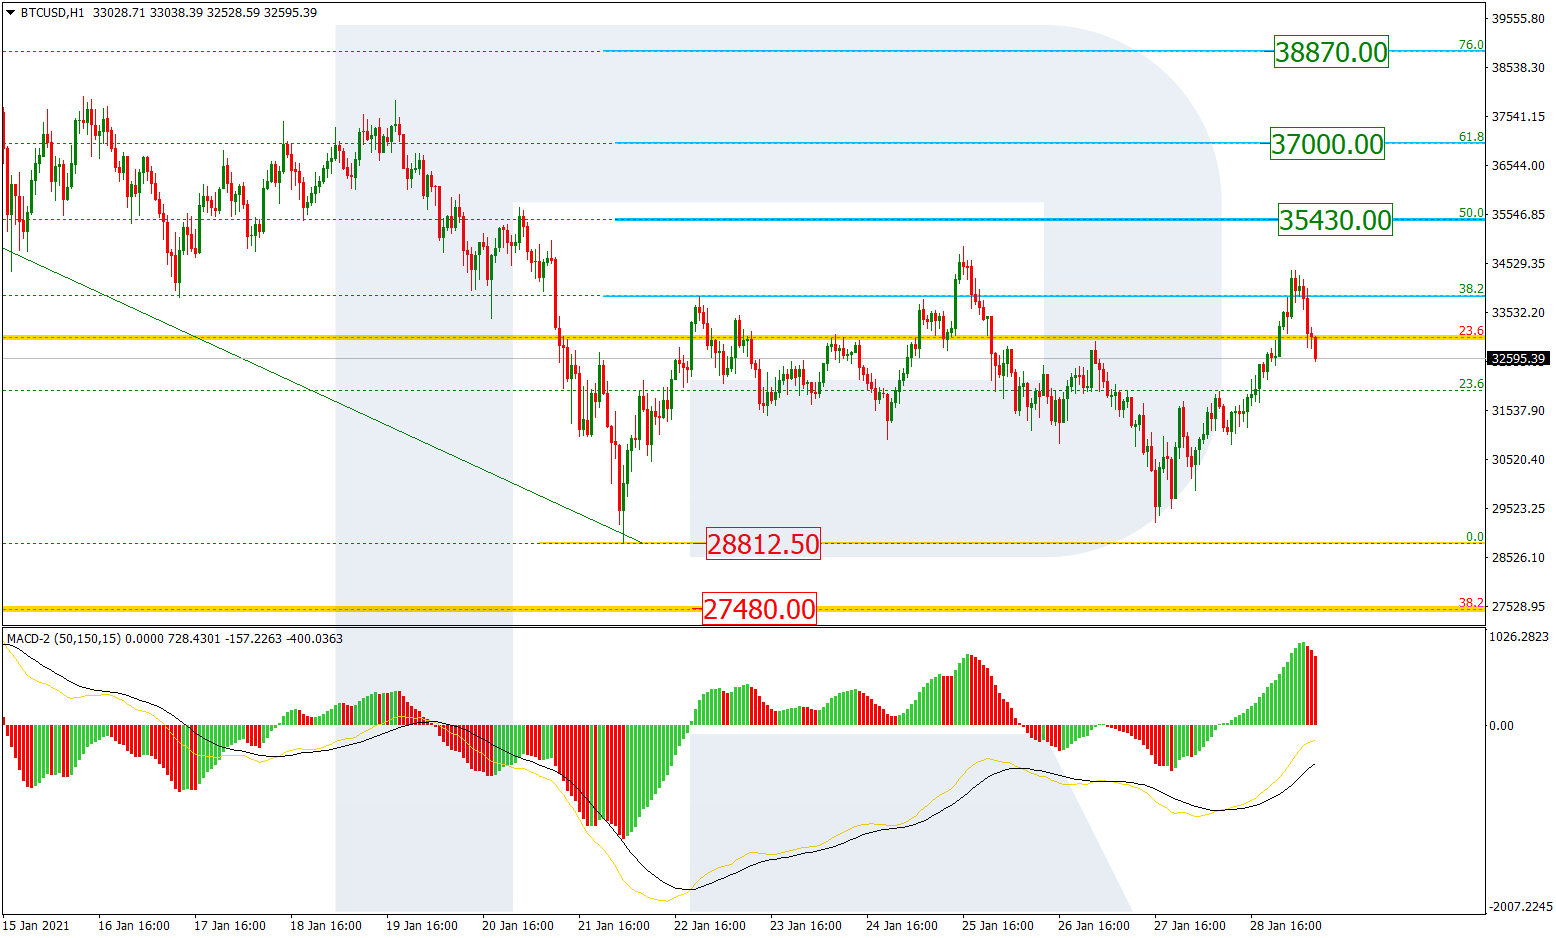
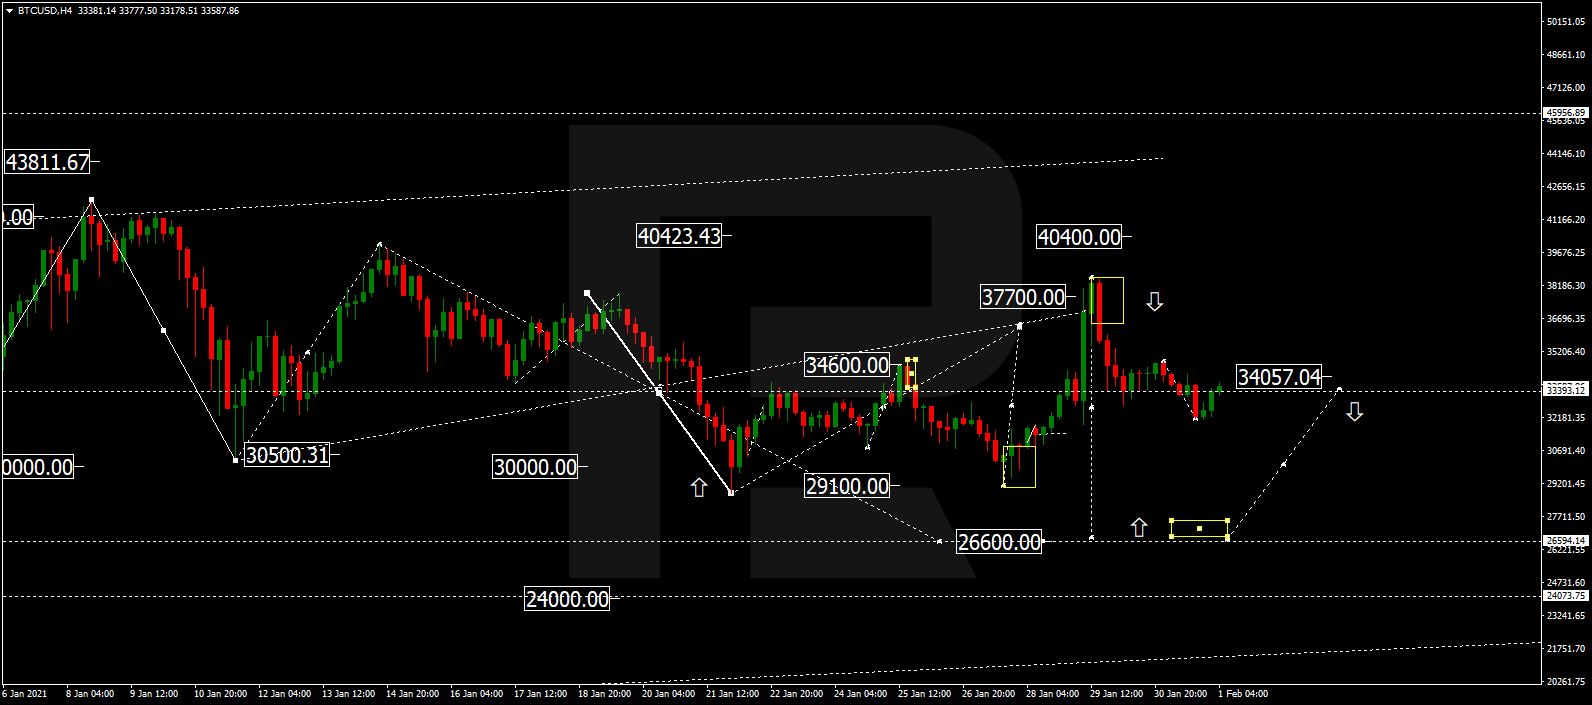
BTCUSD, “Bitcoin vs US Dollar”
BTCUSD is consolidating around 34000.00, Later, the market may break this range to the downside to reach 26600.00 and then resume growing with the target at 40400.00.
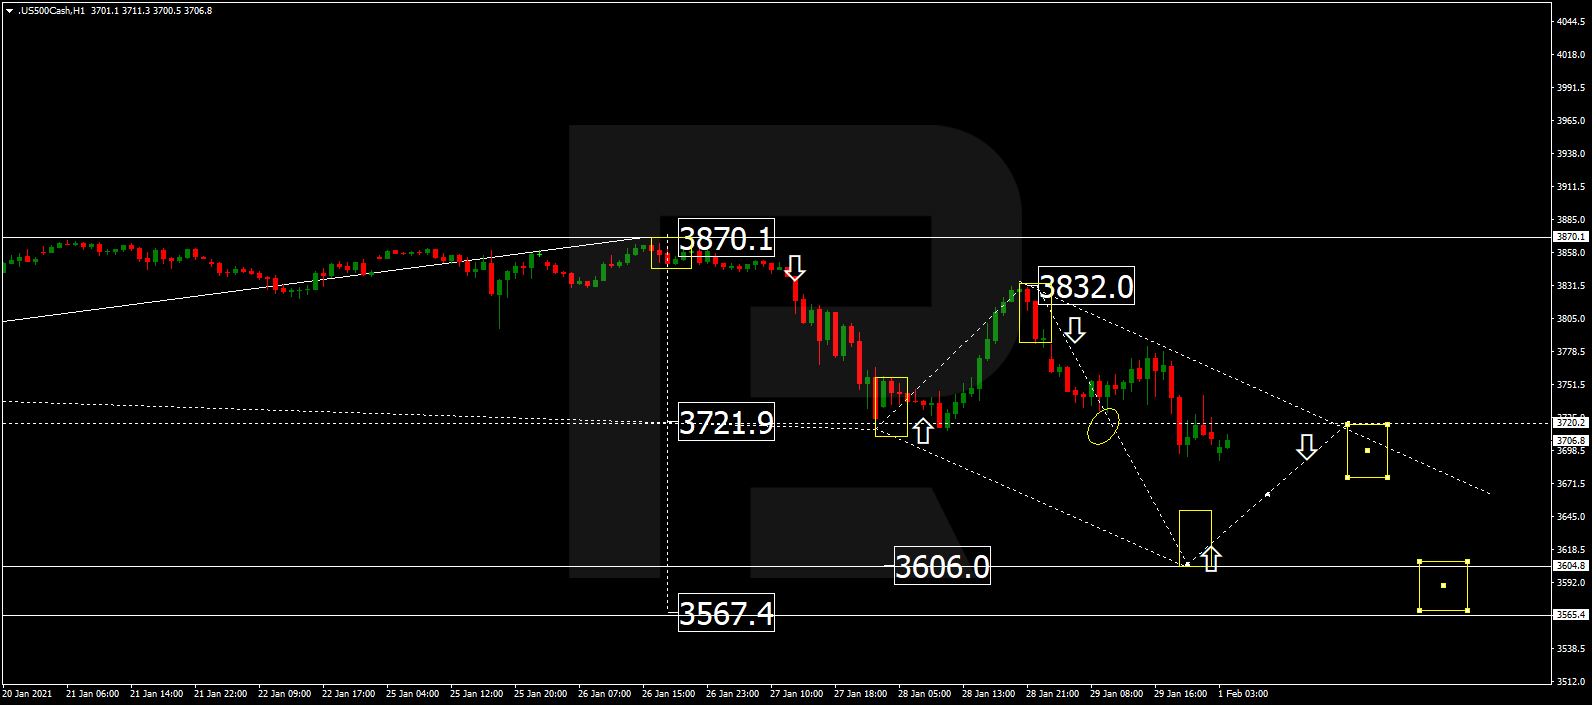
S&P 500
After finishing the descending wave at 3720.2, the S&P index is consolidating around this level. Possibly, the asset may break the range to the downside and fall with the short-term target at 3606.0. After that, the instrument may start a new correction towards 3720.0.